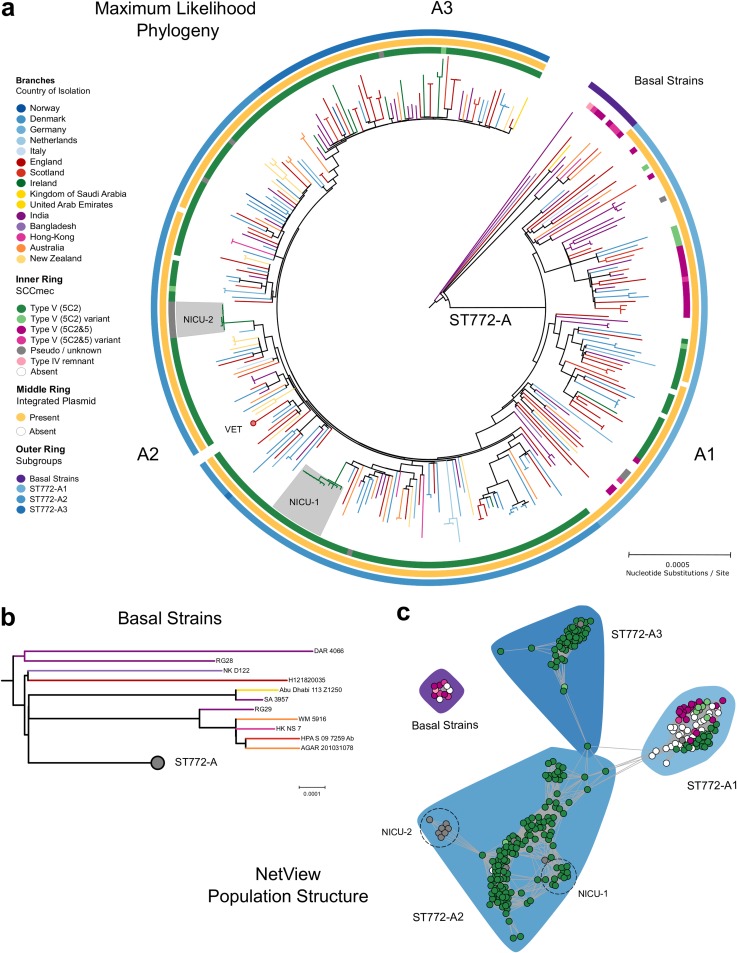
FIG 1.
Evolutionary history and population structure of ST772. (a) Maximum likelihood phylogeny of ST772 (n = 340) based on 7,063 core genome SNPs. Branch colors indicate country of isolation, the inner ring delineates presence and type of SCCmec, the middle ring shows presence of the integrated resistance plasmid, and the outer ring indicates community membership of the population graph shown in panel c. Communities match the tree topology, with several basal isolates (n = 11) and a single derived clade, ST772-A (n = 329), composed of three population subgroups (A1 to A3). Isolates from two outbreaks in neonatal intensive care units in Ireland are indicated in gray (NICU-1 and NICU-2). Only one representative isolate from longitudinal sampling of a single health care worker (VET, n = 39) is shown (red circle). (b) Basal strains of ST772 showing positions of isolates from India and Bangladesh at the root of the phylogeny (RG28, DAR4066, and NKD122). (c) Population graph based on pairwise SNP distances, showing SCCmec type (node color as for panel a) and population subgroups (polygons, A1 to A3). Dashed circles indicate hospital-associated outbreaks in Ireland (NICU-1 and NICU-2).

