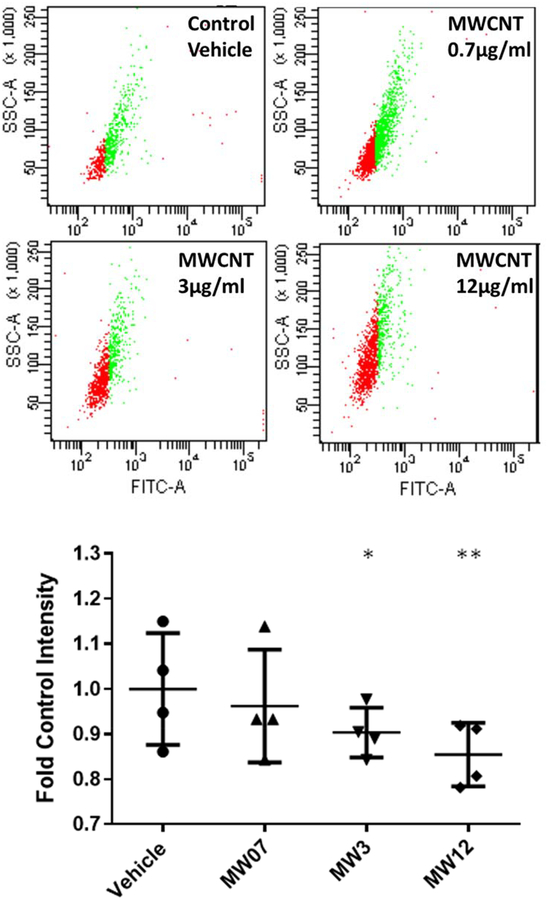
Figure 5.
Succinate Dehydrogenase A (SDHA) staining per cell, as measured by flow cytometry. Average intensity of cellular FITC-labeled SDHA was used to determine mitochondrial abundance per cell, independent of metabolic activity. Values are expressed as fold control FITC-staining intensity and show a dose-dependent decrease in mitochondrial abundance with increasing concentrations of MWCNTs from 0.7–12 μg/ml (MW07, MW3, MW12). Statistical significance determined by paired t-tests (N = 4, *p < 0.1, **p < 0.05)

