

Abstract
Growth rate and metabolic state of bacteria have been separately shown to affect antibiotic efficacy1–3. However, the two are interrelated as bacterial growth inherently imposes a metabolic burden4; thus, determining individual contributions from each is challenging5,6. Indeed, faster growth is often correlated with increased antibiotic efficacy7,8; however, the concurrent role of metabolism in that relationship has not been well characterized. As a result, a clear understanding of the interdependence between growth and metabolism, and their implications for antibiotic efficacy, are lacking9. Here, we measured growth and metabolism in parallel across a broad range of coupled and uncoupled conditions to determine their relative contribution to antibiotic lethality. We show that when growth and metabolism are uncoupled, antibiotic lethality uniformly depends on the bacterial metabolic state at the time of treatment, rather than growth rate. We further reveal a critical metabolic threshold below which antibiotic lethality is negligible. These findings were general for a wide range of conditions, including nine representative bactericidal drugs and a diverse range of Gram-positive and Gram-negative species (Escherichia coli, Acinetobacter baumannii and Staphylococcus aureus). This study provides a cohesive metabolic-dependent basis for antibiotic-mediated cell death, with implications for current treatment strategies and future drug development.
To investigate the extent to which growth and metabolism each contribute to antibiotic lethality, we first sought to establish conditions under which the two readily exhibit coupling and uncoupling. Metabolic coupling typically refers to scenarios in which both growth and metabolism are nutrient-limited; by contrast, metabolic uncoupling occurs when only growth is nutrient-limited, despite an excess of available energy10,11. Consistent with literature, we refer to any conditions under which growth and metabolism are positively correlated with nutrient availability as coupled, whereas uncoupled describes any conditions under which growth is correlated with nutrient availability but metabolism is not (Fig. 1a).
Fig. 1 |. Uncoupling growth from metabolism.
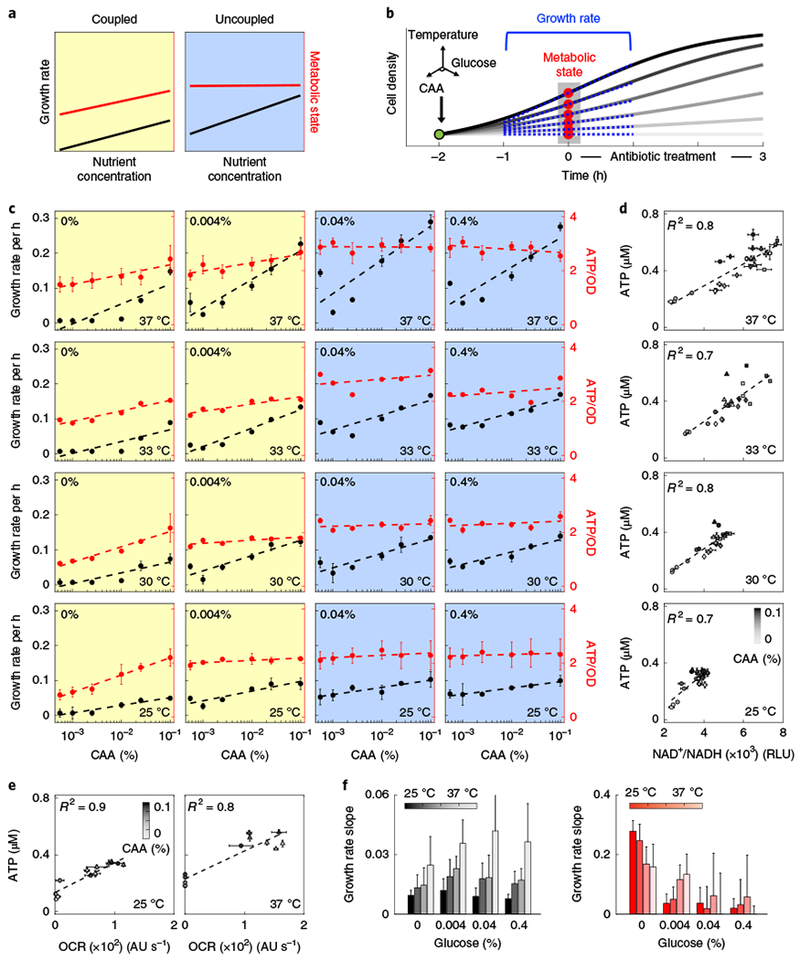
a, Coupled and uncoupled growth and metabolism. Coupled growth and metabolism is defined as any condition in which both are correlated with increasing nutrient (yellow). Uncoupled refers to scenarios in which growth is correlated with increasing nutrient but metabolism is not (blue). b, Experimental schematic showing illustrative growth curves with increasing levels of nutrient (light to dark grey). The addition of glucose and/or CAA is indicated in green. The red dots indicate the time at which antibiotics are added and metabolism measurements are obtained. The blue tangent lines represent estimates of growth rate that are measured in the absence of antibiotics, through a time window that spans the introduction of the drug. The three-dimensional axes represent the potential environmental conditions introduced at t−2. c, Modulating growth and metabolism. Growth rate and metabolic state (ATP/OD) are shown by the left (black) and right (red) y axes, respectively. The x axis shows the percentage of CAA concentration. Coupled (yellow) and uncoupled (blue) growth and metabolism are indicated. The glucose concentration is indicated in the top left and the temperature is indicated in the bottom right. d, NAD+/NADH correlates with ATP. Shading (light to dark) indicates increasing concentrations of CAA. Circle, diamond, square and triangle symbols indicate increasing levels of glucose. Data in c and d are the mean of three biological replicates, except at 33 °C, for which the data are the mean of two replicates; error bars that indicate s.d. are included where applicable. Dashed lines were fitted using a single-variable linear regression (Supplementary Table 3). e, OCR correlates with intracellular ATP, measured at 25°C (left) and 37°C (right) for 0% (circles) and 0.4% (triangles) glucose. Shading (light to dark) indicates increasing concentrations of CAA. Data are mean ± s.d. of four biological replicates; the dashed lines are fits obtained using single-variable linear regressions. f, Slopes from c for growth rate (left, black) and ATP/OD (right, red). Shading (dark to light) indicates increasing temperature. Error bars represent 2 s.e. of the slope estimates (Supplementary Table 3).
Growth and metabolism become increasingly uncoupled as the utilization efficiency of resources declines12,13. As this efficiency depends on the ratio and abundance of carbon and nitrogen nutrient composition14,15, we reasoned that varying these concentrations would facilitate tunable coupling and uncoupling. We focused on glucose as the carbon source because it is inefficiently metabolized at high concentrations16; we chose amino acids as the nitrogen source as amino acid biosynthesis accounts for a substantial fraction of the cell’s energy budget17,18 and therefore represents a straightforward way to implement nutrient limitation (Supplementary Text). Intuitively, the high energetic burden of amino acid biosynthesis is alleviated by exogenous amino acid supplementation11. Thus, excess glucose enables more efficient allocation of glucose-derived ATP towards biomass instead of amino acid production, which—in turn—increases growth without significantly altering cellular respiration18,19.
To test whether this approach would be feasible, we applied flux balance analysis (FBA) to a genome-scale model of E. coli metabolism20 and simulated the effects of different combinations of glucose and casamino acid (CAA) concentrations on the rates of growth and ATP production. We chose ATP as the metabolic reporter because ATP is the primary energy source for nearly all biological processes21, is commonly used for estimates of metabolic uncoupling22 and because reduced ATP levels have been associated with diminished antibiotic efficacy and persister cell formation23. Indeed, FBA predicted uncoupling between ATP synthesis and growth rate for sufficiently high concentrations of glucose (at least the half-maximum inhibitory concentration (IC50)) for a range of CAA concentrations (Supplementary Fig. 1a,b, Supplementary Tables 1 and 2).
To verify this experimentally, E. coli cells that were grown overnight were first sub-cultured in MOPS minimal medium for 2 h. Before the exponential phase, cells were condensed 2× (optical density at 600 nm (OD600) ≈ 0.15) in 25% MOPS:PBS and supplemented with different combinations of glucose (0%, 0.004%, 0.04% and 0.4%) and CAA (0%, 0.001%, 0.0025%, 0.01%, 0.025% and 0.1%). Bacteria did not enter, nor remain in, exponential-phase growth at the same times under all of the conditions (Supplementary Fig. 1c); thus, measurements at 25 °C, 30 °C, 33 °C and 37 °C were performed to ensure a wide range of overlapping growth rates, growth phases and cell densities. Diluted MOPS was used to minimize background nitrogen content, which maximized the effect of CAA on growth and metabolism; this dilution did not affect growth in the absence of CAA under these conditions (Supplementary Fig. 2a).
Growth rates were determined at an early time when the OD600 was linearly correlated with colony-forming units (CFU; Supplementary Fig. 2b), defined as (where Δt=2). Therefore, t0 corresponds to 2 h after nutrient supplementation (t−2), which provides cells with sufficient time to adapt to CAA and glucose24 (Fig. 1b). This definition consistently captured the diverse growth rates across all conditions (Supplementary Fig. 2c). To determine the metabolic state, we quantified intracellular ATP using the BacTiter-Glo assay (Fig. 1c, Supplementary Fig. 3). We also measured the ratio of NAD+/NADH and the oxygen consumption rate (OCR); both of these metrics are directly related to ATP synthesis25 and were indeed correlated with ATP levels (Fig. 1d,e, Supplementary Fig. 4a–c).
We performed linear regressions to characterize the change in growth or metabolism as a function of CAA concentrations, and mathematically defined uncoupled as cases in which the metabolism slope was not statistically greater (2 s.e.) than 0 while the growth slope was statistically greater than 0 (Supplementary Fig. 4d, Supplementary Table 3). We saw that growth slopes remained largely constant across different glucose concentrations (Fig. 1f, left), suggesting that growth was dependent on CAA for all conditions. Conversely, metabolism slopes decreased with increasing levels of glucose, statistically equalling 0 when the concentration of glucose was ≥0.04% (Fig. 1f, right), as predicted by FBA. Together, these observations confirm uncoupling at sufficiently high levels of glucose for all temperatures.
Having jointly quantified growth and metabolism, we sought to examine their effects on antibiotic efficacy. We first focused on a subset of conditions at 37 °C; we noticed an obvious transition between coupled and uncoupled from 0.004% to 0.04% glucose (Fig. 2a). We tested nine bactericidal antibiotics at 20× the minimum inhibitory concentration (MIC) after 3 h of treatment, including three aminoglycosides (gentamicin, streptomycin and kanamycin), three quinolones (ciprofloxacin, norfloxacin and levofloxacin), two β-lactams (ampicillin and carbenicillin) and one cephalosporin (cefsulodin), covering common major classes of antibiotics (Supplementary Table 4a,b). Assuming that growth/death is exponential (Supplementary Fig. 4e), the antibiotic-mediated death rate can be approximated by the survival ratio (log(100 × CFUTreated/CFUControl)), which corresponds to the log-transformed CFU of the treated culture minus the log-transformed CFU of the untreated culture at the same time point (Supplementary Text and Supplementary Equation 5). Intuitively, this lowers the observed cell count of the survivor population (CFUTreated) by the maximum number of cells that could have arisen through growth (CFUControl). As this approximation may overestimate cell death for fast-growth conditions, we can conclusively interpret that the antibiotic-mediated lethality rate is independent of the growth rate only if they exhibit either a statistically neutral or positive correlation.
Fig. 2 |. Metabolic state correlates with antibiotic lethality for both coupled and uncoupled conditions.
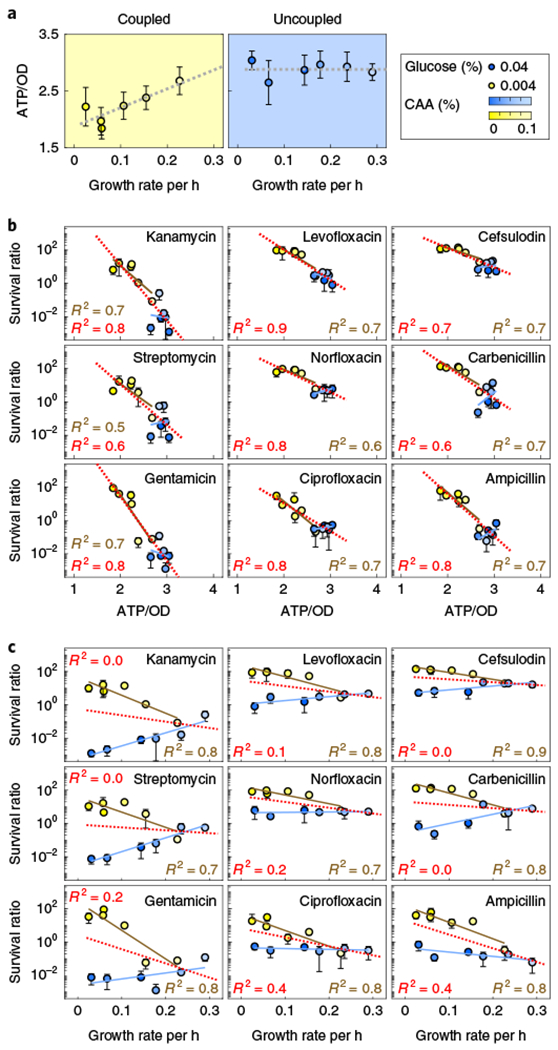
a, Glucose modulates growth and metabolic coupling. Cells were supplemented with 0%, 0.001%, 0.0025%, 0.01%, 0.025% or 0.1% CAA (dark to light colour) with either 0.004% (left, yellow) or 0.04% (right, blue) glucose at t−2 and 37°C for 2 h. Intracellular ATP and growth rate showed coupling with low glucose (yellow) and uncoupling with high glucose (blue). The dotted grey lines indicate single-variable linear regression fit. b, Antibiotic lethality was correlated with levels of intracellular ATP for all conditions. Nine antibiotics (gentamicin, streptomycin, kanamycin, ciprofloxacin, norfloxacin, levofloxacin, ampicillin, carbenicillin and cefsulodin) were added at t0 at 20× MIC. Survival was quantified as the log-transformed CFU of treated cells minus the log-transformed CFU of untreated cells after 3 h. c, Antibiotic lethality is independent of growth rate when growth and metabolism are uncoupled. Data from b are plotted against growth rate (x axis). In all cases, data are mean ± s.d. of four biological replicates measured on at least two independent days. For b and c, yellow and blue solid lines are the linear regression fits for coupled and uncoupled conditions individually; red dotted line is the regression fit using all blue and yellow data points combined.
In coupled scenarios (0.004% glucose; Fig. 2a, left), we would expect antibiotic lethality to increase with both increasing levels of ATP and growth rate. However, when metabolism is uncoupled from growth (for example, 0.04% glucose; Fig. 2a, right), any observable dependence on ATP (or growth rate) would indicate a metabolism-specific (or growth-specific) effect of antibiotic lethality that occurs independently of growth (or metabolism). We found that survival was uniformly and inversely correlated with ATP through a log-linear relationship for all nine bactericidal antibiotics at 20× MIC, regardless of coupling/uncoupling (Fig. 2b). By contrast, survival remained negatively correlated with growth rate only for coupled conditions. When uncoupled, survival became non-negatively correlated with growth rate (Fig. 2c, Supplementary Table 4c). These findings were also maintained at 2× MIC, at additional time points and with alternative sugars (Supplementary Figs. 4e,f and 5). Together, these results suggest that the metabolic state correlates with antibiotic lethality better than growth rate.
To determine generality across growth rates, we next quantified survival for all concentrations of glucose and CAA and temperatures using the representative bactericidal drugs gentamicin, ciprofloxacin and ampicillin. Doing so revealed that under coupled conditions (for example, 0% and 0.004% glucose), the growth rate was inversely correlated with survival for all three antibiotics; by contrast, growth rate was largely unable to predict survival when uncoupled from metabolism (0.04% and 0.4% glucose; Fig. 3a), consistent with Fig. 2. There were three uncoupled conditions at 25 °C in which survival statistically decreased over a range larger than the typical error associated with CFU measurements (~10%; Supplementary Table 5). However, data clustering due to minimal growth resulted in skewed linear fitting. Therefore, to expand the relevant range of growth rates, we normalized survival at each temperature by the mean, and pooled data by glucose concentration. In all cases, growth rates were statistically negatively correlated with survival only when coupled to metabolism, consistent with Figs. 2 and 3 (Supplementary Fig. 6, Supplementary Table 5e), supporting the notion that uncoupled growth rates are not correlated with antibiotic lethality.
Fig. 3 |. Antibiotic lethality depends on cellular metabolism during exponential growth over a wider parameter space.
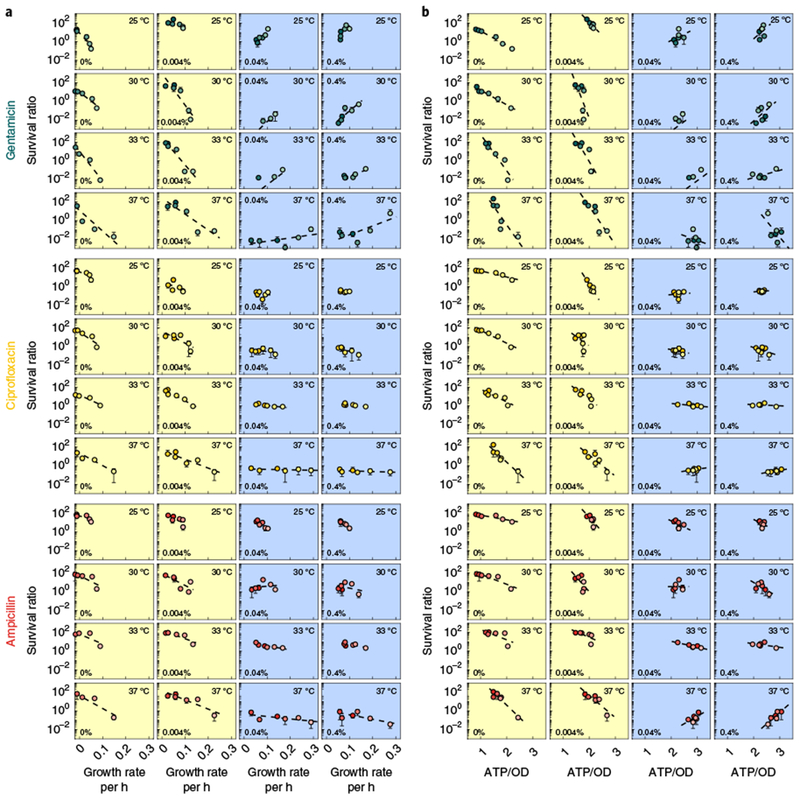
a,b, Survival was measured for all concentrations of glucose and CAA and temperatures using a subset of representative bactericidal drugs (gentamicin (green), ciprofloxacin (yellow) and ampicillin (red)) at 20× MIC, and is plotted against growth rate (a) or ATP/OD (b). Yellow plots indicate coupled glucose concentrations. Blue plots indicate uncoupled glucose concentrations. The glucose concentration is indicated in the bottom left, and the temperature is indicated in the top right. The dashed black lines are the linear regression for each glucose-temperature combination as a function of CAA concentration. All regression statistics can be found in Supplementary Table 5. Data points for survival are the mean of four biological replicates in all cases except for 33 °C, for which there are two replicates; error bars that indicate s.d. are included where applicable.
Consistent with Figs. 2 and 3a, ATP was inversely correlated with survival when coupled to growth (Fig. 3b). However, when uncoupled, survival remained approximately constant for all but two cases (Supplementary Table 5f). This indicates that metabolism-independent effects on survival are minimal, as our definition of uncoupled specifies constant ATP levels. To increase the range of ATP, we further pooled all 96 data points by normalizing the survival, growth rate and ATP/OD by their means at each glucose concentration and temperature; this uncoupled growth and ATP across all of the conditions. Indeed, sorting survival by either increasing ATP or growth rate resulted in trends driven by either level of ATP or growth rate individually (Supplementary Fig. 7a, Supplementary Table 3e). Interestingly, survival generally decreased with increasing levels of ATP for all three drugs at 2× and 20× MIC; by contrast, survival exhibited no obvious trend with increasing growth rate at the same concentrations (Fig. 4a). Normalization did not skew the data; the OD600 of untreated cells remained correlated with growth rate (Supplementary Fig. 7b).
Fig. 4 |. Metabolic-dependent threshold for lethality and generality.

a, Metabolic state correlates better with antibiotic lethality than growth rate for all data. The pooled 96 data points were normalized and sorted by either increasing ATP/OD (top row) or growth rate (bottom row). The effects on growth and metabolism are shown in the grey bar graphs (left two panels) and survival is shown in the coloured bar graphs for 2× (lighter) and 20× (darker) MIC (right three panels). b, Critical metabolic threshold for antibiotic lethality. Survival is measured at CAA concentrations of 0, 0.001, 0.0025, 0.01, 0.025 and 0.1%; shading (dark to light) represents increasing concentrations. ATP/OD is normalized to ATPcrit. Horizontal (100% survival ratio) and vertical (critical threshold) dotted lines are drawn as guides. Survival is normalized to the ATP value immediately preceding the threshold. Data are the mean survival of four biological replicates. c, Corresponding ATPcrit value from b. The y axis shows ATPcrit before normalization, and the x axis shows temperature. Data are the mean survival of four biological replicates. d, Mathematical schematic with simplified assumptions. Survival undergoes a switch-like transition at a normalized metabolic state of m = 1 and decreases linearly at a rate α. M and M0 are the non-dimensionalized metabolic states of ATP and ATPcrit, respectively. e, Results are general to malic acid at concentrations of 0, 4, 12.6, 40 and 126.5 μg ml−1; shading (dark to light) indicates increasing concentrations. Data are the mean survival of four biological replicates. f, Increasing metabolic sensitivity using ΔatpA. The following CAA concentrations were used: 0%, 0.01% and 0.1%; shading (dark to light) represents increasing concentrations. Data are the mean ± s.d. survival of three biological replicates. g, Decreasing metabolic sensitivity using glutathione. CAA-treated cells (0%, 0.0025%, 0.01% and 0.1%) were supplemented with 10 mM reduced glutathione. Non-normalized data are provided in Supplementary Fig. 11e. Shading (dark to light) represents increasing CAA concentrations. Data are the mean ± s.d. of three biological replicates. In all cases, the error bars indicate s.d. The y axis for e-g shows the survival ratio and the x axis shows ATPN. 20× MIC was used for all drugs (Supplementary Table 4). In all cases except for d, colours indicate drug (gentamicin (green), ciprofloxacin (yellow), ampicillin (red) and control (grey)). The control (dotted line) for f and g is the linear regression fit of BW25113 data using the corresponding subset of CAA concentrations for each panel.
Interestingly, we noticed an emergent biphasic dependence of bacterial survival with increasing levels of ATP (Fig. 4a). We further examined the non-normalized survival data as a function of CAA in the absence of glucose as this yielded the widest dynamic range of ATP. Consistent with the pooled dataset, we saw minimal lethality at low CAA. However, once CAA was sufficiently high, survival was characterized by an approximately log-linear correlation as a function of the nutrient (Supplementary Fig. 8a,b). To compare this trend across different drugs, we normalized ATP (ATPN) to the corresponding biphasic transition point (ATPcrit) that resulted in an approximate collapse of survival across the different drug classes (Fig. 4b, Supplementary Figs. 8c,d, 9 and 10, Supplementary Table 6). Our limited x-axis resolution prevented us from conclusively determining whether ATPcrit is drug-specific. However, this approximate collapse reveals trends that occur owing to global changes in the metabolic state between conditions. Indeed, ATPcrit remains relatively constant with increasing temperature, which explains the increasing slope and apparent loss of the biphasic plateau (ATPN < 1) at 37 °C (Fig. 4b,c).
We built a simplified mathematical model to describe the log-linear relationship between survival and ATPN. Specifically, the survival fraction depends on the initial metabolic state m (Fig. 4d). Under the minimal assumptions that cell death follows first-order kinetics (see Methods), a relationship between the antibiotic-mediated cell death rate (d) and the initial metabolic state emerges: d=μ + α/t(m − 1) if m > 1 and d = 0 otherwise, where α is a drug-specific metabolic-dependent slope constant, t is time and μ is the growth rate. That is, the death rate linearly increases with the metabolic state of the cells at the time the antibiotic is administered. The model accurately captures our main results (Supplementary Fig. 10a,b, Supplementary Table 7) and, furthermore, suggests proportionality between time and the metabolic-dependent slope, which we verified (see Methods; Supplementary Fig. 10c and Supplementary Table 8). Together, this implies that the primary effect of growth is to set the upper survival threshold at the minimum level of ATP (Supplementary Fig. 10d).
Intuitively, the slope α is a relative parameter that establishes a relationship between the initial metabolic state and subsequent rate of cell death—as ATPcrit increases, the slope decreases. To demonstrate the generality of this principle, we perturbed various aspects of cellular metabolism using alternative non-nutrient metabolites (malic acid and adenosine), pre-culture carbon sources (xylose) and both Gram-negative and Gram-positive clinically relevant species (A. baumannii and S. aureus, respectively; Fig. 4e, Supplementary Fig. 11a–d). The dependence on ATP was preserved throughout, and α generally increased or decreased with corresponding changes in the average ATPcrit, as expected (Supplementary Table 6c).
Bactericidal antibiotic lethality results, in part, from a sequence of downstream metabolic events that follow initial drug-target binding1,2,26. Targeting these metabolic processes should enable us to predictably modulate α. We hypothesized that accelerated respiratory activity would potentiate antibiotic lethality27, corresponding to a larger α. We therefore used an atpA-deficient genetic mutant (ΔatpA), the growth of which is uncoupled from ATP production and exhibits increased basal respiration27. Consistent with our hypothesis, ΔatpA cells exhibited a significantly lower ATP threshold and, therefore, a larger α when treated with antibiotics compared with wild-type cells (Fig. 4f, Supplementary Table 6). By contrast, we hypothesized that minimizing the accumulation of downstream toxic metabolic by-products (for example, damaging reactive species) would attenuate metabolic-dependent lethality, resulting in a smaller Δ. To test this, we used the antioxidant glutathione, which buffers toxic overflow from cellular respiration28. Indeed, pretreatment with 10 mM glutathione largely eliminated metabolic-dependent antibiotic lethality, significantly reducing α (Fig. 4g, Supplementary Fig. 11e).
The observations that antibiotics are highly effective on rapidly growing cells, and that cellular metabolism plays a key role in antibiotic lethality, are complementary and yet are previously largely addressed separately in the literature. Our study provides a unified explanation by showing that antibiotic lethality is better correlated with the metabolic state of the cell, which may or may not be correlated with growth. These findings suggest that antibiotics, in many cases, should be able to kill non-growing bacteria provided that cellular metabolism is sufficiently primed or stimulated. This is consistent with an increasing number of studies2, and supported by our low-temperature conditions in which CFU did not statistically increase (Supplementary Fig. 11f). Our results are also consistent with recent observations that ATP depletion can induce persister formation in E. coli and S. aureus23 by reducing ATP levels below the critical threshold required for antibiotic-induced cell death. Our findings, however, support an interpretation that extends beyond bacterial persisters, highlighting the nuanced, yet non-trivial, delineation between first-order and second-order lethality mechanisms. Indeed, our results emphasize that growth-dependent effects, such as target kinetics or expression levels7,29, are not sufficient to account for antibiotic-mediated lethality alone. Instead, the metabolic response following the initial drug target interaction is critical and drives many aspects of the bacterial response to antibiotic exposure. Understanding these effects will be key to developing novel therapeutics that more effectively target bacteria in non-permissive states, as well as enhancing the efficacy of existing antibiotics with appropriate adjuvants to push bacterial pathogens over the critical metabolic threshold towards their death.
Methods
Strains and growth conditions.
For all of the experiments, single clones picked from agar were inoculated in 3 ml Luria-Bertani (LB) medium and grown at 37 °C with 300 r.p.m. agitation for 16 h overnight. A list of strains and species used in this study is provided in Supplementary Table 1. MIC measurements were obtained as a means to normalize concentration choices. Specifically, cells were diluted 10,000× from overnight cultures into MOPS minimal medium supplemented with 0.4% glucose and 0.1% CAA, and two-fold serial dilutions of each antibiotic were performed such that each well contained a final volume of 100 μl at concentrations chosen to cover the expected MIC. Plates were sealed with AeraSeal membranes (Sigma-Aldrich, A9224) and placed in a shaking incubator at 37 °C with 900 r.p.m. agitation for 24 h. OD600 measurements were used to determine the lowest concentration at which no growth was detected. MICs were performed in biological triplicate (Supplementary Table 4).
Experimental conditions for coupled and uncoupled growth and metabolism.
Overnight cultures were washed once in PBS and diluted 40× into MOPS minimal medium (Teknova, M2106) supplemented with 0.04% glucose. To initiate growth, sub-cultures were incubated at 37 °C with 300 r.p.m. agitation in 50 ml Falcon tubes with bioreactor caps for aeration. Before shifting into log phase (~2 h), cultures were centrifuged for 10 min at 4 °C and 4,000 r.p.m., and condensed 2× (to OD600 ≈ 0.15) in MOPS buffer diluted 3:1 in 1× PBS. Then, 200 μl of resuspended cells were distributed into wells of a 96-well microtitre plate. Exogenous nutrients or metabolites were added at this time, and experimental temperatures were set, and the plate was sealed with an AeraSeal membrane (Sigma-Aldrich, A9224; Fig. 1b). Plates were agitated at 200 r.p.m. in a benchtop temperature-controlled shaker at the designated temperature. Spot plating was performed using tenfold serial dilutions in Milli-Q H2O in technical duplicates to obtain all CFU measurements, and all of the experiments were performed with four biological replicates on at least two independent days from distinct individual colonies unless otherwise noted. For conditions with antibiotic treatment, all plates were washed once in PBS at the end of the treatment period to remove the drug before dilutions and plating. All combinations of CAA (0%, 0.001%, 0.0025%, 0.01%, 0.025% and 0.1% w/v) and glucose (0%, 0.004%, 0.04% and 0.4% w/v) were measured at each temperature.
To determine growth rates for each set of conditions, plates were set up in identical conditions as described above, and OD600 measurements were taken once every hour over the course of 5 h (Supplementary Fig. 1c). Growth rates were compared using sliding windows of 2 h along the entire log-transformed growth curve, along with other established methods30,31. All of the metabolism measurements (described below) were taken at t0 immediately before antibiotic treatment. Experiments were performed similarly with xylose and maltose for generality with the following modifications: cells were not condensed 2× and survival was quantified at 4 h instead of at 3 h (Supplementary Fig. 5). These changes were introduced to ensure that slower growth rates under these less-rich sugars were comparable to growth rates that occurred with glucose. We note that 100% standard MOPS minimal medium was used for these experiments as well, however, this did not influence growth under these conditions (Supplementary Fig. 2a).
To determine the IC50 for all sugars, cells were diluted 10,000× from overnight cultures into MOPS minimal media, and glucose, maltose or xylose was added at logarithmically spaced concentrations from 0.0001% to 1% (w/v). Plates were grown analogous to MIC experiments for 18 h. The steady-state biomass (OD600) was obtained, and the data were fitted using the following equation:
Statistical analysis for distinguishing coupled and uncoupled conditions.
Linear regressions were performed on both growth rate and ATP/OD, as a function of CAA, as demonstrated in Fig. 1c. After validating this approach by ensuring the residuals were normally distributed (Supplementary Fig. 4d), we calculated the slopes and confidence intervals for each sub-panel in Fig. 1c (Supplementary Table 3). Conditions were classified as coupled if both slopes were positive and if the confidence intervals, defined as 2 s.e. of the slope estimate, remained positive (Fig. 1f). Conditions were classified as uncoupled if the growth slope was statistically positive (as above) and the ATP/OD slope was statistically non-positive (confidence interval either contained 0 or fell entirely below 0).
Metabolism quantification.
OCR.
An OCR assay kit (Cayman Chemical, 600800) was used to verify respiration activity (Fig. 1e, Supplementary Fig. 4a,b). Assays were performed at t0, analogous to the time of antibiotic addition, according to the manufacturer’s instructions. Kinetic measurements were obtained every 5 min thereafter for a total duration of 2 h, and the OCR was measured as the slope of the linearly increasing portion of the curve, as described by the manufacturer. This rate was then normalized to the initial OD600 to account for cell density effects. OCR was measured for the extreme glucose concentrations (0% and 0.4%) across all concentrations of CAA at 25 °C and 37 °C in biological triplicates.
Intracellular ATP.
ATP was quantified using a BacTiter-Glo kit (Promega, G8231) according to the manufacturer s instructions. To establish a standard curve, we performed tenfold dilutions of purified ATP, and added 25 μl of the diluted mixtures to alternating wells of a 384-well opaque white microtitre plate in technical triplicates. Subsequently, 25 μl of BacTiter-Glo reagent was added to each well. The contents were mixed by pipette, incubated at room temperature for 5 min and then luminescence readings were obtained using a SpectraMax Molecular Devices plate reader (Supplementary Fig. 4c, left). All of the ATP measurements were obtained in biological triplicate at t0 immediately before addition of antibiotics.
NAD+/NADH.
NAD+/NADH was quantified using a NAD/NADH-Glo Assay (Promega, G9071) according to the manufacturer s instructions. A standard curve was established to ensure that signals were obtained within the linear range of detection. To do so, purified NAD+ or NADH (Sigma-Aldrich, N8285 or N6660, respectively) were quantified individually by performing tenfold serial dilutions according to the concentration ranges specified. Ratios of the two were then mixed at 4:1 and 1:4 to ensure the scaling factors were accurate. As NAD+ and NADH were not quantified separately in the experiments, our units are relative light units (RLU). All ratios (0–100%) of NAD+/NADH were quantifiable within the same linear RLU range (Supplementary Fig. 4c, right). Measurements were obtained after 45 min of incubation according to the manufacturer’s instructions. NAD+/NADH measurements were obtained from three biological replicates for all conditions at t0.
Metabolic network modelling.
Metabolic simulations were performed by FBA using the COBRA Toolbox v.2.032 in MATLAB with the Gurobi Optimizer v.8.1.0 (Gurobi Optimization) on the iJO1366 genome-scale model of E. coli metabolism20. For each CAA and sugar combination, amino acid concentrations were estimated on the basis of free amino acid fractions from the BD Bionutrients Technical Manual and scaled according to 0%, 0.001%, 0.0025%, 0.01%, 0.25% and 0.1% w/v (Supplementary Table 2a). Concentrations of glucose, xylose or maltose were similarly estimated at 0%, 0.002%, 0.004%, 0.0008%, 0.04%, 0.08% and 0.4% w/v (Supplementary Table 2b). E. coli metabolism was simulated for each CAA and sugar combination by setting these concentrations as the lower bounds of exchange reactions corresponding to the amino acids or sugars, preserving the relative proportions between each metabolite. FBA simulations were then performed, optimizing for the biomass objective function (Supplementary Table 2c). For each reaction in the condition-specific models, the metabolic efficiency was calculated by normalizing ATP synthase-mediated ATP production by the biomass rate (Supplementary Table 2d). Growth and metabolism were considered to be sufficiently uncoupled at sugar concentrations at which the percentage change in metabolic efficiency across CAA was more than 100-fold less than the corresponding change under coupled conditions (for example, 0.04% glucose).
Statistical analysis of survival as a function of growth rate.
Survival data as a function of growth rate were determined to be significant using an analogous approach as was used to distinguish coupled from uncoupled conditions. Conditions were classified as significantly correlated if the slopes were negative and the confidence interval remained negative (Supplementary Table 5). Conditions were classified as significantly uncorrelated if the slopes were negative and the confidence interval included 0, or the slopes were calculated to be positive. On the basis of our conclusion that survival was correlated with growth rate when coupled to metabolism (0% and 0.004% glucose; Fig. 3), linear regression statistics were used to identify any outliers—coupled conditions for which survival did not significantly decrease, or uncoupled conditions (0.04% and 0.4% glucose) for which survival did significantly decrease. Conditions set in bold in Supplementary Table 5a denote such conditions. To determine whether these statistical outliers were attributable to assay variability, conditions set in bold were confirmed if the individual data points significantly decreased (approximately and/or greater than 10% error inherent in our CFU measurements). The conditions in Supplementary Table 5a highlighted in yellow are the remaining outliers that are discussed in the main text.
Statistical analysis of survival as a function of metabolism.
Survival data as a function of metabolism were determined on the basis of the vertical spread for a given CAA concentration (Fig. 3b). Coupled conditions were evaluated analogously to growth rate. Uncoupled conditions were classified as significantly changing if the vertical spread of the data (quantified as 1 s.d.) was greater than the inherent variability of our CFU assay (~10%; Supplementary Table 5f). Only the vertical spread was considered because uncoupled conditions, by definition, have constant ATP levels as a function of CAA concentration. The conditions in Supplementary Table 5f highlighted in yellow are the remaining outliers that are discussed in the main text.
Data processing to determine the critical ATP threshold.
To identify the critical transition point (similar to Balaban et al.33), the data were first interpolated using a 100-point mesh to account for error associated with CFU variability (Supplementary Fig. 9a,b). Two linear regressions were then fitted, either forwards (Supplementary Fig. 9c, left), starting at the minimum ATP and extending point-wise in the forward direction, or reverse, (Supplementary Fig. 9c, right) starting at the maximum ATP and extending point-wise in the reverse direction. The minimum and maximum slope in the forward and reverse direction, respectively, were taken as the best fits, and the corresponding index of each associated point was collected. If the collected points corresponded to the first and last true data points, the line was deemed monotonic and t-tests were used to determine the minimum ATP at which there was a statistical decrease. Otherwise, the region located in-between the optimal line fits was extended outwards by 17% on both sides to capture the farthest possible true data point (100-point mesh with 6 true data points). ATPcrit, defined by the maximum of the second derivative (Supplementary Fig. 9d), was located within this region. Finally, we compared the 95% confidence interval of the mathematically identified ATPcrit; if survival at this point was statistically non-significant to survival at the adjacent ATP value, we shifted the normalization index to the next greater index (Supplementary Fig. 9e).
The entire process was performed automatically using a custom MATLAB script, which output an index value to normalize the x axis, denoted ATPN. Survival at ATPN below 1 did not necessarily exhibit zero lethality; rather, the lethality rate did not change significantly until ATPN = 1. To account for the basal lethality, we normalized the y axis to survival located at index – 1. Sample non-normalized survival data can be found in Supplementary Fig. 10a. All of the lines were fit using first-order polynomial linear regressions for all data points for which ATPN ≥ 1. A complete list of α values can be found in Supplementary Table 8. Slope values of greater than 30% apart are considered to be statistically different, as this is the average error associated with our CFU measurements. To directly compare lethality rates under perturbed conditions for either the ΔatpA genetic mutant or glutathione-treated cells (Fig. 4f,g), the index used to normalize the x axis was obtained from the corresponding control data. In all other cases, the index was calculated directly from the respective dataset.
Data normalization.
Data from Supplementary Fig. 6 were normalized as follows: conditions were grouped by temperature and normalized to the average of that specific group. In doing so, 4 × 4 subplot panels (Fig. 3) could be reduced to 1 × 4, with one plot per glucose. This procedure maintains survival trends while accounting for a potential temperature-dependent skew on the growth rates, thus enabling inter-condition comparisons. To pool all 96 data points, the temperature-normalized data were then normalized to the average per glucose group, collapsing the entire dataset into a single dimension. For Fig. 4a, all data are normalized to the maximum for numerical interpretation; here, it was critical to remove any growth rate with a quantification of 0 to avoid artefacts of normalizing to these numbers. We included these data in all of the other figures, and we note that this does not influence the observed trends, as arbitrarily setting these growth rates equal to a small value (0.001) yields the same results (Supplementary Fig. 7).
Mathematical modelling.
We use a simplified mathematical description of the phenomenological data whereby the survival fraction undergoes an abrupt transition at a critical metabolic threshold (Fig. 4b). Here, survival is constant (K) when m < 1, and decreases linearly when m ≥ 1, namely:
Under most conditions, K = 0; however, we note that for some conditions the survival was less than 100% but still constant at levels of ATP below the critical transition. Under the minimal assumption that cell death follows first-order kinetics (for example, N = −f(m)N, where
it follows that
We set the two expressions for the survival fractions equal to one another to reveal the relationship between the antibiotic-mediated death rate (d) and the initial metabolic state, such that d = a/t (m − 1) that is, the death rate directly depends on the metabolic state of the cells at the time the antibiotic is administered. We note K = 0 here, which is consistent with our data normalization.
Simulations (Supplementary Fig. 10b) were performed using parameters fitted from the data (Supplementary Table 7). Survival was calculated using the closed form solution: N = N0et(μ–dm). When μ > 0, we use the analogous solution for the control condition (NC = N0etμ) to determine the survival fraction, defined by the log-transformation of , which is consistent with our experimental definition. In particular, we used the initial cell density (N0), the growth rates (μ) and the intracellular ATP (m) for all glucose concentrations at 37 °C as the baseline, and the antibiotic death rate (d). The highest and lowest concentrations for each glucose (for example, at CAA = 0 and CAA = 0.1) were used as end points to generate a continuous vector of growth rates and ATP that consisted of 100 linearly space points to achieve a higher resolution parameter space (Supplementary Fig. 9b, top row). Doing so did not disrupt the trends because the simplified version with only six CAA points fully captured the same dynamics (Supplementary Fig. 10b, bottom row).
Generality experiments.
Gram-positive and Gram-negative species.
Experiments with additional species were conducted on a subset of four CAA concentrations (Supplementary Fig. 11a,b). As S. aureus and A. baumannii cannot grow in strict MOPS, sub-cultures were performed with the addition of 10% LB. ATP was quantified using BacTiter-Glo.
Alternative metabolites and sub-culture conditions.
D/l-Malic acid and adenosine were used at concentrations of 0, 4, 12.6, 40, and 126.5 μg ml−1 instead of CAA (Fig. 4e, Supplementary Fig. 11c). These metabolites were chosen owing to their immediate proximity to ATP synthesis34–36, for example, malate reduces NAD+ to NADH in the final energy-producing step of the TCA cycle. For all of the experiments, cells were sub-cultured in MOPS containing 0.04% glucose, except for experiments shown in Supplementary Fig. 11d, for which 0.04% xylose was used instead. Reduced glutathione was used at a final concentration of 10 mM (Fig. 4g).
Mutant strain.
ATP was quantified using BacTiter-Glo. The ΔatpA mutant was measured using three CAA concentrations of 0%, 0.01% and 0.1% w/v. As this strain was only tested with a subset of CAA, the normalization was performed on the basis of identifying the lowest CAA concentration for which survival statistically decreased more than 2 s.d. To remain consistent, the control line was calculated on the basis of the wild-type strain using the same reduced subset of CAA concentrations.
All of the perturbation experiments were performed at 25 °C.
Reporting Summary.
Further information on research design is available in the Nature Research Reporting Summary linked to this article.
Data availability
The data that support the findings of this study are available from the corresponding author on reasonable request.
Supplementary Material
Acknowledgements
We thank D. Hung from the Broad Institute for providing the bacterial pathogens used in this study; J. K. Srimani, R. P. Smith and S. Bening for input on data interpretation and manuscript editing. This work was supported by the Defence Threat Reduction Agency (grant number HDTRA1-15-1-0051), the National Institutes of Health (grant number K99GM118907), the Banting Postdoctoral Fellowship Program (to J.M.S.; grant number 393360), the Broad Institute of MIT and Harvard, and a generous gift from A. Bekenstein and J. Bekenstein.
Footnotes
Competing interests
J.J.C. is scientific co-founder and Scientific Advisory Board chair of EnBiotix, an antibiotic drug discovery company.
Additional information
Supplementary information is available for this paper at https://doi.org/10.1038/s41564-019-0536-0.
References
- 1.Zampieri M, Zimmermann M, Claassen M & Sauer U Nontargeted metabolomics reveals the multilevel response to antibiotic perturbations. Cell Rep. 19, 1214–1228 (2017). [DOI] [PubMed] [Google Scholar]
- 2.Yang JH, Bening SC & Collins JJ Antibiotic efficacy—context matters. Curr. Opin. Microbiol 39, 73–80 (2017). [DOI] [PMC free article] [PubMed] [Google Scholar]
- 3.Lee AJ et al. Robust, linear correlations between growth rates and β-lactam–mediated lysis rates. Proc. Natl Acad. Sci. USA 115, 4069–4074 (2018). [DOI] [PMC free article] [PubMed] [Google Scholar]
- 4.Lipson DA The complex relationship between microbial growth rate and yield and its implications for ecosystem processes. Front. Microbiol 6, 615 (2015). [DOI] [PMC free article] [PubMed] [Google Scholar]
- 5.Brown MR, Collier PJ & Gilbert P Influence of growth rate on susceptibility to antimicrobial agents: modification of the cell envelope and batch and continuous culture studies. Antimicrob. Agents Chemother 34, 1623–1628 (1990). [DOI] [PMC free article] [PubMed] [Google Scholar]
- 6.Russell JB The energy spilling reactions of bacteria and other organisms. J. Mol. Microbiol. Biotechnol 13, 1–11 (2007). [DOI] [PubMed] [Google Scholar]
- 7.Greulich P, Scott M, Evans MR & Allen RJ Growth-dependent bacterial susceptibility to ribosome-targeting antibiotics. Mol. Syst. Biol 11, 796 (2015). [DOI] [PMC free article] [PubMed] [Google Scholar]
- 8.Haugan MS, Løbner-Olesen A & Frimodt-Møller N Comparative activity of ceftriaxone, ciprofloxacin, and gentamicin as a function of bacterial growth rate probed by Escherichia coli chromosome replication in the mouse peritonitis model. Antimicrob. Agents Chemother. 63, e02133–18 (2019). [DOI] [PMC free article] [PubMed] [Google Scholar]
- 9.Fisher JF & Mobashery S Endless resistance. Endless antibiotics? MedChemComm 7, 37–49 (2016). [DOI] [PMC free article] [PubMed] [Google Scholar]
- 10.Low EW & Chase HA Reducing production of excess biomass during wastewater treatment. Water Res. 33, 1119–1132 (1999). [Google Scholar]
- 11.Russell JB & Cook GM Energetics of bacterial growth: balance of anabolic and catabolic reactions. Microbiol. Rev 59, 48–62 (1995). [DOI] [PMC free article] [PubMed] [Google Scholar]
- 12.Molenaar D, van Berlo R, de Ridder D & Teusink B Shifts in growth strategies reflect tradeoffs in cellular economics. Mol. Syst. Biol 5, 323 (2009). [DOI] [PMC free article] [PubMed] [Google Scholar]
- 13.Erickson DW et al. A global resource allocation strategy governs growth transition kinetics of Escherichia coli. Nature 551, 119–123 (2017). [DOI] [PMC free article] [PubMed] [Google Scholar]
- 14.Manzoni S, Taylor P, Richter A, Porporato A & Ågren GI Environmental and stoichiometric controls on microbial carbon-use efficiency in soils. New Phytol. 196, 79–91 (2012). [DOI] [PubMed] [Google Scholar]
- 15.Lahtvee P-J et al. Multi-omics approach to study the growth efficiency and amino acid metabolism in Lactococcus lactis at various specific growth rates. Microb. Cell Fact 10, 12 (2011). [DOI] [PMC free article] [PubMed] [Google Scholar]
- 16.Basan M et al. Overflow metabolism in Escherichia coli results from efficient proteome allocation. Nature 528, 99–104 (2015). [DOI] [PMC free article] [PubMed] [Google Scholar]
- 17.Waschina S, Souza GD, Kost C & Kaleta C Metabolic network architecture and carbon source determine metabolite production costs. FEBS J. 283, 2149–2163 (2016). [DOI] [PubMed] [Google Scholar]
- 18.Akashi H & Gojobori T Metabolic efficiency and amino acid composition in the proteomes of Escherichia coli and Bacillus subtilis. Proc. Natl Acad. Sci. USA 99, 3695–3700 (2002). [DOI] [PMC free article] [PubMed] [Google Scholar]
- 19.Gschaedler A & Boudrant J Amino acid utilization during batch and continuous cultures of Escherichia coli on a semi-synthetic medium. J. Biotechnol 37, 235–251 (1994). [Google Scholar]
- 20.Orth JD et al. A comprehensive genome-scale reconstruction of Escherichia coli metabolism. Mol. Syst. Biol 7, 535 (2011). [DOI] [PMC free article] [PubMed] [Google Scholar]
- 21.Holms H Flux analysis and control of the central metabolic pathways in Escherichia coli. FEMS Microbiol. Rev 19, 85–116 (1996). [DOI] [PubMed] [Google Scholar]
- 22.Kempes CP et al. Drivers of bacterial maintenance and minimal energy requirements. Front. Microbiol 8, 31 (2017). [DOI] [PMC free article] [PubMed] [Google Scholar]
- 23.Shan Y et al. ATP-dependent persister formation in Escherichia coli. mBio 8, 02267–16 (2017). [DOI] [PMC free article] [PubMed] [Google Scholar]
- 24.Chang D-E, Smalley DJ & Conway T Gene expression profiling of Escherichia coli growth transitions: an expanded stringent response model. Mol. Microbiol 45, 289–306 (2002). [DOI] [PubMed] [Google Scholar]
- 25.Rampersad SN Multiple applications of Alamar Blue as an indicator of metabolic function and cellular health in cell viability bioassays. Sensors 12, 12347–12360 (2012). [DOI] [PMC free article] [PubMed] [Google Scholar]
- 26.Yang JH et al. A white-box machine learning approach for revealing antibiotic mechanisms of action. Cell 177, 1649–1661 (2019). [DOI] [PMC free article] [PubMed] [Google Scholar]
- 27.Lobritz MA et al. Antibiotic efficacy is linked to bacterial cellular respiration. Proc. Natl Acad. Sci. USA 112, 8173–8180 (2015). [DOI] [PMC free article] [PubMed] [Google Scholar]
- 28.Dwyer DJ et al. Antibiotics induce redox-related physiological alterations as part of their lethality. Proc. Natl Acad. Sci. USA 111, E2100–E2109 (2014). [DOI] [PMC free article] [PubMed] [Google Scholar]
- 29.Wright NE & Gilbert P Influence of specific growth rate and nutrient limitation upon the sensitivity of Escherichia coli towards chlorhexidine diacetate. J. Appl. Bacteriol 62, 309–314 (1987). [DOI] [PubMed] [Google Scholar]
- 30.Lopatkin AJ et al. Antibiotics as a selective driver for conjugation dynamics. Nat. Microbiol 1, 16044 (2016). [DOI] [PMC free article] [PubMed] [Google Scholar]
- 31.Lopatkin AJ et al. Persistence and reversal of plasmid-mediated antibiotic resistance. Nat. Commun 8, 1689 (2017). [DOI] [PMC free article] [PubMed] [Google Scholar]
- 32.Schellenberger J et al. Quantitative prediction of cellular metabolism with constraint-based models: the COBRA Toolbox v2.0. Nat. Protoc 6, 1290–1307 (2011). [DOI] [PMC free article] [PubMed] [Google Scholar]
- 33.Balaban NQ, Merrin J, Chait R, Kowalik L & Leibler S Bacterial persistence as a phenotypic switch. Science 305, 1622–1625 (2004). [DOI] [PubMed] [Google Scholar]
- 34.Theodosiou E, Frick O, Bühler B & Schmid A Metabolic network capacity of Escherichia coli for Krebs cycle-dependent proline hydroxylation. Microb. Cell Fact 14, 108 (2015). [DOI] [PMC free article] [PubMed] [Google Scholar]
- 35.Vander Heiden MG, Cantley LC & Thompson CB Understanding the Warburg effect: the metabolic requirements of cell proliferation. Science 324, 1029–1033 (2009). [DOI] [PMC free article] [PubMed] [Google Scholar]
- 36.Gottschalk G Bacterial Metabolism (Springer, 1979). [Google Scholar]
Associated Data
This section collects any data citations, data availability statements, or supplementary materials included in this article.
Supplementary Materials
Data Availability Statement
The data that support the findings of this study are available from the corresponding author on reasonable request.