Abstract
Tracheal displacement is thought to be the primary mechanism by which changes in lung volume influence upper airway patency. Caudal tracheal displacement during inspiration may help preserve the integrity of the upper airway in response to increasing negative airway pressure by stretching and stiffening pharyngeal tissues. However, tracheal displacement has not been previously quantified in obstructive sleep apnea (OSA). Accordingly, we aimed to measure tracheal displacements in awake individuals with and without OSA. The upper head and neck of 34 participants [apnea-hypopnea index (AHI) = 2–74 events/h] were imaged in the midsagittal plane using dynamic magnetic resonance imaging (MRI) during supine awake quiet breathing. MRI data were analyzed to identify peak tracheal displacement and its timing relative to inspiration. Epiglottic pressure was measured separately for a subset of participants (n = 30) during similar experimental conditions. Nadir epiglottic pressure and its timing relative to inspiration were quantified. Peak tracheal displacement ranged from 1.0–9.6 mm, with a median (25th–75th percentile) of 2.3 (1.7–3.5) mm, and occurred at 89 (78–99)% of inspiratory time. Peak tracheal displacement increased with increasing OSA severity (AHI) (R2 = 0.28, P = 0.013) and increasing negative nadir epiglottic pressure (R2 = 0.47, P = 0.023). Relative inspiratory timing of peak tracheal displacement also correlated with OSA severity, with peak displacement occurring earlier in inspiration with increasing AHI (R2 = 0.36, P = 0.002). Tracheal displacements during quiet breathing are larger in individuals with more severe OSA and tend to reach peak displacement earlier in the inspiratory cycle. Increased tracheal displacement may contribute to maintenance of upper airway patency during wakefulness in OSA, particularly in those with severe disease.
NEW & NOTEWORTHY Tracheal displacement is thought to play an important role in stabilizing the upper airway by stretching/stiffening the pharyngeal musculature. Using dynamic magnetic resonance imaging, this study shows that caudal tracheal displacement is more pronounced during inspiration in obstructive sleep apnea (OSA) compared with healthy individuals. Softer pharyngeal muscles and greater inspiratory forces in OSA may underpin greater tracheal excursion. These findings suggest that tracheal displacement may contribute to maintenance of pharyngeal patency during wakefulness in OSA.
Keywords: lung volume, magnetic resonance imaging (MRI), pharyngeal pressure, sleep-disordered breathing, tracheal traction
INTRODUCTION
Patency of the upper airway is dependent on the balance between collapsing and dilating forces (34). Increased negative pharyngeal pressures during inspiration that act to collapse the pharyngeal airway are counteracted by activation of the dilator muscles. At the same time, increases in lung volume and negative intrathoracic pressure pull on the trachea to displace it caudally toward the thorax (26, 46). In a landmark study using anaesthetized canines, Van de Graaff (46) elegantly demonstrated that inspiratory-related tracheal displacement decreased upper airway resistance, independent of dilator muscle activity. This finding highlighted that maintenance of upper airway patency during inspiration was not only a function of muscle activity, but that tracheal displacement also plays an important role. Subsequent animal studies that directly applied static displacements to the trachea (isolated from the lungs) supported Van de Graaff’s initial findings, showing that tracheal displacement/traction decreases collapsibility (3, 4, 25, 35), compliance (45), and pharyngeal tissue pressures (4, 25) while increasing upper airway patency (4, 35, 44, 48) and predicted soft tissue stiffness (1).
In humans, static tracheal displacements result from changes in functional residual capacity (FRC) because of alterations in posture (6, 31), sleep-wake state (21, 39), central obesity (40), and pregnancy (16). Manipulation of the lung’s FRC has been performed using a rigid head-out body box and external pressure source to expand/compress the thorax (5, 18, 19, 24, 33, 38, 41, 43). An increase in FRC (i.e., causing caudal tracheal displacement) of approximately one tidal volume (500–700 mL) decreased pharyngeal airway resistance (5) and collapsibility (38) during sleep in healthy subjects. This change similarly decreased apneic episodes (19) and upper airway collapsibility (18, 24, 33) during sleep in people with sleep-disordered breathing and in paralyzed, anaesthetized participants (43). Furthermore, decreasing FRC (i.e., causing craniad tracheal displacement) increases pharyngeal collapsibility during sleep in healthy people (41), those with obstructive sleep apnea (OSA) (18), and in paralyzed, anesthetized subjects with sleep-disordered breathing (43).
Tracheal displacement influences the upper airway by transmission of its load via the thyroid cartilage and its attachments to the hyoid bone (1, 4, 46, 48). These are also sites of attachment for the majority of upper airway dilator muscles. However, although static tracheal displacement (change in FRC) has been established as an important mediator of upper airway function, the role of respiratory-related tracheal displacement in OSA pathogenesis remains unclear. In awake supine subjects with lung cancer (49), the carina (ridge of cartilage at trachea base before separation into left/right main bronchi) moves caudally by ~5.3 mm during quiet breathing. This is associated with an increase in lung volume of ~429 mL [calculated from individual values taken from Table 2 in van der Weide et al. (49)]. However, direct measurement of tracheal displacement was not made, and it is not known how these displacements differ between healthy individuals versus those with OSA. Furthermore, lung volume and carinal movement during breathing do not contribute to tracheal displacement in isolation. Indeed, there may be a contribution from intrathoracic and extrathoracic pressure differences, as shown in studies with anaesthetized dogs (48). The relationship between intrathoracic pressure and tracheal displacement is not known in humans.
Dynamic ‘tagged’ magnetic resonance imaging (MRI) has recently been used to measure movement of upper airway tissues during awake quiet breathing (7, 10, 12, 13). These studies show that people with severe OSA have little or no dilatory movement of upper airway tissues during inspiration (7, 12). Although inspiratory-related muscle activity has been suggested to stiffen pharyngeal tissues (without dilation) to prevent the airway from closing during wakefulness (4, 28), OSA patients have less stiff tongues than body mass index (BMI)-matched controls during wakefulness (8). Thus, it is likely that other factors are involved, and tracheal displacement may help keep the airway patent during wakefulness in OSA. The smaller cross-sectional area of the upper airway in OSA subjects compared with healthy controls would cause higher airway resistance, and thus generate greater pharyngeal/intrathoracic pressures. However, this has been minimally investigated.
The primary aim of the current study was to use dynamic imaging techniques to quantify tracheal displacement during awake quiet breathing in people with and without OSA (over a range of severities). We hypothesized that peak tracheal displacement during quiet breathing in OSA subjects is greater than in healthy controls. A secondary aim was to quantify pharyngeal pressures at the level of the epiglottis and determine the relationship between peak tracheal displacement and nadir epiglottic pressure for mechanistic insight.
METHODS
Participants
Data for the current study were acquired as part of a larger ongoing study examining tongue motion using MRI and overnight upper airway/muscle physiology during sleep. Subjects were recruited through the Sleep Clinics at the Prince of Wales Hospital or the community. Exclusion criteria included respiratory illness other than OSA, treated OSA, pregnancy, neurological or psychological illness, medications that may alter respiratory muscle function via central action or at the neuromuscular junction (antidepressants, antipsychotics, sedatives, myorelaxants, recreational drugs), and contraindications for MRI (e.g., metal implants). All participants gave informed written consent to take part in the study. The study was approved by the Human Research Ethics Committee of the South Eastern Sydney Local Health District and conducted according to the Declaration of Helsinki.
Study Design and Measurements
Participants initially underwent a standard overnight diagnostic sleep study at the Prince of Wales Hospital or Sleep Laboratory at Neuroscience Research Australia (NeuRA) to quantify apnea-hypopnea index (AHI). If participants had undergone a sleep study within the last 3 yr, this part of the protocol was not repeated and the AHI from the earlier study was used for the current analyses. Participants then underwent a separate upper airway physiology study at the NeuRA Sleep Laboratory for measurement of epiglottic pressure during wakefulness. As part of the larger ongoing study, genioglossus muscle activity was also recorded (data not presented) using fine-wire electrodes inserted submentally into the genioglossus. Approximately 2 wk after the physiology study, participants underwent an MRI scan at the NeuRA Diagnostic MRI Services Facility for measurement of tracheal displacement.
Imaging.
Imaging data were acquired during quiet nasal breathing using a 3-Tesla MRI scanner (Philips Achieva TX, Best, The Netherlands) and 16 channel head-neck coil. Participants lay supine with their head/neck position controlled such that the Frankfort plane was perpendicular to the scanner bench. Imaging was conducted using a tagged MRI sequence, as described previously (7, 13).
Images were acquired in the midsagittal plane every 250 ms for 30 s (120 frames in total), and the sequence was repeated four times. Respiration was recorded using an MRI-compatible abdominal band, which allowed for accurate respiratory cycle timing of images. The imaging parameters were flip angle = 7 degrees, repetition time = 2.2 ms, echo time = 0.9 ms, image resolution = 256 × 256 pixels, pixel size = 0.859 × 0.859 mm, and slice thickness = 10 mm.
Respiratory pressure and flow measurement.
Epiglottic pressure was measured using a pressure transducer-tipped catheter (Millar MCP-500; Millar Instruments, Houston, TX) inserted through either the left or right nostril to a level directly above the epiglottis (~1–2 cm below the base of the tongue). Airflow was measured using a pneumotachograph (Series 3700A, Hans Rudolf, Kansas City, MO) with pressure transducers (Validyne DP-45, Validyne, Northbridge, CA), which was attached to a nasal continuous positive airway pressure mask (ComfortGel, Phillips Respironics, Murrysville, PA) fitted to each subject. Pressure at the mask was also measured (Validyne DP-45). Similar to the MRI protocol, epiglottic pressure and airflow were acquired during awake quiet nasal breathing in the supine position over approximately a 3–5 min period. The signals were sampled at 250 Hz using a CED 1401 data acquisition system (Cambridge Electronic Design, Cambridge, England).
Data Analysis
Image analysis: peak tracheal displacement and respiratory timing.
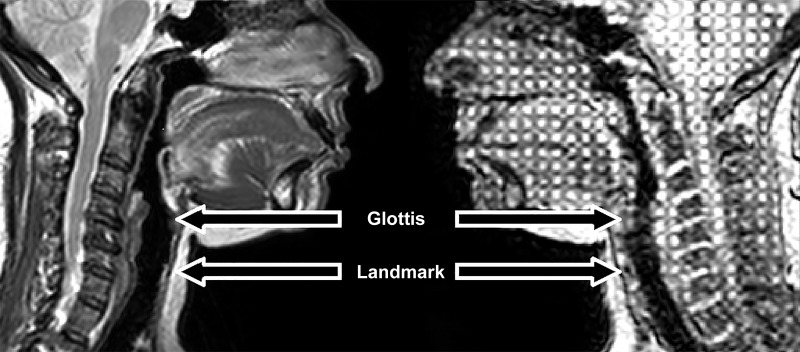
The tagged imaging sequence, in conjunction with the Harmonic Phase analysis method (32), has been used for quantification of tongue tissue motion as part of the larger ongoing study. However, technical limitations associated with image quality prevented the use of this method to track the movement of the trachea in this study (see discussion: Critique of Methods). Thus, tracking was manually performed (described below). Images were analyzed using ImageJ (Version 1.50b, Bethesda, MD) with the MtrackJ plugin (Version 1.5.1, Rotterdam, The Netherlands). For analysis, we identified a tracheal cartilage ring as a landmark to track tracheal movement, located ~2 cm below the glottis (see Fig. 1). This landmark was selected as it could be consistently identified between subjects and remained visible throughout the respiratory cycle. Participants without this landmark visible in images were excluded from primary analysis (n = 4; these subjects had an alternate identifiable cartilage landmark just rostral to this point and were included in a secondary analysis to validate current observations; see appendix A).
Fig. 1.
Image demonstrating comparison between anatomical (left) and tagged (right) MRI scans. Glottis and the selected landmark (small black circle) are indicated by arrows.
A total of six breaths were selected from abdominal recordings for analysis. Breaths were excluded if they immediately preceded or followed swallows or other voluntary movements made by the participant or if the participant breathed irregularly (alternating between deep/shallow and/or slow/rapid breaths). For most participants, the selected breaths comprised three sets of two consecutive respiratory cycles to record continuous tracheal movement over two cycles; otherwise, individual breaths were selected when regular consecutive breaths were not available (n = 5 included 2 nonconsecutive breaths). Five participants had four breaths available for analysis.
The tracheal cartilage landmark was manually tracked frame by frame for the duration of the chosen breath, and the resulting data were stored as (x, y) coordinates. The magnitude vector displacement was calculated as √(x2+y2), with the caudal (y) direction considered positive, and used in subsequent analyses. Peak caudal tracheal displacement was quantified as the difference between the most craniad position during inspiration and most caudal position during the entire breath cycle. Respiratory timing parameters were measured from the respiratory band signal, including inspiratory time and total breath duration. The absolute time to peak tracheal displacement (from start of breath) and relative to inspiratory time (%) was quantified. This analysis was performed in a subset of participants, given that a clear ‘peak’ could not be reliably identified in those with relatively small tracheal movements. Accordingly, a peak tracheal displacement threshold of 1.92 mm was defined to be included in timing analyses (n = 22). The threshold value was based on the outcome of a repeatability analysis for tracheal displacement measurement; specifically, the 95% confidence interval of the tracheal vector displacement repeatability limits of agreement (see appendix B).
Physiology analysis: nadir epiglottic pressure, respiratory timing, and upper airway resistance.
For each breath over the recording period, nadir epiglottic pressure and respiratory timing parameters were measured (2, 15). Additionally, upper airway resistance was quantified as the difference between epiglottic and mask pressure at a flow rate of 0.2 L/s (23, 36). The absolute time to nadir epiglottic pressure from start of breath and relative to inspiratory time (%) was also calculated (2). Similar to MRI, irregular breaths and swallows (along with their adjacent breaths) were excluded from analysis.
Statistical analysis.
Statistical analyses were performed using SPSS (Version 23, IBM, Armonk, NY). Data for each participant were averaged over all analyzed breaths and used in group analyses. Linear regression was used to quantify relationships between peak tracheal displacement, AHI, nadir epiglottic pressure, inspiratory and total breath duration, timing of peak tracheal displacement and nadir epiglottic pressure, upper airway resistance, and anthropometric data (age, height, weight, BMI). Inspiratory and total breath duration parameters from the MRI study were used for all analyses, where applicable, except for relationships with nadir epiglottic pressure where data from the physiology analysis was used. Because of heteroscedasticity, bootstrapping methods (5,000 samples) were performed on the data before regression, and confidence intervals were calculated using the Bias Corrected and Accelerated function for nonnormal data. Adjusted R2 values were used to determine goodness of model fit. Group data are reported as mean ± SD or median (25th–75th percentile). Statistical significance was inferred at P < 0.05.
RESULTS
Participants
Data from a total of 52 participants were available for the primary imaging analyses. Data from 18 participants were excluded due to poor image quality, inadequate field of view (trachea not visible), or technical limitations to analysis (see methods: Image analysis). Of the 34 (6 female) participants in whom data were available, 7 were healthy controls (AHI ≤ 10 events/h; 2 female) and 27 had OSA (4 female) of varying severities (AHI = 10.9–74 events/h). For measurement of pharyngeal pressure swings in the physiology study, 2 of 34 subjects were unable to undertake the protocol and 2 did not produce sufficient data to meet analysis inclusion criteria (see below). Thus, 30 subjects were available for physiology analysis and comparison with MRI data.
Table 1 summarizes the anthropometric and sleep characteristics of the study participants.
Table 1.
Anthropometric and sleep parameters for participants
| All Participants | OSA | Control | |
|---|---|---|---|
| n | 34 | 27 | 7 |
| Sex, M/F | 28/6 | 23/4 | 5/2 |
| Age, yr | 47.6 ± 12.8 | 47.0 ± 13.0 | 49.9 ± 12.5 |
| Height, m | 1.7 ± 0.1 | 1.7 ± 0.1 | 1.7 ± 0.1 |
| Weight, kg | 82.3 ± 12.5 | 84.3 ± 12.3 | 72.8 ± 9.1 |
| BMI, kg/m2 | 26.6 (24.6–29.2) | 26.8 (25.0–29.5) | 26.0 (23.8–27.9) |
| Median AHI, events/h sleep | 22 (12–40) | 25 (17–42) | 4 (3–10) |
| Range AHI, events/h sleep | 2–74 | 11–74 | 2–10 |
Data are means ± SD or median (25th–75th percentile), where applicable. AHI, apnea-hypopnea index; BMI, body mass index; F, female; M, male; OSA, obstructive sleep apnea.
Tracheal Displacement and Respiratory Timings
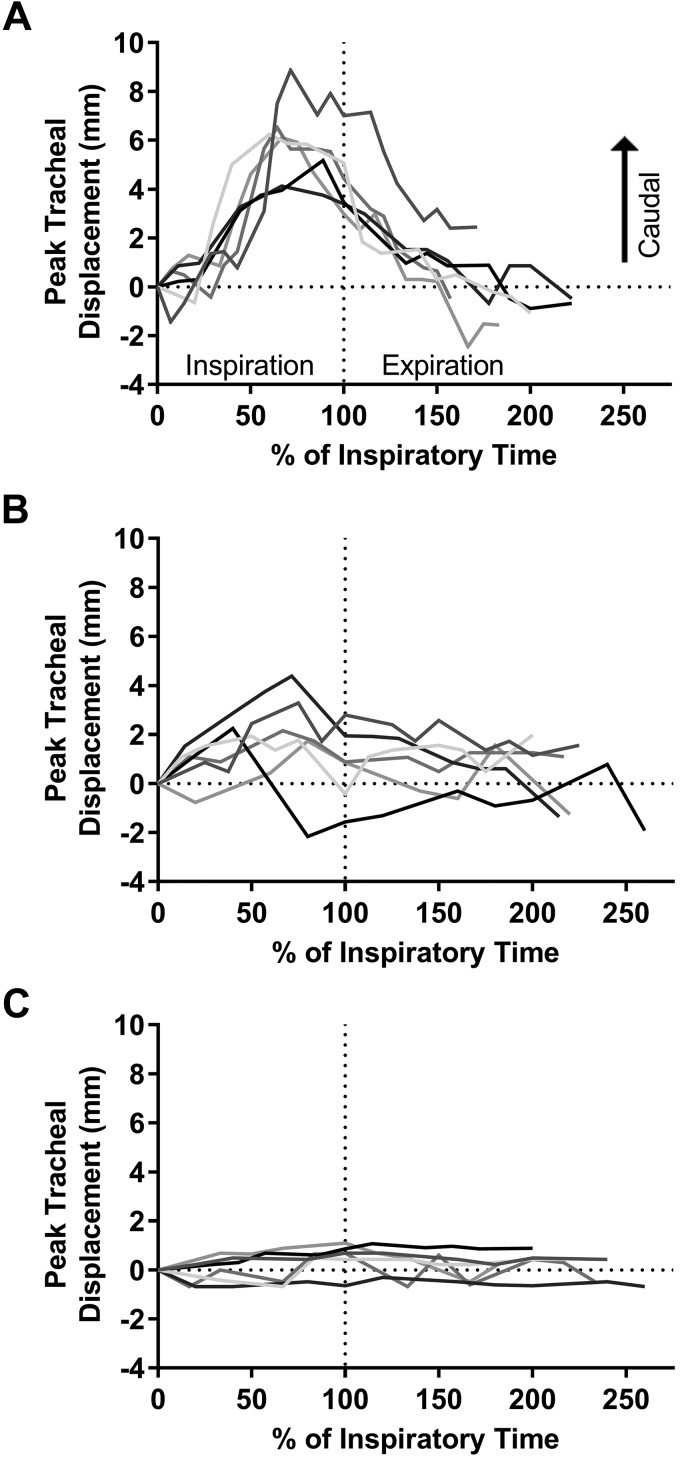
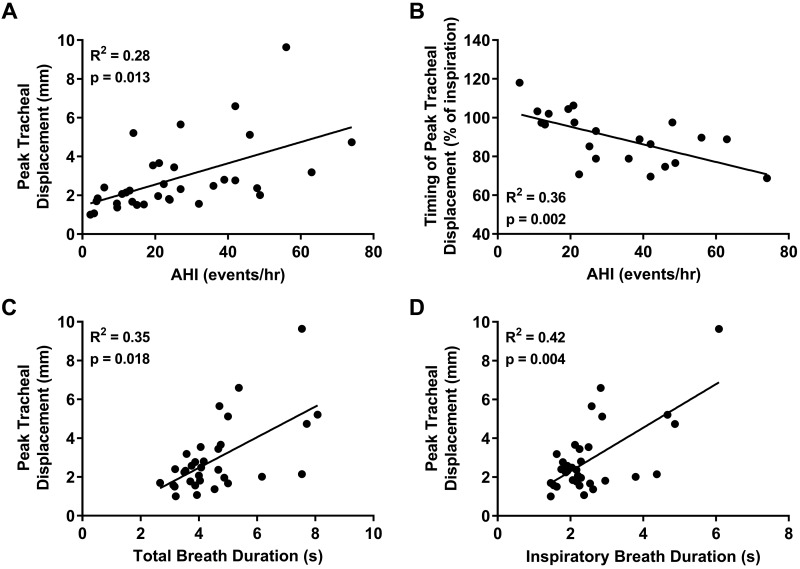
Figure 2 shows representative examples of tracheal displacements throughout the respiratory cycle for individual breaths from 3 participants. Tracheal displacements were quite consistent between analyzed breaths for each participant but varied between individuals (Fig. 2). The average peak tracheal displacement ranged from 1.0–9.6 mm, and the group median was 2.3 (1.7–3.5) mm. Greater peak tracheal displacement correlated with increasing AHI (Fig. 3A). There was no relationship between peak tracheal displacement and anthropometric parameters (age, height, weight, or BMI) (P > 0.089).
Fig. 2.
Representative examples of tracheal displacement over the respiratory cycle for participants with relatively large (A), medium (B), and small (C) displacements. Six breaths are overlaid (different gray lines) and plotted relative to inspiratory time (tracheal displacement = 0 at beginning of inspiration).
Fig. 3.
Individual participant data (closed circles; n = 34, 6 female) and linear regression model (solid line) showing the relationship between peak tracheal displacement and apnea-hypopnea index (AHI) (A) and total (C) and inspiratory (D) breath durations. The relationship between the timing of peak tracheal displacement (expressed as % of inspiratory breath duration) and AHI is also presented (B). Greater peak tracheal displacement and its earlier occurrence in inspiration were associated with increased obstructive sleep apnea severity (A and B). Peak tracheal displacement was also positively correlated with total breath and inspiratory duration (C and D).
Peak tracheal displacement occurred at 89.3 (78.3–98.7)% of inspiratory time (n = 22). The relative inspiratory timing of peak tracheal displacement correlated with AHI, such that participants with higher AHI reached peak tracheal displacement earlier during inspiration (Fig. 3B). Total breath duration positively correlated with AHI (R2 = 0.15, P = 0.048), whereas inspiratory duration (P = 0.29) and absolute time to peak tracheal displacement (P = 0.771) were not associated with AHI.
Peak tracheal displacement correlated with total and inspiratory breath duration (Fig. 3, C and D) but not with its position relative to inspiration (P = 0.078).
Nadir Epiglottic Pressure and Respiratory Timings
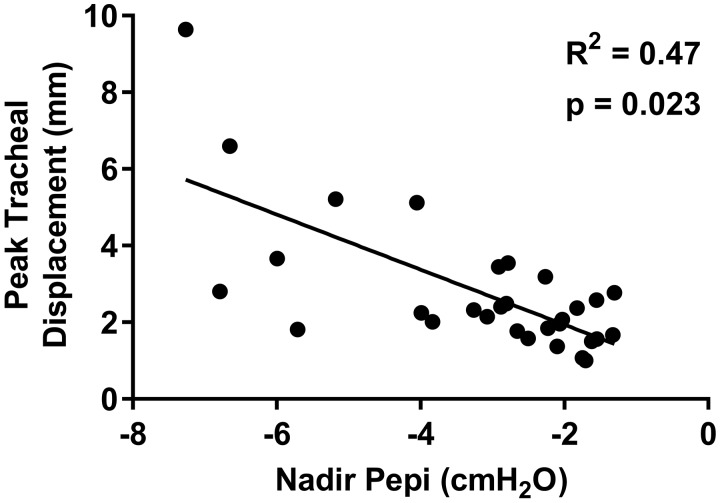
Similar to peak tracheal displacement, there was large interindividual variability in nadir epiglottic pressure values [range: −1.3 to −7.3 cm H2O; mean: −3.2 ± 1.8 cm H2O]. Nadir epiglottic pressure did not correlate with AHI (P = 0.108). However, there was a positive association between increasing negative nadir epiglottic pressure and peak tracheal displacement (Fig. 4). Nadir epiglottic pressure was not associated with age, height, weight, or BMI (P > 0.076).
Fig. 4.
Individual participant data (closed circles; n = 30, 6 female) and linear regression model (solid line) showing the relationship between peak tracheal displacement and nadir epiglottic pressure (Pepi). Increased negative nadir Pepi was associated with greater peak tracheal displacement.
Nadir epiglottic pressure occurred 48.4 ± 9.8% into inspiration. The relative inspiratory timing of nadir epiglottic pressure was not correlated with AHI (P = 0.59) or the relative inspiratory timing of peak tracheal displacement (P = 0.46). Total breath and inspiratory durations also did not correlate with AHI (P > 0.26).
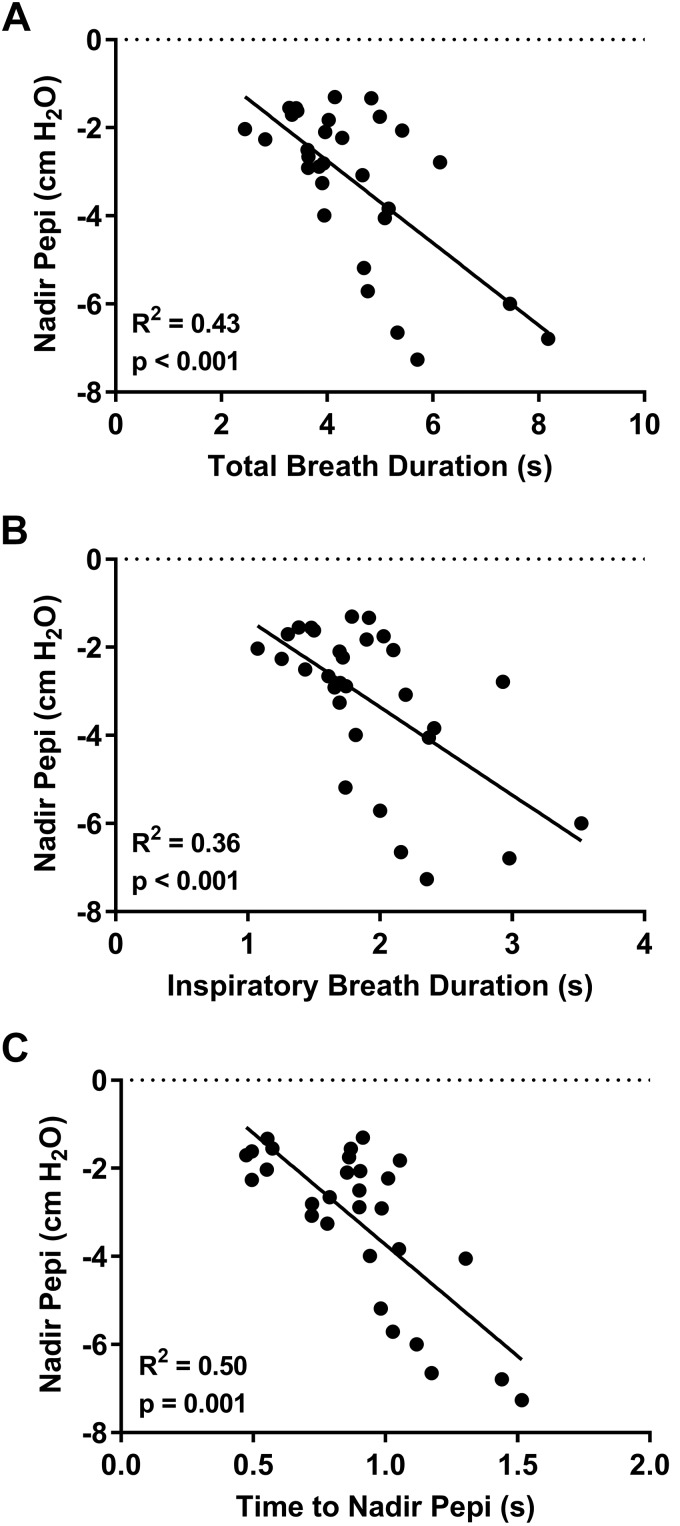
Nadir epiglottic pressure correlated with the total breath and inspiratory durations and the absolute time to nadir epiglottic pressure (Fig. 5, A–C) but not with the relative inspiratory timing of nadir epiglottic pressure (P = 0.23).
Fig. 5.
Individual participant data (closed circles; n = 30, 6 female) and linear regression model (solid line) demonstrating the relationship between nadir epiglottic pressure (Pepi) and total breath duration (A), inspiratory duration (B), and the time to nadir Pepi (from start of the respiratory cycle) (C). Greater negative nadir Pepi was positively correlated with the duration of the respiratory cycle (A) and inspiratory phase (B). Similarly, greater negative nadir Pepi was associated with the relative length of time it took to reach it.
Upper Airway Resistance
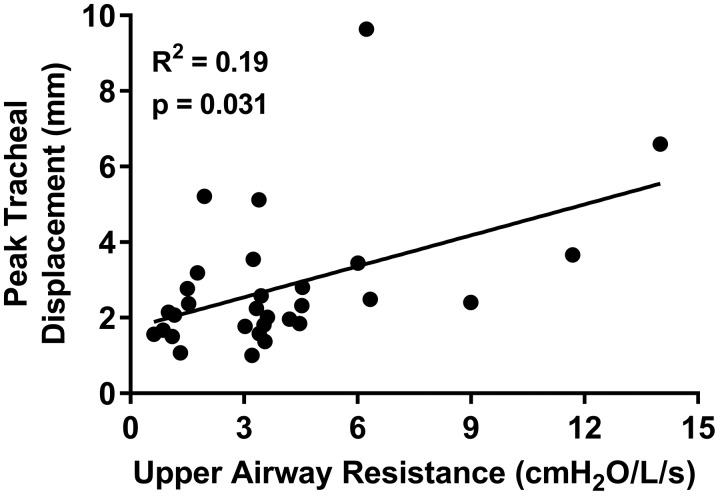
Upper airway resistance [range: 0.6–14 cm H2O per L/s; median: 3.4 (1.7–4.5) cm H2O per L/s] was positively associated with peak tracheal displacement (Fig. 6). Upper airway resistance was also positively associated with absolute time to nadir epiglottic pressure (R2 = 0.17, P = 0.015) and total breath duration (R2 = 0.14, P = 0.042). However, resistance was not associated with the absolute time to peak tracheal displacement (P = 0.57) or the relative inspiratory timing of both peak tracheal displacement and nadir epiglottic pressure (both P = 0.61), inspiratory duration (P = 0.061), AHI (P = 0.54), or any measured anthropometric parameter (P > 0.24).
Fig. 6.
Individual participant data (closed circles; n = 30, 6 female) and linear regression model (solid line) showing the relationship between upper airway resistance and peak tracheal displacement. Increased upper airway resistance was associated with greater peak tracheal displacement.
DISCUSSION
This is the first study to quantify the dynamic movement of the trachea during awake quiet breathing in humans with varying severities of OSA. Caudal displacement of the trachea during inspiration was greater and occurred earlier in inspiration in those with higher OSA severity. Furthermore, greater upper airway resistance and nadir epiglottic pressure were associated with more pronounced peak tracheal displacement but not with OSA severity.
Tracheal Displacement and OSA: a Simple Model
Previous studies in humans have demonstrated that an increase in static caudal displacement of the trachea (produced by extrathoracic pressure changes) improves airway patency and decreases collapsibility (5, 18, 19, 24, 33, 38, 41, 43). In this study, we found that greater dynamic tracheal displacement during breathing was associated with more severe OSA. To explain this, we propose a simple model that takes into account the interplay between intrathoracic pressure, lung volume, upper airway stiffness, and tracheal displacement.
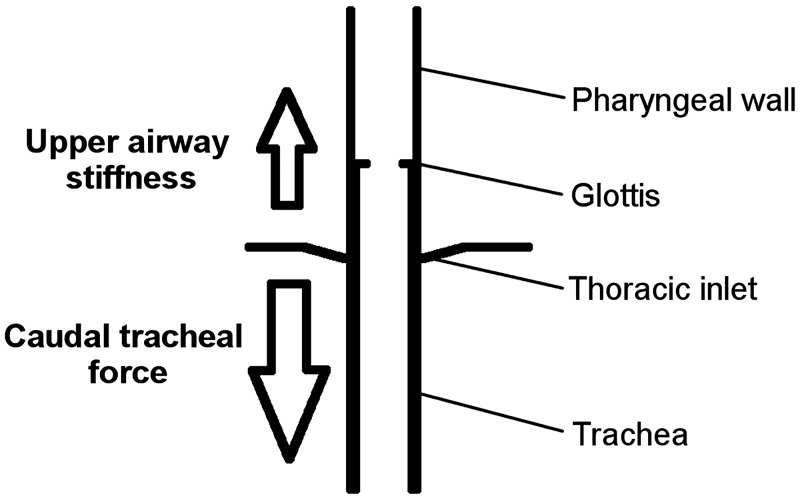
The trachea is attached caudally to the lungs and mediastinal structures, with craniad attachments to the upper airway through muscles and ligaments connected to the larynx (thyroid cartilage) and hyoid bone. The hyoid is a mobile bone that serves as a central attachment site for many pharyngeal muscles. With caudal tracheal displacement, the hyoid bone is also displaced caudally, which allows tracheal movements to affect parts of the upper airway that are not directly connected to the trachea/larynx (e.g., suprahyoid and genioglossus muscles) (1, 4, 27). The magnitude of tracheal displacement is thus dependent on the balance between two factors: 1) the amount of caudal force applied to the trachea and 2) how easily the upper airway tissues can be longitudinally stretched, i.e., their stiffness (Fig. 7).
Fig. 7.
Schematic conceptually demonstrating the balance of forces that contribute to the level of tracheal displacement. Caudal forces acting on the trachea are in opposition to the upper airway soft tissue’s resistance to stretch. There, the amount of caudal tracheal displacement depends on the magnitude of caudal force (down arrow) and the innate stiffness of the upper airway tissues (up arrow).
Factor no. 1: caudal force and tracheal displacement.
The amount of caudal force applied to the trachea is closely associated with the magnitude of negative intrathoracic pressure during inspiration. This is supported by Van de Graaf’s (48) animal studies, which revealed that increases in negative intrathoracic pressure result in increased tracheal traction, independent of lung volume changes. Indeed, nadir epiglottic pressure, dependent on both upper airway resistance and the intrathoracic pressure load (discussed further below), was strongly associated with peak tracheal displacement in the current study. Accordingly, we suggest that in people with OSA there is greater caudal tracheal force during inspiration due to more negative intrathoracic pressures compared with healthy individuals [consistent with the epiglottic pressures measured here; shown previously to be significantly different between healthy individuals and those with OSA (17)].
Factor no. 2: soft tissue stiffness and tracheal displacement.
There is a substantial body of literature to support the proposition that OSA patients have more extensible upper airway tissues than healthy controls, ranging from increased pharyngeal compliance (9) to a lower pharyngeal muscle stiffness as measured with magnetic resonance elastography (8). Static lung volume (FRC) is also less in obese OSA compared with obese healthy individuals (20); reducing upper airway patency and increasing collapsibility. This reduced static caudal force, or caudal preload on upper airway tissues, would reduce pharyngeal soft tissue stiffness and contribute to the increased extensibility of upper airway soft tissues in OSA. Together, these factors could account for the observed greater dynamic tracheal displacement during inspiration in OSA. It is possible that active muscular contraction of the pharyngeal muscles during breathing, although small (11), may also influence upper airway tissue stiffness, but this has not been considered in our model.
We speculate that the greater dynamic caudal tracheal displacement in OSA, while a consequence of the several factors discussed above, contributes to keeping the upper airway open during wakefulness. Given that the airway of OSA patients is narrower and more collapsible, the concept that increased caudal tracheal displacement assists to counteract negative inspiratory collapsing forces is physiologically plausible. Indeed, dynamic caudal tracheal displacement during breathing decreases upper airway resistance in animals, independent of influencing factors such as upper airway dilator muscle activity (46). Accordingly, one would predict that limited caudal displacement of the trachea during inspiration [e.g., due to excessive neck soft tissue limiting descent of the larynx/hyoid bone or reduced tidal volume as a result of decreased lung compliance, i.e., interstitial lung disease (14, 29)] to help stiffen tissues/enlarge the pharynx would increase the upper airway’s susceptibility to collapse. Additional studies that provide more direct evidence are required to clarify this concept.
Respiratory Timing of Peak Tracheal Displacement
Another major finding of the current study was a strong correlation between AHI and the timing of peak tracheal displacement, whereby healthier participants tended to reach peak displacement close to the end of inspiration (as determined by the abdominal band) and participants with more severe OSA reached peak displacement earlier in the cycle. We suggest that this is primarily related to the timing of intrathoracic pressure swings, which, as established above, is a dominant force acting on the trachea (48).
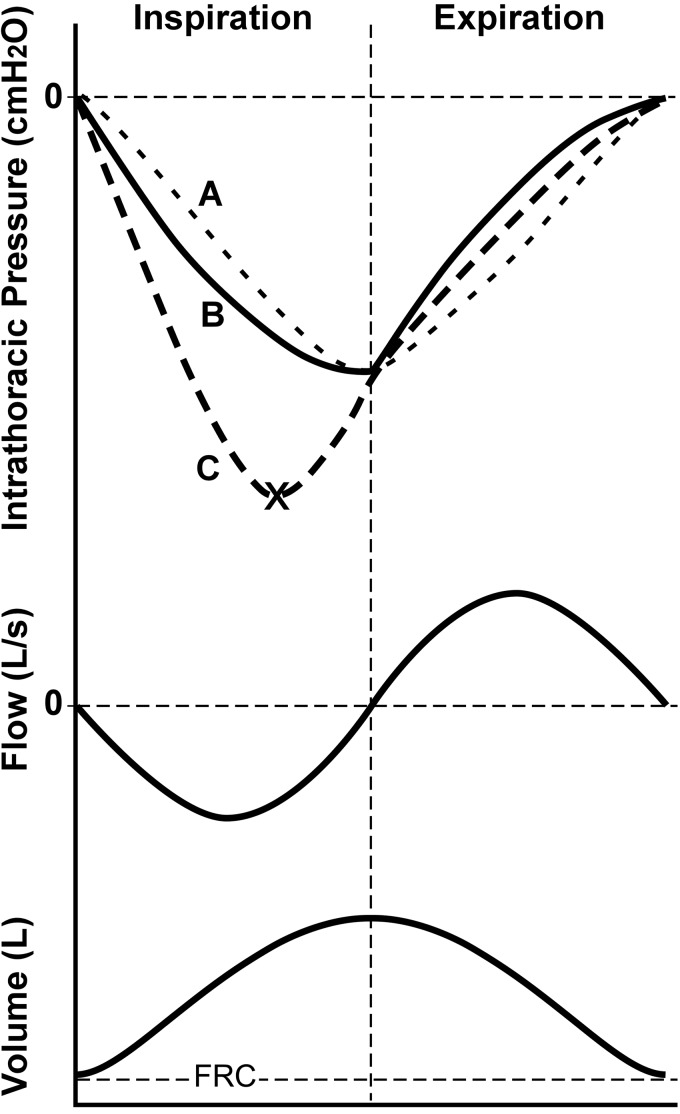
Our proposal is based on general respiratory physiology principles, which are graphically depicted in Fig. 8. Intrathoracic pressure is a function of both upper and lower airway resistance ( flow) and compliance of the chest wall/lungs ( volume). If upper airway resistance was minimal, intrathoracic pressure would follow the sinusoidal curve of Fig. 8A with a nadir at end inspiration associated primarily with volume-related elastic recoil pressure. The introduction of low (healthy) levels of upper airway resistance causes a slight shift of the ideal curve (50). With relatively low resistance levels, volume remains the dominant influencing component of intrathoracic pressure, which reaches nadir at or close to end inspiration (Fig. 8B). With a large increase in upper airway resistance, as with OSA, the magnitude of intrathoracic pressure becomes highly dependent on the flow resistive component, such that it will reach nadir closer to the time of peak inspiratory flow (Fig. 8C). The applicability of this concept to the current outcomes is supported by a previous study that demonstrated a steeper gradient of descent of the esophageal pressure curve and increased peak negative esophageal pressure during flow-limited inspiratory snoring, compared with regular breathing periods (42). Indeed, reduced upper airway tissue stiffness may also contribute to tracheal displacement peaking earlier during inspiration, whereby there would be an initial relatively fast stretching of compliant soft tissues followed by plateau as they become stiffer.
Fig. 8.
Theoretical intrathoracic pressure curves during the respiratory cycle under conditions of no airways resistance (curve A), normal (healthy) levels of upper airway resistance (curve B), and high levels of upper airway resistance (curve C). Ideal airflow and volume traces also shown for reference. Intrathoracic pressure is function of resistance of the upper and lower airways to airflow, as well as air volume that is associated with chest wall/lung compliance. Without airway resistance, intrathoracic pressure reflects changes in volume (dependent on chest wall/lung compliance; sinusoidal curve A), and peak tracheal displacement will occur at end of inspiration. With the addition of healthy levels of upper airway resistance, intrathoracic pressure begins to have a relatively minor dependence on airflow and resembles curve B. With a large increase in upper airway resistance, as may occur in obstructive sleep apnea (OSA), intrathoracic pressure is now largely influenced by the airflow resistive component (curve C), such that it reaches a nadir earlier, at close to maximal inspiratory airflow (× mark on curve C). Given that intrathoracic pressure is a primary load displacing the trachea, this may explain why peak tracheal displacement is reached earlier during inspiration in OSA. FRC, functional residual capacity.
Note that while epiglottic pressure measurements in this study are influenced by intrathoracic pressure, they are not a complete reflection of it. Indeed, epiglottic pressure is also influenced by resistance of the upper airway and does not directly incorporate the ‘downstream’ factors that affect intrathoracic pressure, such as chest wall/lung compliance (22). Hence, as expected, respiratory timing of nadir epiglottic pressure and peak tracheal displacement did not match in this study (nadir epiglottic pressure occurring at ~50% of inspiration, and peak tracheal displacement at ~90%).
Critique of Methods
The study sample may not represent all OSA patients because the weight and BMI range of participants was lower than typical clinical populations, which may limit generalization to the whole OSA population.
Nasal resistance, a factor contributing to the magnitude of downstream epiglottic pressure swings (37), was not measured in this study. High nasal resistance, or nasal obstruction, can occur in both heathy controls and people with OSA (30). Accordingly, nasal resistance may have contributed to variation in epiglottic pressure swings in this cohort and the lack of correlation between nadir epiglottic pressure and AHI, although this is speculation.
MRI and physiological data (including airflow and epiglottic pressure) were not collected concurrently because 3T MRI-compatible equipment for such measurements was unavailable. Furthermore, this study was performed in awake participants. It is known that the neurophysiological behavior of the upper airway differs between wake and sleep states (11). Nonetheless, as with previous awake imaging studies (7, 10, 13), insights into the differences in upper airway function between healthy and OSA individuals are gained, which can aid in understanding airway behavior during sleep. Indeed, apart from technical challenges associated with quantifying sleep in MRI, the noise associated with these MRI scans makes capturing the sleep state impractical.
The MRI data used in this study were not originally obtained for the examination of tracheal displacement (as described in methods), which posed limitations associated with image quality in analysis. Specifically, the tagged MRI protocol gave rise to chemical shift artifacts in the region of interest, such that automated harmonic phase method analysis to track tracheal movement was not possible (7) and manual tracking was performed instead. To ensure our manual method of landmark tracking was reproducible, we performed a repeatability analysis (appendix B), which demonstrated high reproducibility (Cronbach’s α > 0.95).
Because of image quality, the selected tracked tracheal cartilage landmark varied between participants (see methods). That is, although we located tracheal cartilages in the same region for all participants, it is possible that different parts of the trachea move different amounts due to factors such as intrinsic stretch, and this may be a source of between-individual variation. Nonetheless, a secondary analysis of an alternate landmark demonstrated a similar relationship between AHI and peak tracheal displacement (appendix A).
Summary and Conclusions
This study has shown that dynamic caudal displacement of the trachea during awake quiet breathing increases with OSA severity. We proposed a simple conceptual model to explain this finding, whereby caudal tracheal displacement is dependent on both the applied caudal load (intrathoracic pressure) and stiffness of upper airway tissues. Indeed, increased upper airway resistance and nadir epiglottic pressure (reflective of the caudal load) are associated with greater tracheal displacement. Additionally, peak tracheal displacement occurs earlier in inspiration with increasing OSA severity, which we speculate is due to the greater caudal force on the trachea in OSA (i.e., increased upper airway resistance requires more negative intrathoracic pressures and longer inspiratory time to maintain ventilation; noting, however, that both were not significantly associated with OSA severity in this study). The current study suggests that tracheal displacement may be an important contributor to the maintenance of upper airway patency during wakefulness in people with OSA. Additionally, the quantification of tracheal displacement during breathing may serve as a useful, noninvasive wakefulness tool to help predict OSA.
GRANTS
This work was supported by a National Health and Medical Research Council (NHMRC) Project Grant (No. 1058974). L. E. Bilston and D. J. Eckert are supported by NHMRC Senior Research Fellowships (Nos. 1077934 and 1116942, respectively). J. Amatoury was supported by a NeuroSleep NHMRC CRE Postdoctoral Fellowship (No. 1060992).
DISCLOSURES
No conflicts of interest, financial or otherwise, are declared by the authors.
AUTHOR CONTRIBUTIONS
D.J.E., L.E.B., and J.A. conceived and designed research; L.J., P.G.B., and F.K. performed experiments; J.T., L.J., P.G.B., F.K., L.E.B., and J.A. analyzed data; J.T., L.J., P.G.B., F.K., D.J.E., L.E.B., and J.A. interpreted results of experiments; J.T. and J.A. prepared figures; J.T., L.E.B., and J.A. drafted manuscript; J.T., L.J., P.G.B., F.K., D.J.E., L.E.B., and J.A. edited and revised manuscript; J.T., L.J., P.G.B., F.K., D.J.E., L.E.B., and J.A. approved final version of manuscript.
ACKNOWLEDGMENTS
The authors thank the staff of the NeuRA MR Imaging Centre for their assistance with the MRI scanning protocols, Ms. Barbara Toson for advice with statistical analysis of the data, and Dr. Jane Butler for her support with the project
APPENDIX A
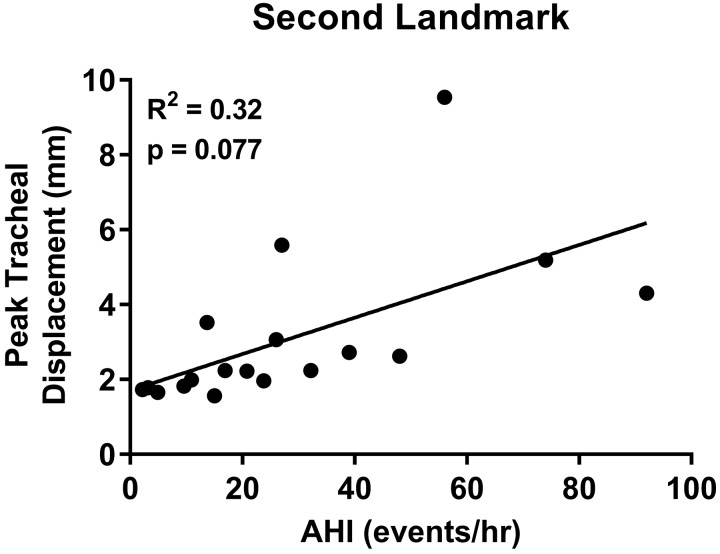
A secondary analysis of tracheal displacement using an alternate tracheal landmark, rostral to the original, was undertaken to confirm that the correlation between AHI and tracheal displacement was independent of the landmark chosen. The alternate landmark was identifiable in a subset of the original group (n = 14 of 34), in addition to 4 subjects that were excluded from the original analysis (total n = 18). The same methodology as the original was applied in this analysis (see methods). The AHI for the second group ranged from 2.2–92 events/h, with a median of 22.3 (10.6–41.3) events/h. The average peak displacement ranged from 1.6–9.5 mm, with a median displacement of 2.2 (1.8–3.7) mm.
The analysis of the alternate landmark revealed that greater tracheal displacement was associated with higher AHI. However, the correlation did not reach statistical significance (Fig. A1). Lack of statistical significance was likely due to the small sample size (n = 18 vs. n = 34 in primary analysis).
We also performed a Pearson correlation and paired samples t test for n = 14 with peak tracheal measurements for both the primary and secondary landmarks. There was a strong correlation (Pearson, r = 0.98, P < 0.001) between peak tracheal displacement measured from the two different landmarks. There was, however, a small but significant difference in the means for each method (P = 0.018). This suggests they are strongly related but not identical measures, likely due to tracheal stretch between the landmarks.
APPENDIX B
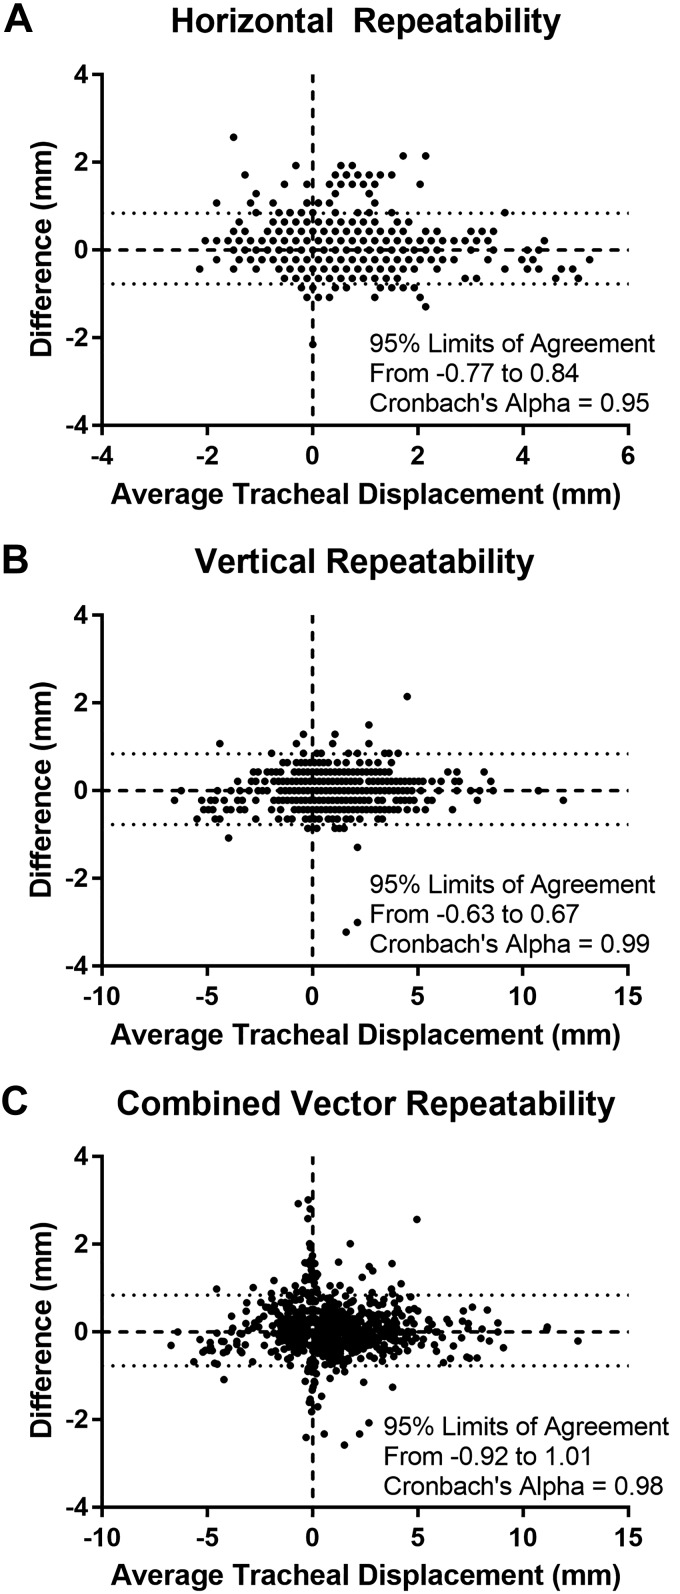
A repeatability analysis was performed on data from the first 13 subjects analyzed. The tracheal landmark in each subject was tracked twice using identical methods, 1 wk apart. Raw data points were entered as X and Y components and also converted to vector distance (as described in methods) and analyzed in aggregate using Bland Altman plots and Cronbach’s α.
Results of the repeatability analysis demonstrate a high level of reliability, with the Bland Altman plots (Fig. B1) showing the limits of agreement to be comparable to the size of a pixel on the MRI scans (0.86 mm). The Cronbach’s α is above 0.95 for all measures, confirming high repeatability.
Fig. A1.
Relationship between peak tracheal displacement and apnea-hypopnea index (AHI) in the analysis of the alternate landmark.
Fig. B1.
Bland Altman plots of repeatability analysis. Average displacement (x-axis) is plotted against the difference between the two measurements (y-axis) for X (A) and Y (B) component displacements, as well as the calculated (combined component) vector displacement (C).
REFERENCES
- 1.Amatoury J, Cheng S, Kairaitis K, Wheatley JR, Amis TC, Bilston LE. Development and validation of a computational finite element model of the rabbit upper airway: simulations of mandibular advancement and tracheal displacement. J Appl Physiol (1985) 120: 743–757, 2016. doi: 10.1152/japplphysiol.00820.2015. [DOI] [PubMed] [Google Scholar]
- 2.Amatoury J, Jordan AS, Toson B, Nguyen C, Wellman A, Eckert DJ. New insights into the timing and potential mechanisms of respiratory-induced cortical arousals in obstructive sleep apnea. Sleep (Basel) 41: zsy160, 2018. doi: 10.1093/sleep/zsy160. [DOI] [PMC free article] [PubMed] [Google Scholar]
- 3.Amatoury J, Kairaitis K, Wheatley JR, Bilston LE, Amis TC. Onset of airflow limitation in a collapsible tube model: impact of surrounding pressure, longitudinal strain, and wall folding geometry. J Appl Physiol (1985) 109: 1467–1475, 2010. doi: 10.1152/japplphysiol.00096.2010. [DOI] [PubMed] [Google Scholar]
- 4.Amatoury J, Kairaitis K, Wheatley JR, Bilston LE, Amis TC. Peripharyngeal tissue deformation and stress distributions in response to caudal tracheal displacement: pivotal influence of the hyoid bone? J Appl Physiol (1985) 116: 746–756, 2014. doi: 10.1152/japplphysiol.01245.2013. [DOI] [PubMed] [Google Scholar]
- 5.Begle RL, Badr S, Skatrud JB, Dempsey JA. Effect of lung inflation on pulmonary resistance during NREM sleep. Am Rev Respir Dis 141: 854–860, 1990. doi: 10.1164/ajrccm/141.4_Pt_1.854. [DOI] [PubMed] [Google Scholar]
- 6.Behrakis PK, Baydur A, Jaeger MJ, Milic-Emili J. Lung mechanics in sitting and horizontal body positions. Chest 83: 643–646, 1983. doi: 10.1378/chest.83.4.643. [DOI] [PubMed] [Google Scholar]
- 7.Brown EC, Cheng S, McKenzie DK, Butler JE, Gandevia SC, Bilston LE. Respiratory movement of upper airway tissue in obstructive sleep apnea. Sleep (Basel) 36: 1069–1076, 2013. doi: 10.5665/sleep.2812. [DOI] [PMC free article] [PubMed] [Google Scholar]
- 8.Brown EC, Cheng S, McKenzie DK, Butler JE, Gandevia SC, Bilston LE. Tongue stiffness is lower in patients with obstructive sleep apnea during wakefulness compared with matched control subjects. Sleep (Basel) 38: 537–544, 2015. doi: 10.5665/sleep.4566. [DOI] [PMC free article] [PubMed] [Google Scholar]
- 9.Brown IG, Bradley TD, Phillipson EA, Zamel N, Hoffstein V. Pharyngeal compliance in snoring subjects with and without obstructive sleep apnea. Am Rev Respir Dis 132: 211–215, 1985. doi: 10.1164/arrd.1985.132.2.211. [DOI] [PubMed] [Google Scholar]
- 10.Cai M, Brown EC, Hatt A, Cheng S, Bilston LE. Effect of head and jaw position on respiratory-related motion of the genioglossus. J Appl Physiol (1985) 120: 758–765, 2016. doi: 10.1152/japplphysiol.00382.2015. [DOI] [PubMed] [Google Scholar]
- 11.Carberry JC, Jordan AS, White DP, Wellman A, Eckert DJ. Upper airway collapsibility (pcrit) and pharyngeal dilator muscle activity are sleep stage dependent. Sleep (Basel) 39: 511–521, 2016. doi: 10.5665/sleep.5516. [DOI] [PMC free article] [PubMed] [Google Scholar]
- 12.Cheng S, Brown EC, Hatt A, Butler JE, Gandevia SC, Bilston LE. Healthy humans with a narrow upper airway maintain patency during quiet breathing by dilating the airway during inspiration. J Physiol 592: 4763–4774, 2014. doi: 10.1113/jphysiol.2014.279240. [DOI] [PMC free article] [PubMed] [Google Scholar]
- 13.Cheng S, Butler JE, Gandevia SC, Bilston LE. Movement of the tongue during normal breathing in awake healthy humans. J Physiol 586: 4283–4294, 2008. doi: 10.1113/jphysiol.2008.156430. [DOI] [PMC free article] [PubMed] [Google Scholar]
- 14.Crystal RG, Gadek JE, Ferrans VJ, Fulmer JD, Line BR, Hunninghake GW. Interstitial lung disease: current concepts of pathogenesis, staging and therapy. Am J Med 70: 542–568, 1981. doi: 10.1016/0002-9343(81)90577-5. [DOI] [PubMed] [Google Scholar]
- 15.Eckert DJ, White DP, Jordan AS, Malhotra A, Wellman A. Defining phenotypic causes of obstructive sleep apnea. Identification of novel therapeutic targets. Am J Respir Crit Care Med 188: 996–1004, 2013. doi: 10.1164/rccm.201303-0448OC. [DOI] [PMC free article] [PubMed] [Google Scholar]
- 16.Edwards N, Middleton PG, Blyton DM, Sullivan CE. Sleep disordered breathing and pregnancy. Thorax 57: 555–558, 2002. doi: 10.1136/thorax.57.6.555. [DOI] [PMC free article] [PubMed] [Google Scholar]
- 17.Fogel RB, Malhotra A, Pillar G, Edwards JK, Beauregard J, Shea SA, White DP. Genioglossal activation in patients with obstructive sleep apnea versus control subjects. Mechanisms of muscle control. Am J Respir Crit Care Med 164: 2025–2030, 2001. doi: 10.1164/ajrccm.164.11.2102048. [DOI] [PubMed] [Google Scholar]
- 18.Heinzer RC, Stanchina ML, Malhotra A, Fogel RB, Patel SR, Jordan AS, Schory K, White DP. Lung volume and continuous positive airway pressure requirements in obstructive sleep apnea. Am J Respir Crit Care Med 172: 114–117, 2005. doi: 10.1164/rccm.200404-552OC. [DOI] [PMC free article] [PubMed] [Google Scholar]
- 19.Heinzer RC, Stanchina ML, Malhotra A, Jordan AS, Patel SR, Lo Y-L, Wellman A, Schory K, Dover L, White DP. Effect of increased lung volume on sleep disordered breathing in patients with sleep apnoea. Thorax 61: 435–439, 2006. doi: 10.1136/thx.2005.052084. [DOI] [PMC free article] [PubMed] [Google Scholar]
- 20.Hoffstein V, Zamel N, Phillipson EA. Lung volume dependence of pharyngeal cross-sectional area in patients with obstructive sleep apnea. Am Rev Respir Dis 130: 175–178, 1984. doi: 10.1164/arrd.1984.130.2.175. [DOI] [PubMed] [Google Scholar]
- 21.Hudgel DW, Devadatta P. Decrease in functional residual capacity during sleep in normal humans. J Appl Physiol 57: 1319–1322, 1984. doi: 10.1152/jappl.1984.57.5.1319. [DOI] [PubMed] [Google Scholar]
- 22.Issa FG, Sullivan CE. Upper airway closing pressures in obstructive sleep apnea. J Appl Physiol 57: 520–527, 1984. doi: 10.1152/jappl.1984.57.2.520. [DOI] [PubMed] [Google Scholar]
- 23.Jordan AS, McEvoy RD, Edwards JK, Schory K, Yang CK, Catcheside PG, Fogel RB, Malhotra A, White DP. The influence of gender and upper airway resistance on the ventilatory response to arousal in obstructive sleep apnoea in humans. J Physiol 558: 993–1004, 2004. doi: 10.1113/jphysiol.2004.064238. [DOI] [PMC free article] [PubMed] [Google Scholar]
- 24.Jordan AS, White DP, Owens RL, Eckert DJ, Rahangdale S, Yim-Yeh S, Malhotra A. The effect of increased genioglossus activity and end-expiratory lung volume on pharyngeal collapse. J Appl Physiol (1985) 109: 469–475, 2010. doi: 10.1152/japplphysiol.00373.2010. [DOI] [PMC free article] [PubMed] [Google Scholar]
- 25.Kairaitis K, Byth K, Parikh R, Stavrinou R, Wheatley JR, Amis TC. Tracheal traction effects on upper airway patency in rabbits: the role of tissue pressure. Sleep 30: 179–186, 2007. doi: 10.1093/sleep/30.2.179. [DOI] [PubMed] [Google Scholar]
- 26.Kairaitis K, Verma M, Amatoury J, Wheatley JR, White DP, Amis TC. A threshold lung volume for optimal mechanical effects on upper airway airflow dynamics: studies in an anesthetized rabbit model. J Appl Physiol (1985) 112: 1197–1205, 2012. doi: 10.1152/japplphysiol.01286.2011. [DOI] [PubMed] [Google Scholar]
- 27.Kohno A, Kitamura Y, Kato S, Imai H, Masuda Y, Sato Y, Isono S. Displacement of the hyoid bone by muscle paralysis and lung volume increase: the effects of obesity and obstructive sleep apnea. Sleep (Basel) 42: zsy198, 2019. doi: 10.1093/sleep/zsy198. [DOI] [PMC free article] [PubMed] [Google Scholar]
- 28.Malhotra A, Huang Y, Fogel RB, Pillar G, Edwards JK, Kikinis R, Loring SH, White DP. The male predisposition to pharyngeal collapse: importance of airway length. Am J Respir Crit Care Med 166: 1388–1395, 2002. doi: 10.1164/rccm.2112072. [DOI] [PubMed] [Google Scholar]
- 29.Marinelli JP, Levin DL, Vassallo R, Carter RE, Hubmayr RD, Ehman RL, McGee KP. Quantitative assessment of lung stiffness in patients with interstitial lung disease using MR elastography. J Magn Reson Imaging 46: 365–374, 2017. doi: 10.1002/jmri.25579. [DOI] [PubMed] [Google Scholar]
- 30.Metes A, Ohki M, Cole P, Haight JS, Hoffstein V. Snoring, apnea and nasal resistance in men and women. J Otolaryngol 20: 57–61, 1991. [PubMed] [Google Scholar]
- 31.Navajas D, Farre R, Rotger MM, Milic-Emili J, Sanchis J. Effect of body posture on respiratory impedance. J Appl Physiol (1985) 64: 194–199, 1988. doi: 10.1152/jappl.1988.64.1.194. [DOI] [PubMed] [Google Scholar]
- 32.Osman NF, Prince JL. Visualizing myocardial function using HARP MRI. Phys Med Biol 45: 1665–1682, 2000. doi: 10.1088/0031-9155/45/6/318. [DOI] [PubMed] [Google Scholar]
- 33.Owens RL, Malhotra A, Eckert DJ, White DP, Jordan AS. The influence of end-expiratory lung volume on measurements of pharyngeal collapsibility. J Appl Physiol (1985) 108: 445–451, 2010. doi: 10.1152/japplphysiol.00755.2009. [DOI] [PMC free article] [PubMed] [Google Scholar]
- 34.Remmers JE, deGroot WJ, Sauerland EK, Anch AM. Pathogenesis of upper airway occlusion during sleep. J Appl Physiol 44: 931–938, 1978. doi: 10.1152/jappl.1978.44.6.931. [DOI] [PubMed] [Google Scholar]
- 35.Rowley JA, Permutt S, Willey S, Smith PL, Schwartz AR. Effect of tracheal and tongue displacement on upper airway airflow dynamics. J Appl Physiol (1985) 80: 2171–2178, 1996. doi: 10.1152/jappl.1996.80.6.2171. [DOI] [PubMed] [Google Scholar]
- 36.Rowley JA, Zhou X, Vergine I, Shkoukani MA, Badr MS. Influence of gender on upper airway mechanics: upper airway resistance and Pcrit. J Appl Physiol (1985) 91: 2248–2254, 2001. doi: 10.1152/jappl.2001.91.5.2248. [DOI] [PubMed] [Google Scholar]
- 37.Smith PL, Wise RA, Gold AR, Schwartz AR, Permutt S. Upper airway pressure-flow relationships in obstructive sleep apnea. J Appl Physiol (1985) 64: 789–795, 1988. doi: 10.1152/jappl.1988.64.2.789. [DOI] [PubMed] [Google Scholar]
- 38.Squier SB, Patil SP, Schneider H, Kirkness JP, Smith PL, Schwartz AR. Effect of end-expiratory lung volume on upper airway collapsibility in sleeping men and women. J Appl Physiol (1985) 109: 977–985, 2010. doi: 10.1152/japplphysiol.00080.2010. [DOI] [PMC free article] [PubMed] [Google Scholar]
- 39.Stadler DL, McEvoy RD, Bradley J, Paul D, Catcheside PG. Changes in lung volume and diaphragm muscle activity at sleep onset in obese obstructive sleep apnea patients vs. healthy-weight controls. J Appl Physiol (1985) 109: 1027–1036, 2010. doi: 10.1152/japplphysiol.01397.2009. [DOI] [PubMed] [Google Scholar]
- 40.Stadler DL, McEvoy RD, Sprecher KE, Thomson KJ, Ryan MK, Thompson CC, Catcheside PG. Abdominal compression increases upper airway collapsibility during sleep in obese male obstructive sleep apnea patients. Sleep 32: 1579–1587, 2009. doi: 10.1093/sleep/32.12.1579. [DOI] [PMC free article] [PubMed] [Google Scholar]
- 41.Stanchina ML, Malhotra A, Fogel RB, Trinder J, Edwards JK, Schory K, White DP. The influence of lung volume on pharyngeal mechanics, collapsibility, and genioglossus muscle activation during sleep. Sleep 26: 851–856, 2003. doi: 10.1093/sleep/26.7.851. [DOI] [PubMed] [Google Scholar]
- 42.Stoohs R, Guilleminault C. Snoring during NREM sleep: respiratory timing, esophageal pressure and EEG arousal. Respir Physiol 85: 151–167, 1991. doi: 10.1016/0034-5687(91)90058-Q. [DOI] [PubMed] [Google Scholar]
- 43.Tagaito Y, Isono S, Remmers JE, Tanaka A, Nishino T. Lung volume and collapsibility of the passive pharynx in patients with sleep-disordered breathing. J Appl Physiol (1985) 103: 1379–1385, 2007. doi: 10.1152/japplphysiol.00026.2007. [DOI] [PubMed] [Google Scholar]
- 44.Thut DC, Schwartz AR, Roach D, Wise RA, Permutt S, Smith PL. Tracheal and neck position influence upper airway airflow dynamics by altering airway length. J Appl Physiol (1985) 75: 2084–2090, 1993. doi: 10.1152/jappl.1993.75.5.2084. [DOI] [PubMed] [Google Scholar]
- 45.Tuck SA, Remmers JE. Mechanical properties of the passive pharynx in Vietnamese pot-bellied pigs. I. Statics. J Appl Physiol (1985) 92: 2229–2235, 2002. doi: 10.1152/japplphysiol.00761.2001. [DOI] [PubMed] [Google Scholar]
- 46.Van de Graaff WB. Thoracic influence on upper airway patency. J Appl Physiol (1985) 65: 2124–2131, 1988. doi: 10.1152/jappl.1988.65.5.2124. [DOI] [PubMed] [Google Scholar]
- 48.Van de Graaff WB. Thoracic traction on the trachea: mechanisms and magnitude. J Appl Physiol (1985) 70: 1328–1336, 1991. doi: 10.1152/jappl.1991.70.3.1328. [DOI] [PubMed] [Google Scholar]
- 49.van der Weide L, van Sörnsen de Koste JR, Lagerwaard FJ, Vincent A, van Triest B, Slotman BJ, Senan S. Analysis of carina position as surrogate marker for delivering phase-gated radiotherapy. Int J Radiat Oncol Biol Phys 71: 1111–1117, 2008. doi: 10.1016/j.ijrobp.2007.11.027. [DOI] [PubMed] [Google Scholar]
- 50.West JB. Mechanics of breathing: how the lung is supported and moved. In: Repiratory Physiology: The Essentials (9th ed.). Baltimore, MD: Lippincott Williams and Williams, 2012, p. 111–112. [Google Scholar]


