

Abstract
Kidney disease, including proximal tubule (PT) dysfunction, and vitamin D deficiency are among the most prevalent complications in sickle cell disease (SCD) patients. Although these two comorbidities have never been linked in SCD, the PT is the primary site for activation of vitamin D. Precursor 25-hydroxyvitamin D [25(OH)D] bound to vitamin D-binding protein (DBP) is taken up by PT cells via megalin/cubilin receptors, hydroxylated to the active 1,25-dihydroxyvitamin D [1,25(OH)2D] form, and released into the bloodstream. We tested the hypothesis that cell-free hemoglobin (Hb) filtered into the PT lumen impairs vitamin D uptake and metabolism. Hb at concentrations expected to be chronically present in the ultrafiltrate of SCD patients competed directly with DBP for apical uptake by PT cells. By contrast, uptake of retinol binding protein was impaired only at considerably higher Hb concentrations. Prolonged exposure to Hb led to increased oxidative stress in PT cells and to a selective increase in mRNA levels of the CYP27B1 hydroxylase, although protein levels were unchanged. Hb exposure also impaired vitamin D metabolism in PT cells, resulting in reduced ratio of 1,25(OH)2D:25(OH)D. Moreover, plasma levels of 1,25(OH)2D were reduced in a mouse model of SCD. Together, our data suggest that Hb released by chronic hemolysis has multiple effects on PT function that contribute to vitamin D deficiency in SCD patients.
Keywords: endocytosis, megalin, proximal tubule, sickle cell disease, vitamin D
INTRODUCTION
Sickle cell disease (SCD) is one of the most prevalent monogenic disorders and is caused by autosomal recessive inheritance of pathogenic mutations in the β-globin subunit of hemoglobin (Hb). These mutations increase Hb polymerization in RBCs, forcing them into a sickled shape, and lead to increased vascular blockage and hemolytic crisis in SCD patients (20). In recent years, therapeutic advances have significantly extended SCD patient lifespan, causing a rise in the prevalence of severe comorbidities, including sickle cell nephropathy (SCN) (27). SCN currently accounts for up to 18% of SCD patient mortality and is thought to arise as a consequence of both recurring hemolytic crisis in the hypoxic renal medulla and increased exposure to cell-free Hb released during RBC hemolysis (27).
Although overall Hb levels in SCD patients are typically lower than normal, the concentration of circulating cell-free Hb in patients is chronically ∼10 times higher than in healthy individuals. Moreover, plasma concentrations can reach up to 1 g/dl (620 µM) during times of hemolytic crisis (28). Cell-free Hb circulates primarily as dimers (∼32 kDa), which can escape the glomerular barrier and enter the PT lumen. Based on the estimated fractional filtration coefficient of 0.03, ultrafiltrate concentrations of Hb in SCD patients range from ∼0.6 µM chronically to ≤20 µM during crisis (25). Recovery of filtered proteins by proximal tubule (PT) epithelial cells is accomplished through apical endocytosis mediated by megalin and cubilin receptors (9). Megalin and cubilin each possess multiple interaction sites that enable the binding and internalization of numerous filtered proteins, including Hb (15, 17). Once internalized, Hb releases heme, which triggers oxidative stress and leads to cytoprotective responses, including induction of heme-oxygenase 1 (HO-1) expression in the PT (26).
An early sign of PT dysfunction is tubular proteinuria, resulting from the incomplete recovery of normally filtered proteins by this nephron segment and their consequent excretion in the urine. Importantly, many young SCD patients develop tubular proteinuria (1, 23, 24), suggesting that PT dysfunction occurs early in the progression of SCN. Prolonged PT dysfunction and tubular proteinuria have been linked to kidney inflammation and fibrosis, which can lead to glomerular damage and eventual renal failure (7, 29). Additionally, PT dysfunction can prevent normal uptake of filtered vitamin carrier proteins that bind to megalin and cubilin, including vitamin D-binding protein (DBP) and retinol-binding protein (RBP) (10, 42). Failure to reclaim these carrier proteins can lead to vitamin deficiencies (5, 38). This is particularly true for vitamin D, as the PT is the primary site for vitamin D reclamation and activation (11). PT cells express mitochondrial enzymes 25-hydroxyvitamin D-1 α-hydroxylase (CYP27B1) and 1,25-dihydroxyvitamin D 24-hydroxylase (CYP24A1), which, respectively, convert the precursor 25-hydroxyvitamin D [25(OH)D; liberated from its DBP carrier] to its active form 1,25-dihydroxyvitamin D [1,25(OH)2D] or its degradation product 24,25-dihydroxyvitamin D [24,25(OH)2D] depending on vitamin D status (6). There is a high prevalence of vitamin D deficiency in SCD patients that is difficult to treat effectively. Although the contribution of PT dysfunction to vitamin D deficiency is unknown, assessing changes in vitamin D activation by PT cells may provide a better understanding of vitamin D status and treatment in SCD patients.
We previously reported that Hb directly competes with albumin for endocytic uptake by PT cells (14). Because albumin and DBP have similar secondary structures, we hypothesized that Hb may also inhibit DBP uptake by PT cells. Additionally, Hb-induced cytotoxicity could impact vitamin D metabolism by PT cells, as oxidative stress has been linked to altered activity or expression of PT vitamin D hydroxylases (12, 41, 45). Reduced DBP uptake and impaired vitamin D metabolism in the PT could play a significant role in the development of vitamin D deficiency in SCD patients. Thus, we set out to assess how exposure to cell-free Hb affects the uptake of vitamin carriers DBP and RBP and vitamin D hydroxylase expression in PT cells. We found that chronically filtered levels of Hb significantly inhibit DBP uptake by PT cells, similarly to what we previously reported for albumin. Uptake of RBP was considerably less sensitive to Hb, suggesting that Hb binding competition is selective for a subset of structurally related megalin/cubilin ligands. Prolonged exposure to Hb led to increased oxidative stress in PT cells and to a selective increase in CYP27B1 mRNA levels, although protein levels of both CYP24A1 and CYP27B1 were unaffected. Moreover, exposure to Hb impaired vitamin D activation by PT cells. Finally, we confirmed that plasma levels of 1,25(OH)2D are reduced in a mouse model of SCD. Together, our data suggest that increased cell-free Hb levels in SCD patients may impair vitamin D reclamation and activation by PT cells, which could contribute to vitamin D deficiency commonly observed in patients.
MATERIALS AND METHODS
Cell culture.
Opossum kidney (OK) cells (RRID:CVCL_0472) were cultured in DMEM/F12 medium with 5% FBS (Atlanta Biologicals) and 5 mM GlutaMAX (Gibco). LLC-PK1 cells (RRID:CVCL_0391) were cultured in DMEM/F12 medium with 10% FBS (Atlanta Biologicals) and 5 mM GlutaMAX (Gibco).
Hemoglobin and fluorescent protein conjugates.
Hb was isolated and prepared as previously described, and concentrations were calculated per mole of heme (14). Purified Hb, DBP (GC-Globulin; Athens Research & Technology) and RBP (RBP4; Athens Research & Technology) were labeled with Alexa Fluor-488 or Alexa Fluor-647, as indicated using the Protein Labeling Kit (Invitrogen) according to the manufacturer’s instructions.
Quantitation and imaging of endocytosis.
In experiments measuring the uptake of a single protein, OK (4 × 10⁵) or LLC-PK1 (5 × 10⁵) cells were plated in duplicate to triplicate samples on 12-mm Transwell (0.4 µm pore) polycarbonate membrane inserts (Corning) in a 12-well plate, with 0.5 ml of apical and 1.5 ml of basolateral culture medium. The following day, cells were transferred to an orbital shaker set at 146 rpm in the incubator and allowed to grow for an additional 3–4 days with daily medium changes. Studies in our laboratory demonstrate that chronic exposure to orbital shear stress enhances cell differentiation and endocytic capacity (22). Cells were incubated in serum-free medium with Alexa Fluor-647-DBP (25 nM in OK cells, 500 nM in LLC-PK1 cells) or Alexa Fluor-647-RBP (100 nM in OK cells, 500 nM in LLC-PK1 cells) for 1 h at 37°C under orbital shear stress in the presence or absence of unlabeled oxyhemoglobin (oxyHb) as specified.
For experiments measuring the dual uptake of two fluorescently tagged proteins by spectrofluorimetry, OK (6 × 10⁴) cells were plated in sextuplicate samples on a glass-bottomed, black-welled 96-well plates (Perkin-Elmer) with 200 µL of medium. Cells were cultured for 2 days with daily medium changes. Cells were then incubated with apically added 0.6 µM Alexa Fluor-647-BSA (Invitrogen) or 25 nM Alexa Fluor-647-DBP and 0–20 µM Alexa Fluor-488-Hb, as indicated in 50 µL of serum-free medium for 2 h at 37°C.
To quantify the uptake of fluorescent ligands, filters were washed three times with cold PBS containing Ca2+ and Mg2+, solubilized in 300 µl of 20 mM MOPS, pH 7.4, and 0.1% Triton X-100 for 30 min at 4°C with shaking, and fluorescence was quantified using the GloMax Multi-Detection System (Promega). Experiments conducted on 96-well plates were solubilized in 150 µL. For imaging, cells on filter supports were washed, fixed in 4% paraformaldehyde, and imaged using a Leica TCS SP5 confocal microscope. Maximum projections of confocal stacks were created in FIJI.
Quantitative PCR analysis.
OK (4 × 10⁵) cells or LLC-PK1 (5 × 10⁵) cells cultured on filter supports were treated with apically added oxyHb or methemoglobin (metHb) for 72 h with daily medium changes. Cells were collected using Accutase (Sigma), and RNA was extracted using the Ambion PureLink RNA mini kit (ThermoFisher) according to the manufacturer’s protocol. LLC-PK1 cell total RNA was treated with RQ1 Rnase-free Dnase (Promega) according to the manufacturer’s protocol. cDNA was synthesized from 1 µg of total RNA using the Reverse Transcriptase, High Capacity cDNA Kit (Life Technologies). Gene expression was measured by quantitative PCR (qPCR) using the iTaq Universal SYBR Green Supermix 500 (Bio-Rad) on a CFX ConnectTM Real-Time PCR Detection System (Bio-Rad). Gene primers used in the experiments are listed in Supplemental Table S1 (All Supplemental Material for this article is available at https://doi.org/10.6084/m9.figshare.9714248). The expression of each gene was normalized to ACTB expression, and relative fold change (RFC) was calculated using the equation where δδCq = treatment δCq − control δCq, and δCq = target gene Cq − ACTN Cq.
Western blot analysis.
OK (4 × 10⁵) cells were cultured on filters as above for 24 or 72 h in the presence of Hb (oxyHb or metHb) at the indicated concentration and time periods. Cells were then washed and solubilized, and lysates were normalized by total protein. Equivalent amounts of total protein were separated by SDS-PAGE on 4–15% Criterion TGX Stain-Free gels (Bio-Rad). Samples were blotted using rabbit polyclonal anti CYP24A1 antibody (1:1,000, LS-C407760; LifeSpan BioSciences, Inc.) and rabbit polyclonal anti CYP27B1 antibody (1:700, LS-C407761; LifeSpan BioSciences, Inc.); both antibodies were commercially validated for immunohistochemistry and Western blotting.
Quantitation of vitamin D metabolites.
LLC-PK1 (1.6 × 10⁶) cells were plated on 24-mm Transwell (0.4-µm pore) polycarbonate membrane inserts (Corning) in a six-well plate, with 1.5 ml of apical and 2.5 ml of basolateral culture medium. The following day, cells were transferred to an orbital shaker and allowed to grow for an additional 3 days with daily medium changes. Cells were cultured in serum-free medium for the last 24 h and incubated with 100 nM calcifediol [25(OH)D; Tocris Biosciences] for 4 h. Cells were then washed, solubilized in 600 µL of RIPA buffer, and stored at −80°C. Quantitation of vitamin D 25(OH)D and 1,25(OH)2D metabolites was performed using 24-hydroxy vitamin DS EIA (Immunodiagnostic Systems, Inc.) and mouse 1,25-dihydroxyvitamin D3 (DHVD3) ELISA kits (MyBioSource), respectively, according to the manufacturer’s instructions. Equal volumes of each sample were used in the assessment of vitamin D metabolite concentrations, and results were normalized to total protein.
Plasma and urine collection and analysis.
Townes sickle cell knockout-transgenic HbSS and HbAA mice on a background strain of B6 and S129 were bred and maintained as previously reported (18, 34). Hb genotype and phenotype were confirmed by PCR and Hb gel electrophoresis, respectively. Plasma from 8- to 20-wk-old male (4 HbSS, 4 HbAA) and female (2 HbSS, 1 HbAA) mice was included in the study. Urine collected from 8- to 21-wk-old male mice was used to quantitate NGAL levels. Animal handling and experimentation were conducted ethically and in accordance with approved Institutional Animal Care and Use Committee protocols at the University of Pittsburgh. Blood was collected by cardiac exsanguination using heparin anti-coagulant under isoflurane anesthesia, and plasma was obtained by 300 g of centrifugation for 10 min at ambient temperature and stored at −80°C. Analysis of plasma vitamin D metabolite levels was performed by ELISA as described above.
Statistical analysis and graphical representation.
Statistical analysis was completed using StataSE 15 (StataCorp. 2017, Stata Statistical Software: Release 15; StataCorp LLC, College Station, TX). Experiment-to-experiment variability was assessed as a possible confounder in all experiments. If this variability was significant, it was factored in as a covariate when determining significance of experimental conditions via ANCOVA analysis, followed by pairwise comparison. Additionally, in these experiments, graphed data were normalized by dividing each data point by its experimental mean to allow a clearer view of data trends. All graphics were generated using GraphPad Prism version 7.03 (GraphPad Software, La Jolla, CA).
RESULTS
Hemoglobin competitively inhibits endocytic uptake of DBP by proximal tubule cells.
We previously demonstrated that Hb competes directly with albumin for internalization by opossum kidney (OK) PT cells (14). To assess whether Hb also impairs DBP uptake, we incubated polarized, filter-grown OK cells with 25 nM Alexa Fluor-647-labeled DBP (roughly equivalent to the estimated normal filtrate concentration) for 1 h at 37°C in the presence of varying concentrations of unlabeled oxyHb and then washed the cells and quantified cell-associated fluorescence by spectrofluorimetry. The concentrations of Hb that we chose ranged from that estimated to be chronically filtered into the kidney tubule lumen in SCD (baseline, 0.6 µM) to the much higher levels present during hemolytic crisis (20 µM) (25, 28). DBP uptake was significantly inhibited in a dose-dependent manner by all concentrations of Hb tested (Fig. 1A). Half-maximal inhibition of DBP was observed at ∼0.8 µM Hb, close to the estimated baseline filtrate concentration in SCD. At the highest Hb concentration tested (20 µM), DBP uptake was inhibited by 87% (Fig. 1A). OxyHb also significantly inhibited DBP uptake in a porcine PT cell line (LLC-PK1) that expresses megalin and cubilin receptors but which has substantially lower endocytic capacity compared with our optimized OK cell culture model (Supplemental Fig. S1A; https://doi.org/10.6084/m9.figshare.9714248).
Fig. 1.
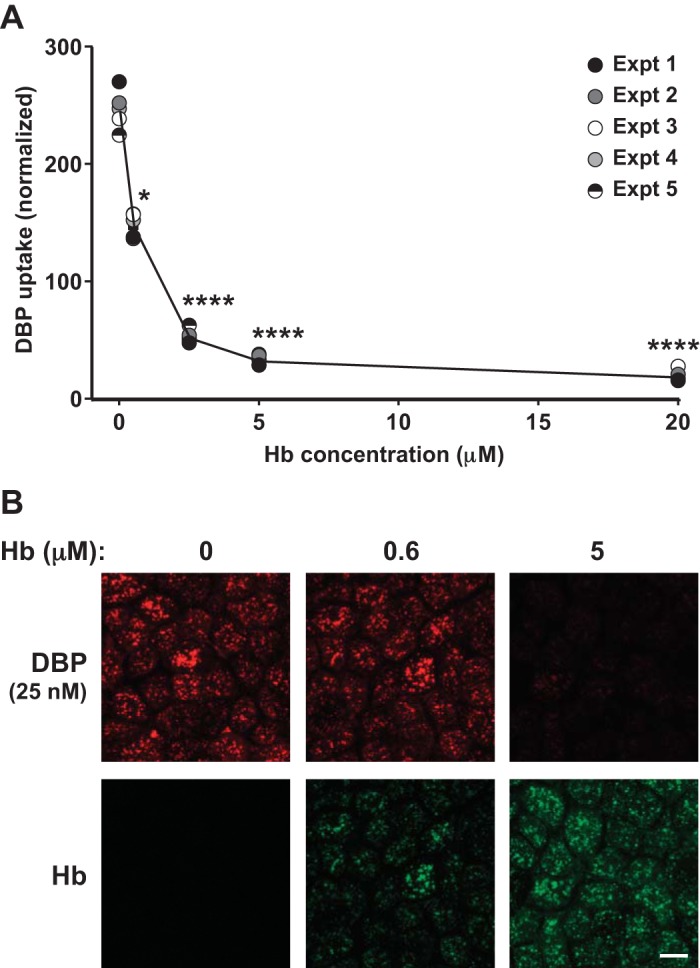
Hemoglobin competes with vitamin D-binding protein (DBP) for uptake by proximal tubule cells. A: filter-grown opossum kidney (OK) cells were incubated with 25 nM apically added Alexa Fluor-647-DBP in the presence of the indicated concentrations of oxyhemoglobin (oxyHb; 0–20 µM) for 1 h at 37°C and then solubilized, and cell-associated DBP was quantified by spectrofluorimetry. Data from 5 experiments done in duplicate are plotted, with each experiment represented by a different symbol. Graphed values were normalized by dividing each point by the respective experimental mean for that condition. *P ≤ 0.01, ****P ≤ 0.0001, by one-way ANCOVA (Dunnett’s multiple comparisons test). B: filter-grown OK cells incubated for 1 h at 37°C with 25 nM apically added Alexa Fluor-647 DBP (red) in the presence of 0, 0.6, or 5 µM Alexa Fluor-488 oxyHb (green) were fixed and processed for confocal imaging. Scale bar, 10 µm.
To elucidate whether reduced DBP uptake is due to competitive inhibition by Hb, we labeled Hb with Alexa Fluor-488 and measured DBP and Hb uptake simultaneously in PT cells. Fluorescent imaging of polarized filter-grown OK PT cells demonstrated the concomitant reduced DBP and increased Hb uptake with increasing concentrations of Hb (Fig. 1B). This dual fluorescence assay was adapted to a 96-well plate format to enable simultaneous quantitation of hemoglobin and DBP uptake by OK cells. After incubation with fluorescently labeled proteins for 2 h, cells were solubilized, and cell-associated fluorescence quantified. In agreement with our hypothesis, increasing Hb concentrations resulted in an inhibition of DBP uptake and an increase in Hb cellular incorporation (Supplemental Fig. S2A; https://doi.org/10.6084/m9.figshare.9714248). The estimated half-maximal inhibition of DBP in these experiments (∼0.9 µM Hb) is similar to that observed in cells grown on filters. Like DBP, albumin is almost entirely α-helical in structure, and Hb had a similar inhibitory effect on albumin uptake by PT cells (half maximal inhibition, ∼0.6 µM Hb, 93% inhibition at 20 µM Hb; Fig. Supplemental Fig. S2B; https://doi.org/10.6084/m9.figshare.9714248). Together, these data suggest that tubular uptake of normally filtered ligands is impaired in SCD.
Baseline SCD filtrate concentrations of hemoglobin do not inhibit RBP uptake by PT.
We next tested whether Hb inhibits uptake of a filtered ligand that is not homologous to albumin/DBP and not α-helical in structure. To this end, we measured the uptake of RBP, a small (∼21 kDa) filtrate protein comprised primarily of β-sheets, by OK cells in the presence of increasing concentrations of oxyHb. As shown in Fig. 2, only high concentrations of oxyHb consistent with those observed during crisis were able to elicit a small (∼20%) but statistically significant reduction in RBP uptake compared with untreated controls. High concentrations of Hb also significantly inhibited RBP uptake in LLC-PK1 cells, although uptake in general in these cells was very low and necessitated the use of higher (0.5 µM) RBP concentrations to observe any effect (Supplemental Fig. S1B; https://doi.org/10.6084/m9.figshare.9714248). These data suggest that the effect of filtered Hb on protein uptake is specific for a subset of megalin/cubilin ligands.
Fig. 2.
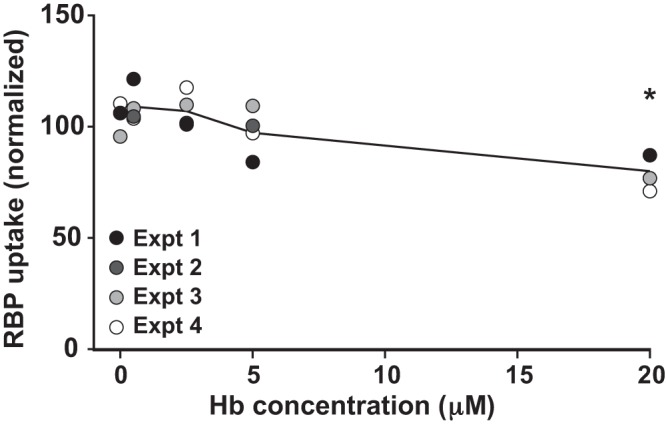
Hemoglobin weakly inhibits retinol-binding protein (RBP) uptake by proximal tubule cells. Filter-grown opossum kidney (OK) cells were incubated with 0.1 µM apically added Alexa Fluor-647 RBP in the presence of the indicated concentrations of oxyhemoglobin (oxyHb; 0–20 µM), and cell-associated RBP was quantified as in Fig. 1. Data from four experiments performed in duplicate are plotted, with each experiment represented by a different symbol. Graphed uptake values were normalized by dividing each point by the respective experimental mean for that condition. *P ≤ 0.05, by one-way ANCOVA (Dunnett’s multiple comparisons test). Expt, experiment.
Hemoglobin induces oxidative stress and alters transcription of vitamin D hydroxylase CYP27B1.
Free Hb released as a consequence of hemolysis is known to trigger production of reactive oxygen species (ROS) and to induce compensatory cytoprotective responses in the vasculature and the kidney (32, 33, 39). Oxidative stress can impair numerous cell functions, including the expression and activity of the mitochondrial vitamin D hydroxylases CYP27B1 and CYP24A1, which control the balance between activation and degradation of 25(OH)D in the PT (12, 41). As expected, qPCR studies in LLC-PK1 cells confirmed that exposure for 72 h to Hb increased expression of the cytoprotective HO-1-encoding gene HMOX1 (Fig. 3A). Treatment with low (1 µM) and high (20 µM) concentrations of oxyHb resulted in an ∼60% and >250% increase in HMOX1 transcripts, respectively. Similar results were observed in cells treated with metHb, in which the ferrous (Fe2+) iron in the heme group of oxyHb has been converted to the more reactive ferric Fe3+ state (33, 40) (Fig. 3A). To assess the effects on vitamin D hydroxylase expression, we treated filter-grown OK cells under the same conditions as above and then lysed the cells and collected total RNA and protein. Quantitative PCR and Western blotting were performed to measure CYP24A1 and CYP27B1 mRNA and protein expression, respectively. Sample mRNA expression was normalized to ACTB mRNA levels, whereas protein expression was normalized to total loaded protein. We observed a selective and significant increase in CYP27B1 transcript expression upon exposure to both oxyHb and metHb (Fig. 3, B and C). The ∼1.5-fold increase we measured is comparable with that observed in patients with chronic kidney disease and acute renal inflammation (44). However, no effect on expression of either CYP24A1 or CYP27B1 protein was observed under these conditions (Fig. 3, D–F). Because oxidative damage to proteins can affect degradation rates (4), we hypothesized that the observed disconnect between increased mRNA and unchanged protein levels of CYP27B1 may be due to increased protein degradation. However, cycloheximide chase experiments suggested that CYP24A1 and CYP27B1 half-lives are long (>8 h) and not appreciably altered by Hb exposure (data not shown).
Fig. 3.

Hemoglobin induces oxidative stress and selectively increases proximal tubule (PT) CYP27B1 transcript levels. Filter-grown LLC-PK1 (A) or opossum kidney (OK) (B–F) cells were incubated with concentrations of oxyhemoglobin (oxyHb) or methemoglobin (metHb) for 72 h at the concentrations indicated. Cells were then washed and lysed, and total RNA and protein were collected. HMOX1 (A), CYP24A1 (B), and CYP27B1 (C) transcripts were quantified by quantitative PCR and normalized to ACTB transcript levels. Relative fold change (RFC) of treated conditions compared with an untreated control (normalized to 1; dotted line) is plotted. Protein expression of CYP24A1 and CYP27B1 was quantified by Western blotting. D: representative Western blots for CYP24A1 and CYP27B1 with migration of molecular mass markers (in kDa) indicated. RFC of CYP24A1 (E) and CYP27B1 (F) in treated conditions compared with an untreated control (normalized to 1; dotted line) is plotted. Data from 5 experiments and the mean ± SD of the aggregate data are plotted. *P ≤ 0.05, **P ≤ 0.01, ***P ≤ 0.001, by one-sample t test. Similar statistical results were obtained when the raw data were analyzed by one-way ANCOVA (Dunnett’s multiple comparisons test).
Altered vitamin D metabolism in PT cells exposed to hemoglobin and in a sickle cell mouse model.
To test whether exposure to Hb affects PT metabolism of vitamin D, we treated LLC-PK1 cells with 1 µM or 20 µM Hb for 72 h (the last 24 h under serum-free conditions) and then supplemented them with 100 nM 25(OH)D and measured cellular 25(OH)D and 1,25(OH)2D levels. As shown in Fig. 4A, we observed a trending reduction in the conversion of 25(OH)D to 1,25(OH)2D at higher levels of Hb. Despite some variability between experiments, there was no apparent change in 25(OH)D levels (Fig. 4B). As a consequence, the ratio of 1,25(OH)2D:25(OH)D was reduced in cells (Fig. 4C). Because the measurements of 1,25(OH)2D and 25(OH)D were performed in the same cell lysates, it is not surprising that the 1,25(OH)2D:25(OH)D ratios in Hb-exposed cells in Fig. 4C are significantly different from control, even though the trend in 1,25(OH)2D levels in Fig. 4A did not reach statistical significance. To determine whether vitamin D status is altered in a mouse model of SCD, we measured plasma 1,25(OH)2D and 25(OH)D levels in 8- to 20-wk-old Townes sickle cell transgenic HbSS mice and HbAA controls. Tubular injury occurs as early as 8 wk of age in SCD mice (19). Consistent with this, we measured increased levels of the tubular injury biomarker neutrophil gelatinase-associated lipocalin (NGAL) in urine collected from 8- to 21-wk-old HbSS mice (Table 1). As shown in Fig. 5, Townes HbSS mice had significantly reduced levels of plasma 1,25(OH)2D (Fig. 5A) and elevated levels of 25(OH)D (Fig. 5B) compared with HbAA mice, leading to a lower 1,25(OH)2D:25(OH)D ratio in the HbSS mice (Fig. 5C). Together, these data suggest that prolonged Hb exposure impairs activation of vitamin D by PT cells, leading to alterations in vitamin D status.
Fig. 4.

Vitamin D metabolism in proximal tubule cells is modulated by hemoglobin exposure. Filter-grown LLCPK1 cells were incubated for 72 h with 1 µM or 20 µM concentrations of oxyhemoglobin (oxyHb) and then treated with 100 nM 25-hydroxyvitamin D [25(OH)D] for 4 h. A and B: cells were then washed and solubilized, and 1,25(OH)2D (A) and 25(OH)D (B) concentrations were quantified as described in materials and methods. C: the ratio of 1,25(OH)2D to 25(OH)D is plotted. Data from three independent experiments (means ± SD) are plotted. *P < 0.05, by one-way ANOVA (Dunnett’s multiple comparisons test).
Table 1.
Urinary NGAL excretion in HbAA and HbSS mice
| Age, wk | HbAA (n = 4) | HbSS (n = 5) |
|---|---|---|
| 8–12 | 15.79 ± 7.0 | 57.1 ± 32.8 |
| 17–21 | 14.0 ± 11.4 | 39.5 ± 18.0 |
Values are means ± SD. NGAL, neutrophil gelatinase-associated lipocalin. Male HbAA and HbSS mice were placed in metabolic cages for 12 h with no access to food or water. Urinary NGAL levels were measured by ELISA. Urinary NGAL excretion is higher in HbSS vs. HbAA mice (P < 0.005) regardless of age (P = 0.3456). as determined by two-way ANOVA analysis.
Fig. 5.

Vitamin D status is altered in Townes sickle cell HbSS mice. A and B: 1,25-dihydroxyvitamin D [1,25(OH)2D] (A) and 25(OH)D (B) levels were quantified in plasma from 8- to 20-wk-old male and female HbSS-Townes (sickle cell disease, SCD) and HbAA-Townes (control) mice. C: the ratio of 1,25(OH)2D to 25(OH)D is plotted. *P < 0.05, **P ≤ 0.01, by unpaired t test.
DISCUSSION
The studies described here demonstrate that concentrations of oxyHb estimated to be present chronically in the tubule lumen of SCD patients inhibit PT cell uptake of the vitamin carrier DBP. By contrast, uptake of RBP was affected only at the highest Hb concentrations observed during hemolytic crisis. Additionally, we found that prolonged exposure to apical Hb caused upregulation of protective heme-responsive genes in PT cells, altered expression of vitamin D hydroxylase CYP27B1 mRNA transcripts, and impaired vitamin D activation. In line with these findings, we observed a reduction in circulating levels of active 1,25(OH)2D in HbSS mice. Together, our studies suggest that chronically released Hb as a consequence of increased hemolysis in SCD patients may impair vitamin D reclamation and activation in the PT and may contribute to the vitamin D deficiency commonly observed in SCD patients.
The effect of Hb on DBP uptake was profound and similar to the inhibition of albumin uptake by Hb that we previously reported (14). Furthermore, the concentration of Hb that half-maximally inhibited DBP uptake (0.8 µM) is close to its estimated chronic tubular concentration in patients (0.6 µM) (25, 28). Thus, Hb competition for DBP uptake may result in continuous excretion of filtered DBP into the urine. By contrast, uptake of RBP was inhibited only slightly even at very high Hb concentrations (20 µM). Unlike Hb, DBP, and albumin, which are almost entirely α-helical in structure, RBP is comprised primarily of β-sheets. The difference in Hb inhibition of DBP versus RBP recovery by PT cells could explain why vitamin D deficiency appears to be more prevalent than vitamin A deficiency in SCD patients (21, 30, 35).
In addition to inhibiting DBP uptake, we found that prolonged exposure to Hb led to potent upregulation of the HO-1-encoding gene HMOX1, which is suggestive of a compensatory mechanism to limit ongoing ROS generation by intracellular heme, which in turn has been associated with impaired vitamin D processing by PT cells (12, 41, 45). We measured a selective increase in CYP27B1 mRNA (but not protein) expression in cells exposed to both high and low concentrations of Hb. However, despite the unchanged protein expression, activation of vitamin D by CYP27B1 was impaired. Whereas Hb treatment had no effect on access to DBP-free 25(OH)D in PT cells, the corresponding production of 1,25(OH)2D formed was reduced. Thus, the reduction in vitamin D activation may be a result of Hb induction of HMOX1, as its gene product HO-1 degrades heme groups and is known to reduce the activity of CYP family proteins, including vitamin D hydroxylases (2, 12, 45).
Congruent with a reduced 1,25(OH)2D:25(OH)D ratio in PT cells in culture, measurements in a small number of mice revealed that HbSS-Townes mice have significantly lower circulating levels of 1,25(OH)2D compared with HbAA controls. By contrast, circulating 25(OH)D levels in HbSS mice were slightly higher than in controls. The increase in circulating 25(OH)D in HbSS mice is unexpected and could be due to extrarenal effects. For example, changes in liver function or health may cause alteration of circulating 25(OH)D levels, as this is the primary location for 25-hydroxylation of vitamin D (8). Alternatively, differences in dietary uptake and/or vitamin D handling could also lead to differences in 25(OH)D concentrations. Nevertheless, the discordant changes in 25(OH)D versus 1,25(OH)2D concentrations in HbSS mice suggest an issue with PT vitamin D activation. More detailed studies using a larger and well-matched cohort of mice are needed to confirm our initial observations and elucidate potential extrarenal contributions to circulating 25(OH)D levels.
Low vitamin D status is associated with several SCD comorbidities, including vaso-occlusive crisis (13, 31), suggesting an important role for vitamin D maintenance in the deterrence of disease progression. In addition to its many other roles, vitamin D signaling modulates pro- and anti-inflammatory cytokines to suppress inflammatory responses and could help to reduce inflammation in SCD patients. Indeed, vitamin D supplementation has already been demonstrated to be useful in the treatment of inflammation in other diseases, including acute congestive cardiac failure and autoimmune cytopenias (16, 36). However, vitamin D supplementation is difficult in SCD patients compared with otherwise healthy, vitamin D-deficient individuals, and SCD patients generally need a higher dose to reach sufficiency (3, 43).
Our data connecting kidney disease, particularly PT dysfunction, and vitamin D deficiency in SCD have translational implications for the treatment of patients. Because reduced 1,25(OH)2D, but not 25(OH)D, levels were observed in both cell culture and mouse models of SCD, quantifying both 25(OH)D and 1,25(OH)2D metabolites in SCD patients [rather than solely 25(OH)D, as is frequently done] could provide a more accurate assessment of vitamin D status. Additionally, given the Hb-induced impairment in activation of vitamin D we observed, standard supplementation regimens may be suboptimal, and 1,25(OH)2D supplementation in addition to or in place of prohormone vitamin D should be considered. Finally, assessment of circulating 1,25(OH)2D:25(OH)D ratios may prove to be a useful biomarker for the onset of kidney disease, as PT dysfunction is a common early symptom of SCD nephropathy (37).
Our studies indicate that impeding the interaction of Hb with megalin/cubilin receptors may be a useful therapeutic approach in the prevention of both vitamin D deficiency and tubular proteinuria in SCD patients. Thus, understanding the molecular basis of Hb competition would help identify therapeutic compounds that selectively target the interaction of Hb with megalin/cubilin receptors. Our data suggest that Hb competes selectively for uptake with highly α-helical proteins, and further analysis of protein structural similarities/dissimilarities may be useful in elucidating possible therapeutic target sites. We have also developed a dual fluorescence screen that we plan to use in testing potential therapeutic compounds. Although it may be difficult to selectively inhibit Hb uptake by cells due to likely similarities in binding domains with proteins like albumin and DBP, compounds that could inhibit all endocytic uptake may still be useful to preserve PT cell health during hemolytic crisis when high concentrations of Hb are entering the tubule lumen.
GRANTS
This work was supported by NIH Grants R01 DK101484, DK100357, and DK118726 (to O. A. Weisz), K01 HL133331 (to D. A. Vitturi), and T32 DK061296 and TL1 TR001858 (to M. L. Gliozzi). We are grateful for access to the cores of the Pittsburgh Center for Kidney Research funded by NIH Grant P30 DK079307 and to support from the University of Pittsburgh Vascular Medicine Institute, the Hemophilia Center of Western Pennsylvania, and the Institute for Transfusion Medicine.
DISCLOSURES
No conflicts of interest, financial or otherwise, are declared by the authors.
AUTHOR CONTRIBUTIONS
M.L.G. and O.A.W. conceived and designed research; M.L.G., Y.R., K.R.L., and D.V. performed experiments; M.L.G. and O.A.W. analyzed data; M.L.G. and O.A.W. interpreted results of experiments; M.L.G. and O.A.W. prepared figures; M.L.G. and O.A.W. drafted manuscript; M.L.G., K.R.L., and O.A.W. edited and revised manuscript; M.L.G., Y.R., K.R.L., D.V., and O.A.W. approved final version of manuscript.
ACKNOWLEDGMENTS
We are very grateful to Dr. Solomon-Ofori Acquah for providing plasma from Townes sickle cell knockout-transgenic SS mice and AA littermates and to David Finegold for helpful discussions.
REFERENCES
- 1.Alvarez O, Montane B, Lopez G, Wilkinson J, Miller T. Early blood transfusions protect against microalbuminuria in children with sickle cell disease. Pediatr Blood Cancer 47: 71–76, 2006. doi: 10.1002/pbc.20645. [DOI] [PubMed] [Google Scholar]
- 2.Anwar-Mohamed A, Elbekai RH, El-Kadi AO. MG-132 inhibits the TCDD-mediated induction of Cyp1a1 at the catalytic activity but not the mRNA or protein levels in Hepa 1c1c7 cells. Toxicol Lett 182: 121–126, 2008. doi: 10.1016/j.toxlet.2008.09.007. [DOI] [PubMed] [Google Scholar]
- 3.Bordbar MR, Haghpanah S, Zarei T, Dabbaghmanesh MH, Omrani GR, Saki F. Evaluation of bone mineral density in children with sickle-cell anemia and its associated factors in the south of Iran: a case-control study. Arch Osteoporos 12: 70, 2017. doi: 10.1007/s11657-017-0364-x. [DOI] [PubMed] [Google Scholar]
- 4.Breusing N, Grune T. Regulation of proteasome-mediated protein degradation during oxidative stress and aging. Biol Chem 389: 203–209, 2008. doi: 10.1515/BC.2008.029. [DOI] [PubMed] [Google Scholar]
- 5.Charlton JR, Harer MW, Swan C, Nielsen R. Immature megalin expression in the preterm neonatal kidney is associated with urinary loss of vitamin carrier proteins. Pediatr Res 85: 405–411, 2019. doi: 10.1038/s41390-018-0261-z. [DOI] [PubMed] [Google Scholar]
- 6.Chesney RW. Interactions of vitamin D and the proximal tubule. Pediatr Nephrol 31: 7–14, 2016. doi: 10.1007/s00467-015-3050-5. [DOI] [PubMed] [Google Scholar]
- 7.Chevalier RL. The proximal tubule is the primary target of injury and progression of kidney disease: role of the glomerulotubular junction. Am J Physiol Renal Physiol 311: F145–F161, 2016. doi: 10.1152/ajprenal.00164.2016. [DOI] [PMC free article] [PubMed] [Google Scholar]
- 8.Christakos S, Dhawan P, Verstuyf A, Verlinden L, Carmeliet G. Vitamin D: Metabolism, Molecular Mechanism of Action, and Pleiotropic Effects. Physiol Rev 96: 365–408, 2016. doi: 10.1152/physrev.00014.2015. [DOI] [PMC free article] [PubMed] [Google Scholar]
- 9.Christensen EI, Birn H, Storm T, Weyer K, Nielsen R. Endocytic receptors in the renal proximal tubule. Physiology (Bethesda) 27: 223–236, 2012. doi: 10.1152/physiol.00022.2012. [DOI] [PubMed] [Google Scholar]
- 10.Christensen EI, Moskaug JO, Vorum H, Jacobsen C, Gundersen TE, Nykjaer A, Blomhoff R, Willnow TE, Moestrup SK. Evidence for an essential role of megalin in transepithelial transport of retinol. J Am Soc Nephrol 10: 685–695, 1999. [DOI] [PubMed] [Google Scholar]
- 11.Chun RF, Peercy BE, Orwoll ES, Nielson CM, Adams JS, Hewison M. Vitamin D and DBP: the free hormone hypothesis revisited. J Steroid Biochem Mol Biol 144: 132–137, 2014. doi: 10.1016/j.jsbmb.2013.09.012. [DOI] [PMC free article] [PubMed] [Google Scholar]
- 12.Crivello JF. Oxidative stress limits vitamin D metabolism by bovine proximal tubule cells in vitro. Arch Biochem Biophys 262: 471–480, 1988. doi: 10.1016/0003-9861(88)90398-0. [DOI] [PubMed] [Google Scholar]
- 13.de Oliveira JF, Vicente NG, Santos JPP, Weffort VRS. Vitamin D in children and adolescents with sickle cell disease: an integrative review. Rev Paul Pediatr 33: 349–355, 2015. doi: 10.1016/j.rppede.2015.06.015. [DOI] [PMC free article] [PubMed] [Google Scholar]
- 14.Eshbach ML, Kaur A, Rbaibi Y, Tejero J, Weisz OA. Hemoglobin inhibits albumin uptake by proximal tubule cells: implications for sickle cell disease. Am J Physiol Cell Physiol 312: C733–C740, 2017. doi: 10.1152/ajpcell.00021.2017. [DOI] [PMC free article] [PubMed] [Google Scholar]
- 15.Eshbach ML, Weisz OA. Receptor-Mediated Endocytosis in the Proximal Tubule. Annu Rev Physiol 79: 425–448, 2017. doi: 10.1146/annurev-physiol-022516-034234. [DOI] [PMC free article] [PubMed] [Google Scholar]
- 16.Fattizzo B, Zaninoni A, Giannotta JA, Binda F, Cortelezzi A, Barcellini W. Reduced 25-OH vitamin D in patients with autoimmune cytopenias, clinical correlations and literature review. Autoimmun Rev 15: 770–775, 2016. doi: 10.1016/j.autrev.2016.03.015. [DOI] [PubMed] [Google Scholar]
- 17.Gburek J, Verroust PJ, Willnow TE, Fyfe JC, Nowacki W, Jacobsen C, Moestrup SK, Christensen EI. Megalin and cubilin are endocytic receptors involved in renal clearance of hemoglobin. J Am Soc Nephrol 13: 423–430, 2002. [DOI] [PubMed] [Google Scholar]
- 18.Ghosh S, Tan F, Yu T, Li Y, Adisa O, Mosunjac M, Ofori-Acquah SF. Global gene expression profiling of endothelium exposed to heme reveals an organ-specific induction of cytoprotective enzymes in sickle cell disease. PLoS One 6: e18399, 2011. doi: 10.1371/journal.pone.0018399. [DOI] [PMC free article] [PubMed] [Google Scholar]
- 19.Kasztan M, Fox BM, Lebensburger JD, Hyndman KA, Speed JS, Pollock JS, Pollock DM. Hyperfiltration predicts long-term renal outcomes in humanized sickle cell mice. Blood Adv 3: 1460–1475, 2019. doi: 10.1182/bloodadvances.2018028878. [DOI] [PMC free article] [PubMed] [Google Scholar]
- 20.Kato GJ, Piel FB, Reid CD, Gaston MH, Ohene-Frempong K, Krishnamurti L, Smith WR, Panepinto JA, Weatherall DJ, Costa FF, Vichinsky EP. Sickle cell disease. Nat Rev Dis Primers 4: 18010, 2018. doi: 10.1038/nrdp.2018.10. [DOI] [PubMed] [Google Scholar]
- 21.Kuvibidila SR, Gardner R, Velez M, Warrier R. Clinical observations, plasma retinol concentrations, and in vitro lymphocyte functions in children with sickle cell disease. Ochsner J 18: 308–317, 2018. doi: 10.31486/toj.17.0044. [DOI] [PMC free article] [PubMed] [Google Scholar]
- 22.Long KR, Shipman KE, Rbaibi Y, Menshikova EV, Ritov VB, Eshbach ML, Jiang Y, Jackson EK, Baty CJ, Weisz OA. Proximal tubule apical endocytosis is modulated by fluid shear stress via an mTOR-dependent pathway. Mol Biol Cell 28: 2508–2517, 2017. doi: 10.1091/mbc.e17-04-0211. [DOI] [PMC free article] [PubMed] [Google Scholar]
- 23.Lonsdorfer A, Comoe L, Yapo AE, Lonsdorfer J. Proteinuria in sickle cell trait and disease: an electrophoretic analysis. Clin Chim Acta 181: 239–248, 1989. doi: 10.1016/0009-8981(89)90229-5. [DOI] [PubMed] [Google Scholar]
- 24.Marsenic O, Couloures KG, Wiley JM. Proteinuria in children with sickle cell disease. Nephrol Dial Transplant 23: 715–720, 2008. doi: 10.1093/ndt/gfm858. [DOI] [PubMed] [Google Scholar]
- 25.Monke JV, Yuile CL. The renal clearance of hemoglobin in the dog. J Exp Med 72: 149–165, 1940. doi: 10.1084/jem.72.2.149. [DOI] [PMC free article] [PubMed] [Google Scholar]
- 26.Nath KA, Grande JP, Haggard JJ, Croatt AJ, Katusic ZS, Solovey A, Hebbel RP. Oxidative stress and induction of heme oxygenase-1 in the kidney in sickle cell disease. Am J Pathol 158: 893–903, 2001. doi: 10.1016/S0002-9440(10)64037-0. [DOI] [PMC free article] [PubMed] [Google Scholar]
- 27.Nath KA, Hebbel RP. Sickle cell disease: renal manifestations and mechanisms. Nat Rev Nephrol 11: 161–171, 2015. doi: 10.1038/nrneph.2015.8. [DOI] [PMC free article] [PubMed] [Google Scholar]
- 28.Naumann HN, Diggs LW, Barreras L, Williams BJ. Plasma hemoglobin and hemoglobin fractions in sickle cell crisis. Am J Clin Pathol 56: 137–145, 1971. doi: 10.1093/ajcp/56.2.137. [DOI] [PubMed] [Google Scholar]
- 29.Nielsen R, Christensen EI. Proteinuria and events beyond the slit. Pediatr Nephrol 25: 813–822, 2010. doi: 10.1007/s00467-009-1381-9. [DOI] [PubMed] [Google Scholar]
- 30.Nolan VG, Nottage KA, Cole EW, Hankins JS, Gurney JG. Prevalence of vitamin D deficiency in sickle cell disease: a systematic review. PLoS One 10: e0119908, 2015. [Erratum in: PLoS One 10: e0128853, 2015.] doi: 10.1371/journal.pone.0119908. [DOI] [PMC free article] [PubMed] [Google Scholar]
- 31.Osunkwo I, Hodgman EI, Cherry K, Dampier C, Eckman J, Ziegler TR, Ofori-Acquah S, Tangpricha V. Vitamin D deficiency and chronic pain in sickle cell disease. Br J Haematol 153: 538–540, 2011. doi: 10.1111/j.1365-2141.2010.08458.x. [DOI] [PubMed] [Google Scholar]
- 32.Ratliff BB, Abdulmahdi W, Pawar R, Wolin MS. Oxidant mechanisms in renal injury and disease. Antioxid Redox Signal 25: 119–146, 2016. doi: 10.1089/ars.2016.6665. [DOI] [PMC free article] [PubMed] [Google Scholar]
- 33.Reeder BJ, Wilson MT. Hemoglobin and myoglobin associated oxidative stress: from molecular mechanisms to disease States. Curr Med Chem 12: 2741–2751, 2005. doi: 10.2174/092986705774463021. [DOI] [PubMed] [Google Scholar]
- 34.Ryan TM, Ciavatta DJ, Townes TM. Knockout-transgenic mouse model of sickle cell disease. Science 278: 873–876, 1997. doi: 10.1126/science.278.5339.873. [DOI] [PubMed] [Google Scholar]
- 35.Schall JI, Zemel BS, Kawchak DA, Ohene-Frempong K, Stallings VA. Vitamin A status, hospitalizations, and other outcomes in young children with sickle cell disease. J Pediatr 145: 99–106, 2004. doi: 10.1016/j.jpeds.2004.03.051. [DOI] [PubMed] [Google Scholar]
- 36.Schleithoff SS, Zittermann A, Tenderich G, Berthold HK, Stehle P, Koerfer R. Vitamin D supplementation improves cytokine profiles in patients with congestive heart failure: a double-blind, randomized, placebo-controlled trial. Am J Clin Nutr 83: 754–759, 2006. doi: 10.1093/ajcn/83.4.754. [DOI] [PubMed] [Google Scholar]
- 37.Sundaram N, Bennett M, Wilhelm J, Kim MO, Atweh G, Devarajan P, Malik P. Biomarkers for early detection of sickle nephropathy. Am J Hematol 86: 559–566, 2011. doi: 10.1002/ajh.22045. [DOI] [PMC free article] [PubMed] [Google Scholar]
- 38.Szczepanska M, Zaniew M, Recker F, Mizerska-Wasiak M, Zaluska-Lesniewska I, Kilis-Pstrusinska K, Adamczyk P, Zawadzki J, Pawlaczyk K, Ludwig M, Sikora P. Dent disease in children: diagnostic and therapeutic considerations. Clin Nephrol 84: 222–230, 2015. doi: 10.5414/CN108522. [DOI] [PubMed] [Google Scholar]
- 39.Tejero J, Shiva S, Gladwin MT. Sources of Vascular Nitric Oxide and Reactive Oxygen Species and Their Regulation. Physiol Rev 99: 311–379, 2019. doi: 10.1152/physrev.00036.2017. [DOI] [PMC free article] [PubMed] [Google Scholar]
- 40.Thom CS, Dickson CF, Gell DA, Weiss MJ. Hemoglobin variants: biochemical properties and clinical correlates. Cold Spring Harb Perspect Med 3: a011858, 2013. doi: 10.1101/cshperspect.a011858. [DOI] [PMC free article] [PubMed] [Google Scholar]
- 41.Wang L, Gao Z, Wang L, Gao Y. Upregulation of nuclear factor-κB activity mediates CYP24 expression and reactive oxygen species production in indoxyl sulfate-induced chronic kidney disease. Nephrology (Carlton) 21: 774–781, 2016. doi: 10.1111/nep.12673. [DOI] [PubMed] [Google Scholar]
- 42.Willnow TE, Nykjaer A. Pathways for kidney-specific uptake of the steroid hormone 25-hydroxyvitamin D3. Curr Opin Lipidol 13: 255–260, 2002. doi: 10.1097/00041433-200206000-00004. [DOI] [PubMed] [Google Scholar]
- 43.Wykes C, Arasaretnam A, O’Driscoll S, Farnham L, Moniz C, Rees DC. Vitamin D deficiency and its correction in children with sickle cell anaemia. Ann Hematol 93: 2051–2056, 2014. doi: 10.1007/s00277-014-2144-7. [DOI] [PubMed] [Google Scholar]
- 44.Zehnder D, Quinkler M, Eardley KS, Bland R, Lepenies J, Hughes SV, Raymond NT, Howie AJ, Cockwell P, Stewart PM, Hewison M. Reduction of the vitamin D hormonal system in kidney disease is associated with increased renal inflammation. Kidney Int 74: 1343–1353, 2008. doi: 10.1038/ki.2008.453. [DOI] [PMC free article] [PubMed] [Google Scholar]
- 45.Zordoky BN, El-Kadi AO. Role of NF-kappaB in the regulation of cytochrome P450 enzymes. Curr Drug Metab 10: 164–178, 2009. doi: 10.2174/138920009787522151. [DOI] [PubMed] [Google Scholar]