

SUMMARY
The adaptor protein CARD9 links detection of fungi by surface receptors to the activation of the NF-κB pathway. Mice deficient in CARD9 exhibit dysbiosis and are more susceptible to colitis. Here we examined the impact of Card9 deficiency in the development of colitis-associated colon cancer (CAC). Treatment of Card9−/−mice with AOM-DSS resulted in increased tumor loads as compared to WT mice and in the accumulation of myeloid-derived suppressor cells (MDSCs) in tumor tissue. The impaired fungicidal functions of Card9−/− macrophages led to increased fungal loads and variation in the overall composition of the intestinal mycobiota, with a notable increase in C. tropicalis. Bone marrow cells incubated with C. tropicalis exhibited MDSC features and suppressive functions. Fluconazole treatment suppressed CAC in Card9−/− mice and was associated with decreased MDSC accumulation. The frequency of MDSCs in tumor tissues of colon cancer patients correlated positively with fungal burden, pointing to the relevance of this regulatory axis in human disease.
In Brief
The adaptor protein CARD9 plays a crucial role in anti-fungal immunity, linking detection of fungi by surface receptors to the activation of the NF-κB pathway. Wang et al. show that Card9−/− mice are more susceptible to colitis-associated cancer and outline a mechanism whereby fungal dysbiosis increases the frequency of myeloid-derived suppressor cells, thus contributing to tumorigenesis.
Graphical Abstract
INTRODUCTION
Colorectal cancer (CRC) is the third most common cancer and the third leading cause of death in the world (Arnold et al., 2017). Chronic inflammation is thought to play a crucial role in the development of CRC (Arthur et al., 2012; Lasry et al., 2016). Patients with inflammatory bowel disease (IBD) have increased risk of developing CRC (Gupta et al., 2007; Rutter et al., 2004). Therefore, targeting the link between chronic inflammation and tumor development may offer new therapies to prevent cancer.
The mammalian gastrointestinal tract is colonized with multiple microbial communities, including bacteria, fungi, and viruses. The gut microbiota shape the adaptive and innate immune systems, which can regulate the pathogenesis of intestinal and systemic disease (Kaiko and Stappenbeck, 2014; Round and Mazmanian, 2009). By comparing the composition of intestinal microbes of healthy individuals (Qin et al., 2010; Turnbaugh et al., 2007) with that of colitis patients (Macfarlane et al., 2009; Willing et al., 2010), it is clear that the gut microbiome actively participates in the process of IBD (Bäumler and Sperandio, 2016; Garrett et al., 2010). As for carcinogenesis, the presence of Helicobacter pylori infection is a well-known inducer of gastric cancers. A previous study reveals the existence of 819 kinds of microbes in colon tumor and normal feces (Sobhani et al., 2011). A series of microbial-gut-swapping tests prove that bacteria are required for the development of colon cancer (Arthur et al., 2012, 2014). Although most studies of commensal microbes have focused on bacteria, commensal fungi have been reported (Scupham et al., 2006) and linked with several gastrointestinal diseases including IBD (Ott et al., 2008), irritable bowel syndrome (Santelmann and Howard, 2005), and chemotherapy-induced enteric disorders (Stringer et al., 2009). The gastrointestinal tract of healthy individuals contains several fungal genera, with Candida being the dominant genus (Mukherjee et al., 2015). Certain levels of fungi can shape our mammalian immunity (Brown, 2010). However, these fungi are conditionally pathogenic in a specific environment, such as a suppressed immune system or a reduced population of bacteria. A colitis mouse model shows that dextran sodium sulfate (DSS) treatment allows pathogenic fungi to translocate and that Dectin-1 has a protective role in colitis (Iliev et al., 2012). However, the functional role of commensal fungal microbiota in the development of CRC is still unknown.
The adaptor protein Caspase Recruitment Domain-containing protein 9 (CARD9) is restrictedly expressed in myeloid cells (Hara et al., 2007; Hsu et al., 2007; Nakamura et al., 2005). Multiple pattern recognition receptors (PPRs) of the C-type lectin receptor (CLR) including Dectin-1, Dectin-2, Dectin-3, and Mincle require CARD9 for the activation of innate immunity (Bi et al., 2010; Gross et al., 2006; Jia et al., 2014; Robinson et al., 2009; Saijo et al., 2007; Schoenen et al., 2010; Zhao et al., 2014). CARD9-deficient (Card9−/−) mice are susceptible to infection with Candida albicans and Listeria monocytogenes (Gross et al., 2006; Hara et al., 2007; Hsu et al., 2007). Card9 can form a complex with B cell leukemia-lymphoma 10 (Bcl10) and with mucosa-associated lymphoid tissue (Malt1), activating NF-κB signaling (Drummond and Brown, 2011; Kingeter and Lin, 2012). Card9−/− mice have more severe DSS-induced colitis than wild-type (WT) mice (Sokol et al., 2013). Genome-wide association studies (GWASs) in IBD patients identified association of CARD9 polymorphisms with Crohn’s disease and ulcerative colitis (Beaudoin et al., 2013; Rivas et al., 2011). CARD9 impacts colitis by altering the composition and function of gut microbiota (Lamas et al., 2016). Transferring microbiota from Card9−/− mice to WT, germ-free recipients increases their susceptibility to colitis, thus supporting the notion that CARD9-mediated dysbiosis facilitates the development of colitis. Whereas CARD9 deficiency has been associated with increased susceptibility to colitis and by GWASs to CRC, the mechanisms involved are incompletely understood.
Myeloid-derived suppressor cells (MDSCs) are a heterogeneous group of immature myeloid cells, which can promote immune suppression and facilitate tumor development (Gabrilovich and Nagaraj, 2009). In mice, MDSCs are characterized as Gr-1+ and CD11b+ cells. The immunosuppressive activity of these cells is associated with high levels of arginase, nitric oxide, reactive oxygen species (ROS), prostaglandin E2, and cytokines. MDSCs are comprised of two groups of cells with either a monocytic (M-MDSCs) or a neutrophilic (G-MDSCs) morphology (Youn et al., 2008). Several transcription factors, including STAT3 and IRF8, have been implicated in MDSC expansion (Condamine and Gabrilovich, 2011; Sonda et al., 2011).
In this study, we investigated the contribution of CARD9-dependent innate immunity on the development of CAC. We found that Card9−/− mice display increased colitis-associated colon cancer. CARD9-deficient macrophages showed impaired fungicidal abilities, which led to increased fungi, especially C. tropicalis, in the gut, and we found that commensal fungal disorders can promote the development of CAC. The increased fungi induced MDSC accumulation and promoted the development of CAC, while antifungal treatment ameliorated CAC in Card9−/− mice.
RESULTS
Card9−/− Mice Have Increased Tumor Burden upon AOM-DSS Treatment Compared to WT Mice
Card9−/− mice (Hsu et al., 2007) were used after backcrossing for nine generation to C57BL/6J mice. To avoid crosstalk of fecal microbiota, WT mice and Card9−/− mice were separated at least 4 weeks before use and throughout the experiments. Mice were injected intraperitoneally with one dose of azoxymethane (AOM), followed by three cycles of feeding water with DSS (2%) (Figure S1A). AOM is a potent carcinogen that can induce p53-dependent apoptosis in intestinal epithelial cells. DSS treatment causes epithelial injury and subsequent colonic inflammation that drives epithelial dysplasia. After induction of tumorigenesis, mice were euthanized on day 100 and tumor was evaluated. As shown in Figures 1A and 1B, tumors occurred more frequently and tumor loads were heavier in Card9−/− mice than in WT mice. Histologically, most of the lesions were adenocarcinomas with various degrees of differentiation. In tumor-bearing Card9−/− mice, there were more low-grade adenocarcinomas with frequent invasion into submucosa and occasional invasion into muscularis propria (Figure 1C). The histological score of colon tissues was significantly higher in tumor-bearing Card9−/− mice than that in tumor-bearing WT mice (Figure 1D). Also, spleens were significantly enlarged in tumor-bearing Card9−/− mice as compared to their WT counterparts (Figures S1B and S1C).
Figure 1. Card9−/− Mice Have Increased Tumor Burden upon AOM-DSS Treatment than WT Mice.

WT mice and Card9−/− mice (n = 5 for each group) were separated at least 4 weeks before use and throughout the experiments. To develop CAC model, mice were injected intraperitoneally with one dose of AOM (10 mg/kg), followed by three cycles of feeding water with 2% DSS. After induction of tumorigenesis, mice were euthanized on day 100 and colons were removed from each mouse.
(A) Representative images of colon tumors were shown.
(B) Tumor number, tumor size, and tumor load in each mouse was measured.
(C and D) Histological analysis of colon tumors was shown by hematoxylin and eosin (HE) staining. Tumors were microscopically analyzed and classified as low or high grade. Histological score was assessed by a pathologist.
(E and F) Tumor tissues were stained for PCNA and COX-2. The percentages of PCNA-positive and COX-2-positive tumor cells were quantified.
(G) mRNA expressions of S100A9 and Arg-1 in LP cells from AOM-DSS-treated or untreated mice were detected using qPCR.
(H) mRNA expressions of IL-6 in LP cells from AOM-DSS-treated or untreated mice were detected using qPCR.
(I) Proportion of F4/80+ cells in colonic LP cells from tumor-bearing WT and Card9−/−mice was determined by flow cytometry.
Data with error bars are represented as mean ± SD. Each panel is a representative experiment of at least three independent biological replicates. Scale bars, 50 mm. *p < 0.05, **p < 0.01, ***p < 0.001 as determined by unpaired Student’s t test. See also Figures S1–S3.
We then conducted immunohistochemical analyses to detect cellular proliferation and apoptosis in colonic tumors. The percentages of proliferating cell nuclear antigen (PCNA)-positive cells and COX-2-positive cells were higher in tumor tissues of Card9−/− mice than in those of WT mice (Figures 1E and 1F). To identify genes that may be responsible for increased tumor in Card9−/− mice, we performed RNA-seq analysis to compare the colon transcriptomes in AOM-DSS-treated and untreated mice. The transcripts clustered according to genotype (Figure S1D). The most differentially expressed genes of colonic tissues from Card9−/− and WT mice were S100 calcium-binding protein A9 (S100A9) and arginase-1 (Arg-1) (Figure 1G), as confirmed by qPCR. KEGG analysis of mRNA transcripts revealed that genes differentially between tumor-bearing WT and Card9−/− mice could be categorized in 14 signal transduction pathways (Figure S1E), of which the “cytokine-cytokine receptor interaction” pathway was most significant. Expression, as detected by qPCR, of IL-6, Cxcl1, transforming growth factor-β (TGF-β), and Il-10 was increased in the colonic tissues of tumor-bearing Card9−/− mice compared with that in tumor-bearing WT mice, and expression of Il-17 was decreased (Figures 1H, S1F, and S1G). Similar results were found in mesenteric lymph nodes (mLNs) of tumor-bearing Card9−/− and WT mice (Figure S1H). We also detected cytokine and chemokine production in serum of tumor-bearing Card9−/− and WT mice using Multiplex assays. Systemic protein production of G-CSF, IL-1α, and KC were higher and the production of IFN-γ and IL-17a were lower in the serum of Card9−/− tumor-bearing mice than those in WT tumor-bearing mice. However, no differences were found in systemic production of IL-6, TNF-α, and IL-10 in serum when comparing AOM-DSS-treated WT and Card9−/− mice (Figure S2A).
Impaired Immune Responses in Card9−/− Mice during CAC Development
Innate and adaptive immune cells were detected in mLNs and colonic lamina propria (LP) of tumor-bearing mice (day 100). A higher number of macrophages (F4/80+ cells) were detected in colonic LP cells and mLNs of tumor-bearing Card9−/− mice than in tumor-bearing WT mice, whereas no differences in dendritic cell numbers were detected (Figures 1I, S2B, and S2C). The number of CD8+ and CD4+ T cells was decreased in mLNs and LP cells of tumor-bearing Card9−/− mice as compared to their WT counterparts, whereas the number of Treg cells (CD4+CD25+FoxP3+) was increased (Figures S2B and S2C). Previous studies reported abnormal numbers of Th22 cells and NKp46+ cells in DSS-induced colitis models in Card9−/− mice (Lamas et al., 2016). However, we did not detect significant differences in the frequencies of Th22 cells and NKp46+ cells when comparing AOM-DSS-treated WT and Card9−/− mice (Figure S2B).
Since both AOM and DSS contribute to the development of CAC, we performed AOM alone and DSS alone experiments in mono-housed Card9−/− and WT mice. We monitored the number of tumors induced by AOM without DSS for 6 months and found no differences in tumor load, fungal burden, and bacterial burden between WT and Card9−/− mice (Figures S3A and S3B). Furthermore, by measuring p-P53 expression using western blot, γH2AX expression using flow cytometry, and cleaved-caspase 3 expression using IHC in tumor tissues, we found AOM-induced DNA damage and apoptosis were similar in tumors from WT and Card9−/− mice (Figures S3C–S3E), suggesting that the differences in tumorigenesis between mono-housed WT and Card9−/− mice were not due to the difference of initial response to AOM treatment in intestinal epithelial cells.
We then investigated the role of CARD9 in DSS-induced acute colitis, which is critical for AOM-DSS-induced tumorigenesis. Mono-housed WT and Card9−/− mice were given 2.5% DSS in the drinking water for 7 days and then were given regular drinking water until day 12. Card9−/− mice exhibited greater weight loss and shorter colon lengths than WT mice upon DSS treatment (Figures S3F and S3G). These data are consistent with previous study (Sokol et al., 2013). The expression of apoptosis-related genes Bcl2 and Noxa was increased in colon tissues of DSS-treated Card9−/− mice as compared to their WT counterparts, whereas expression of Xiap and Mcl-1, as measured by qPCR, was decreased (Figure S3H). In chronic colitis mouse model, mono-housed WT and Card9−/−mice were treated with three cycles of DSS without AOM and no tumor formation was found in WT and Card9−/−mice (Figure S3I). These data confirm that Card9−/− mice are more susceptible to DSS-induced colitis than WT mice. However, DSS-induced colitis was not sufficient to induce tumor development in these mice.
The Intestinal Microbiota Is Altered in Card9−/− Mice
To confirm the effect of microbiota on tumorigenesis, we did a CAC experiment using co-housed WT and Card9−/− mice. WT and Card9−/− mice were co-housed for at least 4 weeks before and throughout these experiments. Tumor loads showed no difference between co-housed Card9−/− and WT mice (Figure S3J), suggesting that endogenous microbiota plays critical role in the increased tumor-burden in mono-housed Card9−/− mice. Therefore, we explored the composition of microbiota in mono-housed Card9−/− and WT mice after induction of tumorigenesis. Mice were treated as stated in Figure 1. Feces were collected from each mouse on day 100. Fungal 18S rDNA and bacterial 16S rDNA were evaluated by using qPCR. The total fungal burden in feces was markedly higher in tumor-bearing Card9−/− mice than in tumor-bearing WT mice (Figure 2A), while the bacteria burden showed no difference (Figure S4A). We further analyzed the fungal microbiota in feces by using high-throughput internal transcribed spacer 2 (ITS2) sequencing. Compared with untreated mice, both WT and Card9−/− mice have increased operational taxonomic unit (OTU) numbers after induction of tumorigenesis (Figure 2B). However, no differences were observed regarding fungal biodiversity between tumor-bearing WT and Card9−/− mice based on alpha-diversity analysis using several different indexes (Table S1). Illustrative diagrams using principal component analysis (PCA) of feces showed that the principal component of fecal fungus in Card9−/− mice was altered after tumor induction, whereas it changed only slightly in WT mice (Figures 2C and 2D). The fungal microbiota was dominated by Ascomycota in tumor-bearing Card9−/− mice at day 100 (Figure 2E), in which the percentage of Candida showed a significant difference between tumor-bearing WT and Card9−/− mice (Figure 2F). Candida is proved to be the major intestinal fungal genus in colitis mice (Iliev et al., 2012). To figure out the specific species in Candida, we then quantified the specific burden of Candida (C. tropicalis, C. albicans, and C. glabrata) in feces by qPCR using specific primers. We found that C. tropicalis was increased and was the dominating fungus in tumor-bearing Card9−/− mice (Figures 2G and S4B). We also explored the bacterial composition in feces by using 16S ribosomal DNA sequencing. We found the composition of bacterial genera had no difference between tumor-bearing WT and Card9−/− mice by using alpha-diversity analysis, principal component analysis, and bacteria-taxon-based analysis (Figures S4C–S4F).
Figure 2. The Intestinal Microbiota Is Altered in Tumor-Bearing Card9−/− Mice.

Mice were treated as described in Figure 1 (n = 5 for each group). After induction of tumorigenesis (100 days), mice were euthanized and feces were collected from WT and Card9−/− mice.
(A) Total fungal burden in the feces of AOM-DSS-treated or untreated mice was quantified using 18S rDNA qPCR.
(B) Fungal ITS2 rDNA gene sequence was performed in each group. Fungal diversity in the feces of treated or untreated mice was determined by operational taxonomic unit (OTU) number and the rank curve.
(C) Three-dimensional (3D) principal component analysis (PCA) based on fungal ITS2 rDNA gene sequence abundance in the feces. x axis, principal components 1 (PC1); y axis, principal components 2 (PC2); z axis, principal components 3 (PC3); d, days.
(D) Two-dimensional (2D) principal component analysis (PCA) based on fungal ITS2 rDNA gene sequence abundance in the feces. x axis, principal components 1 (PC1); y axis, principal components 2 (PC2); d, days.
(E) Fungal-taxon-based analysis at the phylum level in feces of AOM-DSS-treated or untreated mice.
(F) Fungal-taxon-based analysis at the specie level in feces of tumor-bearing WT and Card9−/−mice.
(G) Proportion of C. tropicalis in feces of AOM-DSS-treated or untreated mice were quantified using qPCR.
Data with error bars are represented as mean ± SD. Each panel is a representative experiment of at least three biological replicates. *p < 0.05, **p < 0.01 as determined by unpaired Student’s t test. See also Figure S4.
To determine the impact of Card9 on the phagocytic and fungicidal abilities of macrophage, bone marrow-derived macrophages (BMDMs) were prepared from Card9−/− mice (Card9−/−-BMDMs) and WT control mice (WT-BMDMs) and were challenged with GFP-expressing C. tropicalis. Compared with WT-BMDMs, Card9−/−-BMDMs had a larger amount of fungal load. Colony-forming unit (CFU) assays demonstrated more viable yeasts recovered from Card9−/−-BMDMs (Figure S4G). These data suggest that Card9−/−-BMDMs have an impaired ability to limit the intracellular replication of C. tropicalis. This impaired fungal-killing ability was not due to phagocytosis, since BMDMs from WT and Card9−/− mice had similar phagocytosis abilities (Figure S4H), which is consistent with our previous study (Wu et al., 2009).
Microbiota from Tumor-Bearing Card9−/− Mice Increases CAC Development
To confirm the role of intestinal microbiota in CAC development, germ-free (GF) mice were gavaged with feces from tumor-bearing WT or Card9−/− mice during AOM-DSS treatment (Figure 3A). WT microbiota-receiving mice and Card9−/− microbiota-receiving mice were mono-housed during experiment and were euthanized on day 100. GF mice that received microbiota from tumor-bearing Card9−/− mice developed significantly more tumors, compared with mice received microbiota from tumor-bearing WT mice (Figure 3B). Fecal microbiota from tumor-bearing Card9−/− mice also induced tumors with higher extent of malignancy and more PCNA and COX-2 expressions, compared with those induced by fecal microbiota from tumor-bearing WT mice (Figures 3C and 3D). Feces were also collected from GF mice on day 100. GF mice that received Card9−/− microbiota had more total fungal burden, more proportion of C. tropicalis, and more colonic expressions of IL10 and TGF-β than those that received WT microbiota (Figures 3E–3G). These data suggested that the altered microbiota in Card9−/− mice, but not the lack of Card9 in recipient GF mice, was responsible for the increased CAC development. Furthermore, transferring WT feces to Card9−/− mice could partially protect mice from CAC development (Figure S5A).
Figure 3. Microbiota from the Tumor-Bearing Card9−/− Mouse Promotes CAC.

(A) GF mice were oral transferred with feces (400 μL each time, twice a week) from tumor-bearing WT and Card9−/− mice during administrated with AOM-DSS (n = 5, each group). After induction of tumorigenesis (100 days), mice were euthanized and colons were removed.
(B) Tumor number, tumor size, and tumor load in colons were measured.
(C) Histological colon tumor images using H&E staining. Histological score was assessed by a pathologist.
(D) Tumor tissues were stained for PCNA and COX-2. The percentages of PCNA-positive and COX-2-positive tumor cells were quantified.
(E) Feces were collected from mice on day 100. Total fungal burden in feces were quantified using 18S rDNA qPCR.
(F) Proportions of C. tropicalis in the feces were quantified using qPCR.
(G) mRNA expressions of IL-10 and TGF-β in LP cells were detected using qPCR.
(H) GF mice were orally gavaged with C. tropicalis (twice a week, 1 × 10⁷) during administration with AOM-DSS (n = 5, each group). After induction of tumorigenesis (100 days), mice were euthanized.
(I) Tumor number, tumor size, and tumor load in colons were measured.
Data with error bars are represented as mean ± SD. Each panel is a representative experiment of at least three independent biological replicates. Scale bars, 50 mm. *p < 0.05, **p < 0.01, ***p < 0.001 as determined by unpaired Student’s t test. See also Figures S5 and S6.
To confirm the role of C. tropicalis, we mono-colonized GF mice with C. tropicalis (1 × 10⁷ yeast/mouse/dose, twice a week) during AOM-DSS administration (Figure 3H). After induction of tumorigenesis (100 days), these ex-GF mice monocolonized with C. tropicalis developed significantly heavier tumor burden and more fungal burden than GF control mice (Figures 3I and S5B). Bacteria burden was undectectable pre-colonization and after C. tropicalis colonization in GF mice. For comparison, we mono-colonized GF mice with another fungi, S. fibuligera (1 × 10⁷ yeast/mouse/dose, twice a week) during AOM-DSS administration. S. fibuligera supplementation did not contribute to CAC pathology, although the total fungal burden was also increased (Figures S5C–S5E). We then explored the role of C. tropicalis in acute colitis model. Mice were gavaged with C. tropicalis (1 × 10⁷ yeast/mouse/dose) for 7 days followed by DSS (2.5%) treatment for 7 days (Figure S6A). Body weight of Card9−/− mice given C. tropicalis and DSS decreased by 20% at day 15 (Figure S6A). More severe pathological changes and increased expression of COX-2 were found in the C. tropicalis-supplemented group in Card9−/− colitis mice (Figures S6B–S6D). C. tropicalis colonization led to increased fungal burden in Card9−/− colitis mice (Figure S6E), while it had no effect on bacteria burden (Figure S6F). Since Card9-deficient macrophages are impaired in fungicidal abilities of C. tropicalis, it suggests that Card9 deficiency results in the increased C. tropicalis in gut, which leads to the high susceptibility to inflammation-associated colitis and CAC.
C. tropicalis Induced MDSC Differentiation and Activated MDSC Function
We next investigated the mechanism by which C. tropicalis promotes CAC. Mice were treated as stated in Figures 1A and 3A. Colon tissues were acquired and LP lymphocytes were isolated on day 100. Using flow cytometry, we found that the proportion of MDSCs (Gr1+CD11b+ cells) were significantly expanded in colonic LP lymphocytes in tumor-bearing Card9−/− mice compared with those cells in WT mice (Figures 4A and S7A). More colonic MDSCs, especially more G-MDSCs (CD11b+Ly6G+ cells), were accumulated in GF mice that received microbiota from Card9−/− mice compared with those GF mice received microbiota from WT mice (Figures 4A and 4B). Similar results were observed in mLN tissues (Figure S7B). We also detected the immunosuppressive function of MDSCs. Primary MDSCs from tumor-bearing Card9−/− mice had significantly higher suppressive ability on CD8+ T cells or CD4+ T cells than those from tumor-bearing WT mice (Figures 4C and S7C). Of note, the expressions of S100A9 and Arg-1, two proteins that have been reported to be critical for the inhibitory effect of MDSCs, were significantly increased in tumor-bearing Card9−/− mice and GF mice that received microbiota from Card9−/− mice (Figure 4D). MDSCs (Gr1+CD11b+ cells) were also recruited and activated in GF mice after C. tropicalis colonization (Figures S7D and S7E), as detected by flow cytometry. Similar results were found in the expression of Il-10 and TGF-β (Figure S7F), as detected by qPCR. To confirm the role of G-MDSCs in the development of CAC, anti-Ly6G antibody was administrated to mono-housed WT and Card9−/− mice during AOM-DSS treatment (Figure 4E). Mice were euthanized on day 100 and feces were collected. Although anti-Ly6G treatment did not affect fungal burden in tumor-bearing mice (Figures S7G and S7H), the proportion of G-MDSCs were significantly decreased in both tumor-bearing WT and Card9−/− mice after anti-Ly6G treatment (Figure 4F). Tumor loads and histological malignance scores were decreased in tumor-bearing Card9−/− mice after anti-Ly6G treatment (Figures 4G and 4H), suggesting the effect of G-MDSCs on increased tumor burden in Card9−/− mice.
Figure 4. MDSCs Are Accumulated and Activated in Card9−/− Mice.

(A) Mice were treated as described in Figures 1A and 3A. Colon tissues were acquired on day 100 and LP cells were isolated. The proportions of MDSCs (Gr1+CD11b+) were determined by flow cytometry.
(B) The proportions of M-MDSCs (CD11b+Ly6C+) and G-MDSCs (CD11b+Ly6G+) were determined by flow cytometry.
(C) Primary MDSCs were isolated from LP cells in tumor-bearing WT and Card9−/− mice or tumor-bearing GF mice. Primary MDSCs were co-cultured with CD8+ T cells. The suppressive function of MDSCs was determined by [3H] thymidine incorporation.
(D) The mRNA expression of S100A9 and Arg-1 in LP cells of tumor-bearing WT and Card9−/− mice or tumor-bearing GF mice were detected by qPCR.
(E) WT and Card9−/− mice were intraperitoneally treated with anti-Ly6G antibody (200 μg, once every 4 days) or anti-IgG antibody as control during AOM-DSS administration (n = 5 each group). Colon tissues were acquired on day 100 and LP cells were isolated.
(F) The proportions of G-MDSCs (CD11b+Ly6G+) in LP cells were determined by flow cytometry.
(G) Tumor number, tumor size, and tumor load in colons were measured in mice after anti-Ly6G or anti-IgG treatment.
(H) Histological score was assessed by a pathologist.
Data with error bars are represented as mean ± SD. Each panel is a representative experiment of at least three independent biological replicates. *p < 0.05, **p < 0.01, ***p < 0.001 as determined by unpaired Student’s t test. See also Figure S7.
We then performed an in vitro experiment to confirm that C. tropicalis can induce MDSC differentiation. Bone marrow cells obtained from WT mice were stimulated with C. tropicalis for 6 days. C. tropicalis stimulation lead to increased MDSCs (Gr1+CD11b+ cells), especially increased G-MDSCs (CD11b+Ly6G+ cells) during cell differentiation (Figures 5A and 5B). Stimulation with zymosan and mannans, two fungal cell wall components, can also increase MDSC differentiation and G-MDSC differentiation from bone marrow cells (Figures 5C–5E). When co-cultured with primary CD8+ T cells and CD4+ T cells, C. tropicalis-, zymosan-, and mannans-induced MDSCs had stronger immune suppressive ability than normal MDSCs (Figures 5F and 5G). Compared with non-stimulated cells, C. tropicalis-, zymosan-, and mannans-induced MDSCs had higher expressions of iNos and Arg-1 (Figure 5H).
Figure 5. C. tropicalis Induces MDSC Differentiation and Activates MDSC Function.

(A and B) Bone marrow cells from WT mice were stimulated with C. tropicalis (5 × 10⁶) for 6 days. The proportions of MDSCs (Gr1+CD11b+), M-MDSCs (CD11b+Ly6C+), and G-MDSCs (CD11b+Ly6G+) were determined by flow cytometry.
(C–E) Bone marrow cells from WT mice and Card9−/− mice were stimulated with zymosan and mannans for 6 days. The proportions of MDSCs (Gr1+CD11b+), M-MDSCs (CD11b+Ly6C+), and G-MDSCs (CD11b+Ly6G+) were determined by flow cytometry.
(F and G) Bone marrow cells from WT mice were stimulated with C. tropicalis (5 × 10⁶), zymosan, or mannans for 6 days and were co-cultured with CD8+ T or CD4+ T cells. The suppressive function of MDSCs was determined by [3H] thymidine incorporation.
(H) Bone marrow cells from WT mice were stimulated with C. tropicalis (5 × 10⁶), zymosan, or mannans for 6 days. mRNA expressions of iNOS and Arg-1 in cells were detected using qPCR.
Data with error bars are represented as mean ± SD. Each panel is a representative experiment of at least three independent biological replicates. *p < 0.05, **p < 0.01 as determined by unpaired Student’s t test.
Anti-fungal Treatment Ameliorates CAC in Card9−/− Mice
To explore the potential therapeutic role of anti-fungal treatment in Card9−/− mice, we suppressed fungal growth in mice via treatment with fluconazole. WT mice and Card9−/− mice were separated at least 4 weeks before use and throughout the experiments. Mice were treated with three cycles of fluconazole (0.5 mg/mL) in drinking water during DSS treatment. After induction of tumorigenesis, mice were euthanized on day 100 and feces were collected (Figure 6A). Fluconazole treatment significantly decreases fungal burden in Card9−/− mice (Figure 6B). Although fluconazole treatment could slightly increase bacteria burden in these mice, no significant difference of bacteria burden was found between tumor-bearing WT and Card9−/− mice (Figure 6B). Fluconazole treatment led to fewer numbers of tumor, reduced tumor burden, and decreased expression of PCNA and COX-2 in Card9−/− mice (Figures 6C–6F). In tumor-bearing Card9−/− mice, fewer MDSCs were found in fluconazole treatment group than in the non-treatment group (Figure 6G). Meanwhile, fluconazole treatment also reduced the expression of S100A9 and Arg-1 in the colon tissues of tumor-bearing Card9−/− mice (Figure 6H).
Figure 6. Anti-fungal Therapy Ameliorates CAC in Card9−/− Mice.

(A) WT mice and Card9−/− mice (n = 5 for each group) were separated at least 4 weeks before use and throughout the experiments. WT and Card9−/− mice were given three cycles of fluconazole (0.5 mg/mL) during AOM-DSS treatment. After induction of tumorigenesis (100 days), mice were euthanized and feces were collected.
(B) Total fungal burden and bacterial burden in feces of tumor-bearing WT and Card9−/− mice was quantified by using qPCR.
(C) Representative images of colon tumors.
(D and E) Tumor number and tumor load in each group were measured.
(F) Tumor tissues were stained for PCNA and COX-2. The percentages of PCNA-positive and COX-2-positive tumor cells were quantified.
(G) Proportion of MDSCs (Gr1+CD11b+) in colonic LP cells was calculated by flow cytometry.
(H) mRNA expression of S100A9 and Arg-1 in colonic LP cells was detected using qPCR.
Data with error bars are represented as mean ± SD. Each panel is a representative experiment of at least three independent biological replicates. *p < 0.05, **p < 0.01, ***p < 0.001 as determined by unpaired Student’s t test.
C. tropicalis Is Correlated with MDSC Proportion in Patients with Colon Cancer
In patients with CRC (n = 87), the total fungal burden was significantly increased compared to healthy subjects (n = 22, Figure 7A). Of note, the proportion of C. tropicalis was higher in CRC patients than healthy subjects, whereas the proportion of C. albicans showed no difference between CRC patients and healthy subjects (Figure 7B). These data compelled us to detect the anti-fungal ability in CRC patients. We divided our patients into two groups based on the fungal burden and detected the expressions of CARD9 in colon tissues of these patients. We found that the expression of CARD9 was significantly higher in the low fungal burden group than in the high fungal group (Figure 7C). Positive correlations were found between fecal fungal burden and MDSCs (CD11b+CD14−CD33+ cells) proportion in blood (R2 = 0.88, p < 0.01, Figure 7D) and between fecal fungal burden and MDSCs proportion in colon tissues (R2 = 0.47 p < 0.01, Figure 7E).
Figure 7. Fungal Burden Is Correlated with MDSC Proportion in Patients with Colon Cancer.

(A) Feces were collected from CRC patients (n = 87) and healthy subjects (n = 22). Total fungal burden in feces of was quantified using 18S rDNA qPCR.
(B) Proportion of C. tropicalis and C. albicans in human feces was determined by qPCR.
(C) Patients were divided into two groups based on fungal burden level. The mRNA expressions of CARD9 in colon tumor tissues were detected by qPCR.
(D) Correlation between fungal burden and proportion of MDSCs (CD11b+CD14−CD33+ cells) in colon tissues of patients with colon cancers.
(E) Correlation between fungal burden and proportion of MDSCs (CD11b+CD14−CD33+ cells) in PBMCs of patients with colon cancers.
Data with error bars are represented as mean ± SD. Each panel is a representative experiment of at least three independent repeats. **p < 0.01, ***p < 0.001 as determined by unpaired Student’s t test. Correlation significance was determined by using linear regression.
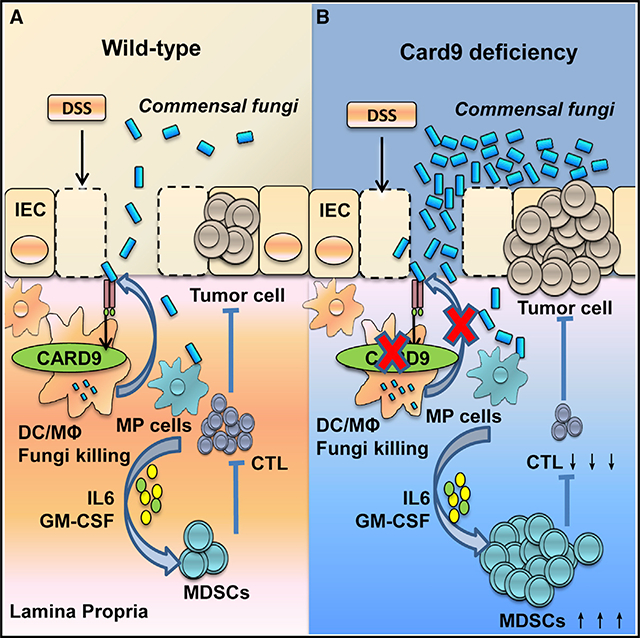
In summary, we proposed the following working model: C. tropicalis is a type of commensal fungus that exists in the mouse and human intestine. After tissue damage induced by DSS, C. tropicalis translocated into the LP can be cleared by macrophages through Card9-dependent antifungal innate immune responses. Card9-deficient mice have impaired fungicidal abilities, which results in increased fungal burden in the gut, leading to increased MDSC accumulation, inhibition of effector T cells, and promoting the development of colon cancer.
DISCUSSION
In this study, we find that Card9−/− mice display an increased prevalence of CAC. Card9-deficient macrophages have impaired fungicidal abilities, which led to increased fungi, especially C. tropicalis, in the gut. The increased fungi induce MDSC accumulation and promote the development of CAC. Of note, anti-fungal treatment ameliorates CAC in Card9−/− mice. Thus, our study uncovers the role of commensal fungi in the development of colon cancer, and CARD9 regulates intestinal anti-tumor immunity by controlling MDSC differentiation through modification of gut microbiota.
Recently, the role of commensal microbes in host homeostasis has attracted extensive attention. Gut microbes have been associated with aging (Neyrinck et al., 2017), obesity (Pindjakova et al., 2017), IBD, and colon cancers (Ilyas et al., 2015; Kang and Martin, 2017; Luan et al., 2015; Round and Mazmanian, 2009). As to the regulation of intestinal immunity, commensal Escherichia coli can promote the development of colon tumors in IL10−/− mice (Arthur et al., 2012). Bacteroides fragilis colonization triggers IL17-dependent colon carcinogenesis (Geis et al., 2015). Manipulation of the gut microbiota using resistant starch is associated with protection against CAC (Hu et al., 2016). As for the commensal fungus, C. albicans is the predominant commensal yeast colonized in human intestine (Jawhara et al., 2008). Our previous study has found C. tropicalis is specifically increased in Dectin3−/− colitis mice (Wang et al., 2016). Until now, no study has confirmed the role of commensal fungi in carcinogenesis. Here, we uncover the crucial role of commensal fungi in the development of colon cancer. By using an AOM-DSS-induced colitis-associated colon cancer mouse model, fecal transfer to germ-free mouse model, and anti-fungal treatment mouse model, we provide compelling evidence that commensal fungal can promote the development of colon cancer.
In our study, we did both mono-housing and co-housing experiments to confirm the role of microbiota in tumorigenesis. In the mono-housing experiment, Card9−/− and WT mice were separated at least 4 weeks before use and throughout the experiments. This manipulation is critical since it can avoid crosstalk of endogenous microbiota between Card9−/− and WT mice. In this mono-housing experiment, Card9−/− mice have increased tumor burden upon AOM-DSS treatment compared to WT mice. When Card9−/− and WT mice were co-housed before use and throughout the experiment, the difference in tumor burden vanished. This result is consistent with a previous study (Bergmann et al., 2017), in which Card9−/− and WT mice were co-housed to minimize variations in the endogenous microbiota. In addition, they use AOM combined with DSS (3.5%), which leads to very severe inflammation and high death rate (40%) in Card9−/− mice. In our study, DSS (2%) was used to induce a chronic inflammation. Therefore, all Card9−/− and WT mice can survival during AOM-DSS treatment. However, in the gut microbiota transferring experiment, due to the lack of mucus layer and impaired integrity of the epithelial barrier, about 30% germ-free mice died within 1 week after AOM injection. The remaining 70% mice survived until the end of the experiments.
Our findings allow a better understanding of the MDSC accumulation induced by fungal colonization and its contribution to colon cancer development. MDSCs are a group of immature myeloid cells, which may be induced under pathological conditions, such as inflammation and cancer. The accumulation of MDSCs in tumor microenvironment is a complex process, which may depend on two groups of signals. The first signal is released by tumors under stimulation with chronic infection and is critical for the expansion of immature myeloid cells (Condamine and Gabrilovich, 2011). This kind of signal includes GM-CSF, G-CSF, VEGF, and some transcriptional factors such as STAT3, IRF8, and alarmins S100A9 and S100A8. The second signal is mediated by inflammatory cytokines and is responsible for the pathologic activation of MDSCs. This signal includes several cytokine and chemokines, such as IFN-γ, IL6, IL-1 β, and Cxcl1. In our tumor-bearing Card9−/− mice, the mRNA expressions of S100A9, IL-6, IL-1β, and Cxcl1 were significantly increased compared to those in tumor-bearing WT mice. These two interactional signals may contribute to the accumulation and activation of MDSCs in tumor-bearing Card9−/− mice. In our in vitro study, we found that C. tropicalis can induce MDSC differentiation and activate immunosuppressive function of MDSCs. However, this effect is not unique to C. tropicalis. Previous studies have already proven that several toll-like receptors (TLRs) can enhance MDSC frequency and activity. The synthetic lipopeptide has been shown to induce MDSC expansion and prolong MDSC survival (Maruyama et al., 2015). LPS can also trigger MDSC expansion and activation using MyD88-dependent signaling pathway in several in vitro as well as in vivo studies (Arora et al., 2010; Bunt et al., 2009). Furthermore, TLR5 ligand can induce MDSC expansion (Rieber et al., 2013). Therefore, both fungus and bacteria can induce MDSC expansion and activation. These observations provide another regulatory mechanism on MDSCs in tumor environment. The cellular and molecular mechanism by which C. tropicalis selectively increases G-MDSCs in the gut will require further exploration.
STAR★METHODS
CONTACT FOR REAGENT AND RESOURCE SHARING
Further information and requests for resources and reagents should be directed to and will be fulfilled by the Lead Contact, Xin Lin (linxin307@tsinghua.edu.cn).
EXPERIMENTAL MODEL AND SUBJECT DETAILS
Animal breeding and generation
Card9−/− mice (Hsu et al., 2007) were used after backcrossing for 9 generation to C57BL/6J mice. C57BL/6J control mice were bred in the same facility. WT mice and Card9−/− mice were bred separately. No littermates were used. In mono-housed experiments (including CAC mouse model, AOM only mouse model, acute colitis mouse model, chronic colitis mouse model, feces transferring mouse model and fluconazole treatment mouse model), WT mice and Card9−/− mice were separated at least 4 weeks before use and throughout the experiments. In co-housed CAC experiment, WT and Card9−/− mice were co-housed for at least 4 weeks before and throughout the experiments. Germ free C57BL/6J mice were bred in germ-free isolators. Mice were housed in modified barrier facility at The University of Texas MD Anderson Cancer Center, Tsinghua University, and Nanjing University. Conventional mice were fed a standard chow diet and germ free mice were fed a diet without yeast. Animal care and experimental protocols were in accordance with the NIH “Guide for the Care and Use of the Laboratory Animals.” Experimental protocols were approved by the Institutional Animal Care and Use Committee at The University of Texas MD Anderson Cancer Center, Tsinghua University, and Nanjing University.
Fungal Strains
The C. tropicalis strain (W4162870) was kindly provided by Dr. Sarah L. Gaffen (University of Pittsburgh, PA). The GFP-C. tropicalis strain was kindly provided by Dr. Richard Bennett (Brown University, Providence, RI). For preparation of the fungal hyphal form, C. tropicalis was washed, re-suspended in complete RPMI 1640 medium, and grown for 3 h.
Mouse Model
To induce CAC model, WT and Card9−/− mice (10 weeks old) were injected intraperitoneally with AOM (10 mg/kg) on day 1(n = 5, each group). After 5 days, 2% DSS was added to the drinking water for 7 consecutive days. Three cycles of DSS treatment were used. After induction of tumorigenesis, mice were euthanized on day 100. All colon tissues, tumor tissues, feces, serum, spleens and mLNs were collected on day 100. For gut microbiota transfer experiment, fresh stool samples from tumor-bearing WT or Card9−/− mice were washed, suspended with LYHBHI medium (BD Difco, Le Pont De Claix, France) and were aliquoted and stored in −80°C. In WT→GF and Card9−/−→GF experiment, fecal suspension was orally gavaged to germ free mice (400μl each time, twice a week). Due to the lack of mucus layer and impaired integrity of the epithelial barrier, about 30% GF mice died within one week after AOM injection. The remaining 70% mice can survive till the end of experiments (at least 5 mice survived in each group). For fungal supplemental experiment, mice were given C. tropicalis or S. fibuligera (1 × 10⁷ yeast/mouse/dose, twice a week, n = 5, each group). For G-MDSCs deletion experiment, anti-Ly6G antibody (200μg) or anti-IgG was injected intraperitoneally one every 4 days (n = 5, each group). For the fungal ablation experiments, fluconazole (0.5 mg/mL) was added for three cycles in CAC model (n = 5, each group). All experiments were repeated with three independent biological replicates. After mice were euthanized, colons were removed and were flushed with cold PBS. Tumor numbers, tumor size and total tumor mass (tumor load) were measured for each mouse. After they were macroscopically assessed, colons were used for histopathological analysis and colonic LP cells isolation. Spleen and mLNs were also separated from each mouse.
Human Samples
87 patients diagnosed with colorectal cancers and received treatment in Nanjing University Affiliated Drum Tower Hospital between March 2016 to May 2017 were recruited in this study. Tumor tissues were acquired when patients received operation. Feces and blood were collected from each patient before surgery. All research involving human participants have been approved by the ethics committee of “Medical School of Nanjing University” and written informed consent was obtained from all subjects.
METHOD DETAILS
Histopathological and Immunohistochemical Analysis
Paraffin-embedded colon tissues were sectioned and stained with hematoxylin and eosin (H&E) at the Research Histology Facility at MD Anderson. Tumor grade were assessed by a pathologist blinded to the mouse genotype and treatment, using clinical and pathological scores as described previously (Kargl et al., 2013; Wirtz et al., 2007) (Table S2). For immunohistochemical staining, colon sections were stained with the indicated antibodies. Proliferation index which refers to positive cells/tumor cells with brown staining were counted in 10 consecutive areas.
Isolation of Colonic LP Cells and Flow Cytometry
Colonic LP cells were isolated from the study mice as described previously(Landers et al., 2002) with some modifications. Briefly, colons were isolated, resected, opened longitudinally, washed, and cut into pieces. Intestinal pieces were incubated in a digestion medium consisting of RPM11640, 5% fetal bovine serum (FBS), 1.5 mg/mL collagenase type IV, 5 U/mL DNase, and 1% penicillin-streptomycin for 30 min at 37°C. The cell suspensions were filtered through a mesh and then centrifuged at 1300 rpm. LP cells were used for flow cytometric analysis, western blotting, and cytokine analysis. Cells were stained with fluorescent-conjugated antibodies for 20 min. Positive cells were acquired and were calculated by FlowJo Software.
cDNA Synthesis and Real-Time PCR
Total RNA was isolated from tissues or cells with use of TRIzol. cDNA was synthesized by using a cDNA Synthesis kit. Quantitative real-time PCR was performed by using SYBR Green with an ABI StepOnePlus system (Life Technologies). The primers used are listed in Table S3. All the gene expression was normalized to the corresponding β-actin.
Fungal Burden Assay
The total fungal burden and the specific fungal burden were detected using qPCR method previous published (Iliev et al., 2012; Wang et al., 2016). Briefly, Feces were collected from experimental mice and suspended in 50 mM Tris buffer (pH 7.5) containing 1 mM EDTA, 0.2% β-mercaptoethanol, and 1000 U/mL lyticase. The mixture was incubated at 37°C for 30 min, and fungal genomic DNA was isolated from the feces and from colons with use of a QIAamp DNA Stool Mini Kit according to the manufacturer’s instructions. To detect fungal rDNA in feces, 100 ng fecal DNA was used as a template, and fungal 18S rDNA was evaluated by using qPCR analysis. For detection of specific fungi, qPCR was performed in genomic DNA by using fungal-specific primers (Table S3). The primers used are listed in the Supplemental material. The total fungal burden was calculated by the ΔCt method and normalized to the weight of the fecal samples and the amount of total DNA used. Relative quantity of the specific fungal burden was also calculated by the ΔCt method and normalized to the weight of the fecal samples. The proportion of specific fungi was the ratio of specific fungal burden to total fungal burden.
ITS2 rDNA gene sequencing and analysis
DNA was isolated from the feces of mice as described above. Fungal diversity was determined by 450 pyrosequencing of the ribosomal genes using ITS2 rDNA primers (Table S3). The PCR products were purified and quantified. Sequencing was performed was a Gs-FLX Titanium Sequencing System (Roche, Mannheim, Germany). The sequences were assigned to OTUs using the UCLUST algorithm. Principal component analyses (PCA) based on fungal composition were used.
Isolation of MDSCs and MDSCs suppressive assay
Colon tissue derived MDSCs in mice were purified using a Myeloid-Derived Suppressor Cell Isolation Kit. CD8+ or CD4+ T cells (105 cells/well) were co-cultured with purified MDSCs at different ratios in the presence of 1μg/mL plate-bound anti-CD3 monoclonal antibody and 0.5μg/mL soluble anti-CD28 monoclonal antibody in a 96-well flat-bottom plate for 72h. Cells were pulsed with 0.5μCi/well [3H] thymidine for the last 16h of incubation. Proliferation was measured by [3H] thymidine in-corporation in triplicate wells using an LS 6500 Multi-Purpose Scintillation Counter (Beckman Coulter).
QUANTIFICATION AND STATISTICAL ANALYSIS
Statistical analysis was performed using Prism 6 (GraphPad Software). Statistical significance was evaluated by unpaired Student’s t test. Correlation significance was determined by using linear regression. Differences with p values ≤ 0.05 were considered significant. *p ≤ 0.05; **p ≤ 0.01; ***p ≤ 0.001. n represents number of biological replicates.
DATA AND SOFTWARE AVAILABILITY
Raw and analyzed data from this paper have been deposited in GEO under accession number GSE111615.
Supplementary Material
KEY RESOURCES TABLE.
| REAGENT or RESOURCE | SOURCE | IDENTIFIER |
|---|---|---|
| Antibodies | ||
| Mouse monoclonal anti-F4/80 antibody | BD PharMingen | Cat #565410; RRID: AB_2687527 |
| anti-mouse CD11b antibody | Biolegend | Cat #101206; RRID: AB_312789 |
| anti-mouse CD11b antibody | eBioscience | Cat#48–0112-80; RRID: AB_1582237 |
| anti-mouse CD11c antibody | BioLegend | Cat#117324; RRID: AB_830649 |
| anti-mouse CD8 antibody | BioLegend | Cat#140403; RRID: AB_10641694 |
| anti-mouse CD4 antibody | BioLegend | Cat#100516; RRID: AB_312719 |
| anti-mouse CD25 antibody | BioLegend | Cat#102012; RRID: AB_312861 |
| anti-mouse Foxp3 antibody | BioLegend | Cat#320107; RRID: AB_49287 |
| anti-mouse IL-17 antibody | BioLegend | Cat#146303; RRID: AB_2562380 |
| anti-mouse IL-22 antibody | BioLegend | Cat#516406; RRID: AB_2280206 |
| anti-mouse CD45.1 antibody | BioLegend | Cat#103105; RRID: AB_312970 |
| anti-mouse lineage cocktail | BioLegend | Cat#133301; RRID: AB_11150779 |
| anti-mouse Nkp46 antibody | BioLegend | Cat#137605; RRID: AB_2149150 |
| anti- mouse Gr1 antibody | Biolegend | Cat #108412; RRID: AB_313377 |
| anti- mouse Ly6C antibody | Biolegend | Cat #128016; RRID: AB_1732076 |
| anti- mouse Ly6G antibody (detection) | Biolegend | Cat #127608; RRID: AB_1186099 |
| anti-mouse Ly6G antibody (depletion) | Biolegend | Cat #127649; RRID: AB_2572001 |
| anti- mouse γH2AX antibody | Biolegend | Cat #613407; RRID: AB_2114994 |
| Cleaved casepase-3 antibody | Cell Signaling Technology | Cat #9661; RRID: AB_2341188 |
| Phospho-p53 mouse mAb | Cell Signaling Technology | Cat#2521; RRID: AB_10828689 |
| P53 mouse mAb | Cell Signaling Technology | Cat#2524; RRID: AB_331743 |
| anti- human CD11b | Biolegend | Cat #301405; RRID: AB_314169 |
| anti- human CD14 | Biolegend | Cat #367117; RRID: AB_2566791 |
| anti-human CD33 antibody | Biolegend | Cat #303303; RRID: AB_314343 |
| anti-mouse PCAN | Cell Signaling Technology | Cat #13110; RRID: AB_2635979 |
| anti-mouse COX-2 | Cell Signaling Technology | Cat #12282; RRID: AB_2571729 |
| anti-CD3 monoclonal antibody | Biolegend | Cat #100238; RRID: AB_2561487 |
| anti-CD28 monoclonal antibody | Biolegend | Cat #302933; RRID: AB_11150591 |
| Bacterial and Virus Strains | ||
| C. tropicalis strain | Dr. Sarah L. Gaffen (University of Pittsburgh, PA) | W4162870 |
| GFP-C. tropicalis | Dr. Richard Bennett (Brown University, Providence, RI) | N/A |
| Biological Samples | ||
| Feces from healthy controls | Jinling Hospital affiliated Medical School, Nanjing University | N/A |
| Serum from healthy controls | Jinling Hospital affiliated Medical School, Nanjing University | N/A |
| Feces from patients with colorectal cancer | Jinling Hospital affiliated Medical School, Nanjing University | N/A |
| Serum from patients with colorectal cancer | Jinling Hospital affiliated Medical School, Nanjing University | N/A |
| Tumor tissues from patients with colorectal cancer | Jinling Hospital affiliated Medical School, Nanjing University | N/A |
| Chemicals, Peptides, and Recombinant Proteins | ||
| AOM | Sigma | A5486 |
| DSS (36–50 kDa) | MP Biomedicals | 160110 |
| Fluconazole | Sigma | F8929 |
| Zymosan | Sigma | Z4250 |
| Mannans | Sigma | M3640 |
| Collagenase type IV | Sigma | C5138 |
| D Nase I | Sigma | D5025 |
| TRIzol LS Reagent | Thermo Fisher Scientific | 10296028 |
| β-mercaptoethanol | Sigma | M3148 |
| lyticase | Sigma | L2524 |
| Critical Commercial Assays | ||
| cDNA Synthesis kit | Thermo Fisher Scientific | K1641 |
| SYBR Green Master Mix | Thermo Fisher Scientific | A25780 |
| QIAamp DNA Stool Mini Kit | QIAGEN | #51504 |
| Myeloid-Derived Suppressor Cell Isolation Kit | Miltenyi Biotec | #130–094-538 |
| CD8+ T cells Isolation Kit | Miltenyi Biotec | #130–116-478 |
| CD4+ T cells Isolation Kit | Miltenyi Biotec | #130–095-248 |
| Milliplex Mouse Cytokine/Chemokine MAGNE | Merck&Millipore | MCYTOMAG-70K-PMX |
| Deposited Data | ||
| Raw and analyzed data | This paper | GEO: GSE111615 |
| Experimental Models: Cell Lines | ||
| Primary Bone marrow cells | This paper | N/A |
| Primary CD8+ T cells | This paper | N/A |
| Primary CD4+ T cells | This paper | N/A |
| Primary LP cells | This paper | N/A |
| Primary MDSCs | This paper | N/A |
| L929 cells | Jonathan Kagan Laboratory | N/A |
| Experimental Models: Organisms/Strains | ||
| Mice: C57BL/6J WT mice | Hsu et al., 2007 | N/A |
| Mice: C57BL/6J Card9−/− mice | Hsu et al., 2007 | N/A |
| Oligonucleotides | ||
| Primers for qRT-PCR | This paper | Table S3 |
| Software and Algorithms | ||
| GraphPad Prism 7.0 | GraphPad Software | N/A |
| Flow Jo | FlowJo | N/A |
| Other | ||
| MS column | Miltenyi Biotec | Cat#130–042-201 |
| LS column | Miltenyi Biotec | Cat#130–042-401 |
| YPD Agar Medium | Clontech | Cat#630410 |
| YPD medium | Clontech | Cat#630409 |
Highlights.
Card9−/− mice have increased tumor burden upon AOM-DSS treatment compared to WT mice
CARD9-deficient macrophages exhibit impaired fungicidal abilities in the gut
Card9−/− mice have increased fungal loads and higher numbers of intestinal MDSCs
Antifungal treatment ameliorates colitis-associated cancer in Card9−/− mice
ACKNOWLEDGMENTS
We would like to thank Drs. Sarah Gaffen, Richard Bennett, Vishva Dixit, and Demin Wang for providing reagents. We thank Dr. Qing Ye in Nanjing University Affiliated Drum Tower Hospital for checking histology slides. We also thank Daniel C. Lin for editing and proofreading this manuscript. This work was partially supported by grants from National Natural Science Foundation of China (81572354 and 81772542 to T.W., 81630058 and 91542107 to X.L.), National Institutes of Health (AI116722 to M.-C.H.), a Scholar Award from the Center for Inflammation and Cancer in MDACC (to T.W.), Natural Science Foundation of Jiangsu Province in China (BK20161400 to T.W.), and Top six talent project in Jiangsu Province (WSW-031 to T.W.).
Footnotes
DECLARATION OF INTERESTS
The authors declare no competing interests.
SUPPLEMENTAL INFORMATION
Supplemental Information includes seven figures and three tables and can be found with this article online at https://doi.org/10.1016/j.immuni.2018.08.018.
REFERENCES
- Arnold M, Sierra MS, Laversanne M, Soerjomataram I, Jemal A, and Bray F (2017). Global patterns and trends in colorectal cancer incidence and mortality. Gut 66, 683–691. [DOI] [PubMed] [Google Scholar]
- Arora M, Poe SL, Oriss TB, Krishnamoorthy N, Yarlagadda M, Wenzel SE, Billiar TR, Ray A, and Ray P (2010). TLR4/MyD88-induced CD11b+Gr-1 int F4/80+ non-migratory myeloid cells suppress Th2 effector function in the lung. Mucosal Immunol. 3, 578–593. [DOI] [PMC free article] [PubMed] [Google Scholar]
- Arthur JC, Perez-Chanona E, Mühlbauer M, Tomkovich S, Uronis JM, Fan TJ, Campbell BJ, Abujamel T, Dogan B, Rogers AB, et al. (2012). Intestinal inflammation targets cancer-inducing activity of the microbiota. Science 338, 120–123. [DOI] [PMC free article] [PubMed] [Google Scholar]
- Arthur JC, Gharaibeh RZ, Mühlbauer M, Perez-Chanona E, Uronis JM, McCafferty J, Fodor AA, and Jobin C (2014). Microbial genomic analysis reveals the essential role of inflammation in bacteria-induced colorectal cancer. Nat. Commun 5, 4724. [DOI] [PMC free article] [PubMed] [Google Scholar]
- Bäumler AJ, and Sperandio V (2016). Interactions between the microbiota and pathogenic bacteria in the gut. Nature 535, 85–93. [DOI] [PMC free article] [PubMed] [Google Scholar]
- Beaudoin M, Goyette P, Boucher G, Lo KS, Rivas MA, Stevens C, Alikashani A, Ladouceur M, Ellinghaus D, Törkvist L, et al. ; Quebec IBD Genetics Consortium; NIDDK IBD Genetics Consortium; International IBD Genetics Consortium (2013). Deep resequencing of GWAS loci identifies rare variants in CARD9, IL23R and RNF186 that are associated with ulcerative colitis. PLoS Genet. 9, e1003723. [DOI] [PMC free article] [PubMed] [Google Scholar]
- Bergmann H, Roth S, Pechloff K, Kiss EA, Kuhn S, Heikenwälder M, Diefenbach A, Greten FR, and Ruland J (2017). Card9-dependent IL-1β regulates IL-22 production from group 3 innate lymphoid cells and promotes colitis-associated cancer. Eur. J. Immunol 47, 1342–1353. [DOI] [PMC free article] [PubMed] [Google Scholar]
- Bi L, Gojestani S, Wu W, Hsu YM, Zhu J, Ariizumi K, and Lin X (2010). CARD9 mediates dectin-2-induced IkappaBalpha kinase ubiquitination leading to activation of NF-kappaB in response to stimulation by the hyphal form of Candida albicans. J. Biol. Chem 285, 25969–25977. [DOI] [PMC free article] [PubMed] [Google Scholar]
- Brown GD (2010). How fungi have shaped our understanding of mammalian immunology. Cell Host Microbe 7, 9–11. [DOI] [PubMed] [Google Scholar]
- Bunt SK, Clements VK, Hanson EM, Sinha P, and Ostrand-Rosenberg S (2009). Inflammation enhances myeloid-derived suppressor cell cross-talk by signaling through Toll-like receptor 4. J. Leukoc. Biol 85, 996–1004. [DOI] [PMC free article] [PubMed] [Google Scholar]
- Condamine T, and Gabrilovich DI (2011). Molecular mechanisms regulating myeloid-derived suppressor cell differentiation and function. Trends Immunol. 32, 19–25. [DOI] [PMC free article] [PubMed] [Google Scholar]
- Drummond RA, and Brown GD (2011). The role of Dectin-1 in the host defence against fungal infections. Curr. Opin. Microbiol 14, 392–399. [DOI] [PubMed] [Google Scholar]
- Gabrilovich DI, and Nagaraj S (2009). Myeloid-derived suppressor cells as regulators of the immune system. Nat. Rev. Immunol 9, 162–174. [DOI] [PMC free article] [PubMed] [Google Scholar]
- Garrett WS, Gallini CA, Yatsunenko T, Michaud M, DuBois A, Delaney ML, Punit S, Karlsson M, Bry L, Glickman JN, et al. (2010). Enterobacteriaceae act in concert with the gut microbiota to induce spontaneous and maternally transmitted colitis. Cell Host Microbe 8, 292–300. [DOI] [PMC free article] [PubMed] [Google Scholar]
- Geis AL, Fan H, Wu X, Wu S, Huso DL, Wolfe JL, Sears CL, Pardoll DM, and Housseau F (2015). Regulatory T-cell Response to Enterotoxigenic Bacteroides fragilis Colonization Triggers IL17-Dependent Colon Carcinogenesis. Cancer Discov. 5, 1098–1109. [DOI] [PMC free article] [PubMed] [Google Scholar]
- Gross O, Gewies A, Finger K, Schäufer M, Sparwasser T, Peschel C, Förster I, and Ruland J (2006). Card9 controls a non-TLR signalling pathway for innate anti-fungal immunity. Nature 442, 651–656. [DOI] [PubMed] [Google Scholar]
- Gupta RB, Harpaz N, Itzkowitz S, Hossain S, Matula S, Kornbluth A, Bodian C, and Ullman T (2007). Histologic inflammation is a risk factor for progression to colorectal neoplasia in ulcerative colitis: a cohort study. Gastroenterology 133, 1099–1105, quiz 1340–1341. [DOI] [PMC free article] [PubMed] [Google Scholar]
- Hara H, Ishihara C, Takeuchi A, Imanishi T, Xue L, Morris SW, Inui M, Takai T, Shibuya A, Saijo S, et al. (2007). The adaptor protein CARD9 is essential for the activation of myeloid cells through ITAM-associated and Toll-like receptors. Nat. Immunol 8, 619–629. [DOI] [PubMed] [Google Scholar]
- Hsu YM, Zhang Y, You Y, Wang D, Li H, Duramad O, Qin XF, Dong C, and Lin X (2007). The adaptor protein CARD9 is required for innate immune responses to intracellular pathogens. Nat. Immunol 8, 198–205. [DOI] [PubMed] [Google Scholar]
- Hu Y, Le Leu RK, Christophersen CT, Somashekar R, Conlon MA, Meng XQ, Winter JM, Woodman RJ, McKinnon R, and Young GP (2016). Manipulation of the gut microbiota using resistant starch is associated with protection against colitis-associated colorectal cancer in rats. Carcinogenesis 37, 366–375. [DOI] [PubMed] [Google Scholar]
- Iliev ID, Funari VA, Taylor KD, Nguyen Q, Reyes CN, Strom SP, Brown J, Becker CA, Fleshner PR, Dubinsky M, et al. (2012). Interactions between commensal fungi and the C-type lectin receptor Dectin-1 influence colitis. Science 336, 1314–1317. [DOI] [PMC free article] [PubMed] [Google Scholar]
- Ilyas MI, Jordan SA, and Nfonsam V (2015). Fungal inflammatory masses masquerading as colorectal cancer: a case report. BMC Res. Notes 8, 32. [DOI] [PMC free article] [PubMed] [Google Scholar]
- Jawhara S, Thuru X, Standaert-Vitse A, Jouault T, Mordon S, Sendid B, Desreumaux P, and Poulain D (2008). Colonization of mice by Candida albicans is promoted by chemically induced colitis and augments inflammatory responses through galectin-3. J. Infect. Dis 197, 972–980. [DOI] [PubMed] [Google Scholar]
- Jia XM, Tang B, Zhu LL, Liu YH, Zhao XQ, Gorjestani S, Hsu YM, Yang L, Guan JH, Xu GT, and Lin X (2014). CARD9 mediates Dectin-1-induced ERK activation by linking Ras-GRF1 to H-Ras for antifungal immunity. J. Exp. Med 211, 2307–2321. [DOI] [PMC free article] [PubMed] [Google Scholar]
- Kaiko GE, and Stappenbeck TS (2014). Host-microbe interactions shaping the gastrointestinal environment. Trends Immunol 35, 538–548. [DOI] [PMC free article] [PubMed] [Google Scholar]
- Kang M, and Martin A (2017). Microbiome and colorectal cancer: Unraveling host-microbiota interactions in colitis-associated colorectal cancer development. Semin. Immunol 32, 3–13. [DOI] [PubMed] [Google Scholar]
- Kargl J, Haybaeck J, Stančić A, Andersen L, Marsche G, Heinemann A, and Schicho R (2013). O-1602, an atypical cannabinoid, inhibits tumor growth in colitis-associated colon cancer through multiple mechanisms. J. Mol. Med. (Berl.) 91, 449–458. [DOI] [PMC free article] [PubMed] [Google Scholar]
- Kingeter LM, and Lin X (2012). C-type lectin receptor-induced NF-κB activation in innate immune and inflammatory responses. Cell. Mol. Immunol 9, 105–112. [DOI] [PMC free article] [PubMed] [Google Scholar]
- Lamas B, Richard ML, Leducq V, Pham HP, Michel ML, Da Costa G, Bridonneau C, Jegou S, Hoffmann TW, Natividad JM, et al. (2016). CARD9 impacts colitis by altering gut microbiota metabolism of tryptophan into aryl hydrocarbon receptor ligands. Nat. Med 22, 598–605. [DOI] [PMC free article] [PubMed] [Google Scholar]
- Landers CJ, Cohavy O, Misra R, Yang H, Lin YC, Braun J, and Targan SR (2002). Selected loss of tolerance evidenced by Crohn’s disease-associated immune responses to auto- and microbial antigens. Gastroenterology 123, 689–699. [DOI] [PubMed] [Google Scholar]
- Lasry A, Zinger A, and Ben-Neriah Y (2016). Inflammatory networks underlying colorectal cancer. Nat. Immunol 17, 230–240. [DOI] [PubMed] [Google Scholar]
- Luan C, Xie L, Yang X, Miao H, Lv N, Zhang R, Xiao X, Hu Y, Liu Y, Wu N, et al. (2015). Dysbiosis of fungal microbiota in the intestinal mucosa of patients with colorectal adenomas. Sci. Rep 5, 7980. [DOI] [PMC free article] [PubMed] [Google Scholar]
- Macfarlane GT, Blackett KL, Nakayama T, Steed H, and Macfarlane S (2009). The gut microbiota in inflammatory bowel disease. Curr. Pharm. Des 15, 1528–1536. [DOI] [PubMed] [Google Scholar]
- Maruyama A, Shime H, Takeda Y,Azuma M, Matsumoto M, and Seya T (2015). Pam2 lipopeptides systemically increase myeloid-derived suppressor cells through TLR2 signaling. Biochem. Biophys. Res. Commun 457, 445–450. [DOI] [PubMed] [Google Scholar]
- Mukherjee PK, Sendid B, Hoarau G, Colombel JF, Poulain D, and Ghannoum MA (2015). Mycobiota in gastrointestinal diseases. Nat. Rev. Gastroenterol. Hepatol 12, 77–87. [DOI] [PubMed] [Google Scholar]
- Nakamura S, Nakamura S, Matsumoto T, Yada S, Hirahashi M, Suekane H, Yao T, Goda K, and Iida M (2005). Overexpression of caspase recruitment domain (CARD) membrane-associated guanylate kinase 1 (CARMA1) and CARD9 in primary gastric B-cell lymphoma. Cancer 104, 1885–1893. [DOI] [PubMed] [Google Scholar]
- Neyrinck AM, Taminiau B, Walgrave H, Daube G, Cani PD, Bindels LB, and Delzenne NM (2017). Spirulina Protects against Hepatic Inflammation in Aging: An Effect Related to the Modulation of the Gut Microbiota? Nutrients 9, 9. [DOI] [PMC free article] [PubMed] [Google Scholar]
- Ott SJ, Kühbacher T, Musfeldt M, Rosenstiel P, Hellmig S, Rehman A, Drews O, Weichert W, Timmis KN, and Schreiber S (2008). Fungi and inflammatory bowel diseases: Alterations of composition and diversity. Scand. J. Gastroenterol 43, 831–841. [DOI] [PubMed] [Google Scholar]
- Pindjakova J, Sartini C, Lo Re O, Rappa F, Coupe B, Lelouvier B, Pazienza V, and Vinciguerra M (2017). Gut Dysbiosis and Adaptive Immune Response in Diet-induced Obesity vs. Systemic Inflammation. Front. Microbiol 8, 1157. [DOI] [PMC free article] [PubMed] [Google Scholar]
- Qin J, Li R, Raes J, Arumugam M, Burgdorf KS, Manichanh C, Nielsen T, Pons N, Levenez F, Yamada T, et al. ; MetaHIT Consortium (2010). A human gut microbial gene catalogue established by metagenomic sequencing. Nature 464, 59–65. [DOI] [PMC free article] [PubMed] [Google Scholar]
- Rieber N, Brand A, Hector A, Graepler-Mainka U, Ost M, Schäfer I, Wecker I, Neri D, Wirth A, Mays L, et al. (2013). Flagellin induces myeloid-derived suppressor cells: implications for Pseudomonas aeruginosa infection in cystic fibrosis lung disease. J. Immunol 190, 1276–1284. [DOI] [PubMed] [Google Scholar]
- Rivas MA, Beaudoin M, Gardet A, Stevens C, Sharma Y, Zhang CK, Boucher G, Ripke S, Ellinghaus D, Burtt N, et al. ; National Institute of Diabetes and Digestive Kidney Diseases Inflammatory Bowel Disease Genetics Consortium (NIDDK IBDGC); United Kingdom Inflammatory Bowel Disease Genetics Consortium; International Inflammatory Bowel Disease Genetics Consortium (2011). Deep resequencing of GWAS loci identifies independent rare variants associated with inflammatory bowel disease. Nat. Genet 43, 1066–1073. [DOI] [PMC free article] [PubMed] [Google Scholar]
- Robinson MJ, Osorio F, Rosas M, Freitas RP, Schweighoffer E, Gross O, Verbeek JS, Ruland J, Tybulewicz V, Brown GD, et al. (2009). Dectin-2 is a Syk-coupled pattern recognition receptor crucial for Th17 responses to fungal infection. J. Exp. Med 206, 2037–2051. [DOI] [PMC free article] [PubMed] [Google Scholar]
- Round JL, and Mazmanian SK (2009). The gut microbiota shapes intestinal immune responses during health and disease. Nat. Rev. Immunol 9, 313–323. [DOI] [PMC free article] [PubMed] [Google Scholar]
- Rutter M, Saunders B, Wilkinson K, Rumbles S, Schofield G, Kamm M, Williams C, Price A, Talbot I, and Forbes A (2004). Severity of inflammation is a risk factor for colorectal neoplasia in ulcerative colitis. Gastroenterology 126, 451–459. [DOI] [PubMed] [Google Scholar]
- Saijo S, Fujikado N, Furuta T, Chung SH, Kotaki H, Seki K, Sudo K, Akira S, Adachi Y, Ohno N, et al. (2007). Dectin-1 is required for host defense against Pneumocystis carinii but not against Candida albicans. Nat. Immunol 8, 39–46. [DOI] [PubMed] [Google Scholar]
- Santelmann H, and Howard JM (2005).Yeast metabolic products, yeast antigens and yeasts as possible triggers for irritable bowel syndrome. Eur. J. Gastroenterol. Hepatol 17, 21–26. [DOI] [PubMed] [Google Scholar]
- Schoenen H, Bodendorfer B, Hitchens K, Manzanero S, Werninghaus K, Nimmerjahn F, Agger EM, Stenger S, Andersen P, Ruland J, et al. (2010). Cutting edge: Mincle is essential for recognition and adjuvanticity of the mycobacterial cord factor and its synthetic analog trehalose-dibehenate. J. Immunol 184, 2756–2760. [DOI] [PMC free article] [PubMed] [Google Scholar]
- Scupham AJ, Presley LL, Wei B, Bent E, Griffith N, McPherson M, Zhu F, Oluwadara O, Rao N, Braun J, and Borneman J (2006). Abundant and diverse fungal microbiota in the murine intestine. Appl. Environ. Microbiol 72, 793–801. [DOI] [PMC free article] [PubMed] [Google Scholar]
- Sobhani I, Tap J, Roudot-Thoraval F, Roperch JP, Letulle S, Langella P, Corthier G, Tran Van Nhieu J, and Furet JP (2011). Microbial dysbiosis in colorectal cancer (CRC) patients. PLoS ONE 6, e16393. [DOI] [PMC free article] [PubMed] [Google Scholar]
- Sokol H, Conway KL, Zhang M, Choi M, Morin B, Cao Z, Villablanca EJ, Li C, Wijmenga C, Yun SH, et al. (2013). Card9 mediates intestinal epithelial cell restitution, T-helper 17 responses, and control of bacterial infection in mice. Gastroenterology 145, 591–601.e3. [DOI] [PMC free article] [PubMed] [Google Scholar]
- Sonda N, Chioda M, Zilio S, Simonato F, and Bronte V (2011). Transcription factors in myeloid-derived suppressor cell recruitment and function. Curr. Opin. Immunol 23, 279–285. [DOI] [PubMed] [Google Scholar]
- Stringer AM, Gibson RJ, Logan RM, Bowen JM, Yeoh AS, Hamilton J, and Keefe DM (2009). Gastrointestinal microflora and mucins may play a critical role in the development of 5-Fluorouracil-induced gastrointestinal mucositis. Exp. Biol. Med. (Maywood) 234, 430–441. [DOI] [PubMed] [Google Scholar]
- Turnbaugh PJ, Ley RE, Hamady M, Fraser-Liggett CM, Knight R, and Gordon JI (2007). The human microbiome project. Nature 449, 804–810. [DOI] [PMC free article] [PubMed] [Google Scholar]
- Wang T, Pan D, Zhou Z, You Y, Jiang C, Zhao X, and Lin X (2016). Dectin-3 Deficiency Promotes Colitis Development due to Impaired Antifungal Innate Immune Responses in the Gut. PLoS Pathog. 12, e1005662. [DOI] [PMC free article] [PubMed] [Google Scholar]
- Willing BP, Dicksved J, Halfvarson J, Andersson AF, Lucio M, Zheng Z, Järnerot G, Tysk C, Jansson JK, and Engstrand L (2010). A pyrosequencing study in twins shows that gastrointestinal microbial profiles vary with inflammatory bowel disease phenotypes. Gastroenterology 139, 1844–1854.e1. [DOI] [PubMed] [Google Scholar]
- Wirtz S, Neufert C, Weigmann B, and Neurath MF (2007). Chemically induced mouse models of intestinal inflammation. Nat. Protoc 2, 541–546. [DOI] [PubMed] [Google Scholar]
- Wu W, Hsu YM, Bi L, Songyang Z, and Lin X (2009). CARD9 facilitates microbe-elicited production of reactive oxygen species by regulating the LyGDI-Rac1 complex. Nat. Immunol 10, 1208–1214. [DOI] [PubMed] [Google Scholar]
- Youn JI, Nagaraj S, Collazo M, and Gabrilovich DI (2008). Subsets of myeloid-derived suppressor cells in tumor-bearing mice. J. Immunol 181, 5791–5802. [DOI] [PMC free article] [PubMed] [Google Scholar]
- Zhao XQ, Zhu LL, Chang Q, Jiang C, You Y, Luo T, Jia XM, and Lin X (2014). C-type lectin receptor dectin-3 mediates trehalose 6,6′-dimycolate (TDM)-induced Mincle expression through CARD9/Bcl10/MALT1-dependent nuclear factor (NF)-κB activation. J. Biol. Chem 289, 30052–30062. [DOI] [PMC free article] [PubMed] [Google Scholar]
Associated Data
This section collects any data citations, data availability statements, or supplementary materials included in this article.
Supplementary Materials
Data Availability Statement
Raw and analyzed data from this paper have been deposited in GEO under accession number GSE111615.