Abstract
The esterase from the thermophilic eubacterium Bacillus acidocaldarius is a thermophilic and thermostable monomeric protein with a molecular mass of 34 KDa. The enzyme, characterized as a “B-type” carboxylesterase, displays the maximal activity at 65°C. Interestingly, it is also quite active at room temperature, an unusual feature for an enzyme isolated from a thermophilic microorganism. We investigated the effect of temperature on the structural properties of the enzyme, and compared its structural features with those of the esterase from the hyperthermophilic archaeon Archaeoglobus fulgidus. In particular, the secondary structure and the thermal stability of the esterase were studied by FT-IR spectroscopy, while information on the conformational dynamics of the enzyme were obtained by frequency-domain fluorometry and anisotropy decays. Our data pointed out that the Bacillus acidocaldarius enzyme possesses a secondary structure rich in α-helices as described for the esterase isolated from Archaeoglobus fulgidus. Moreover, infrared spectra indicated a higher accessibility of the solvent (2H2O) to Bacillus acidocaldarius esterase than to Archaeoglobus fulgidus enzyme suggesting, in turn, a less compact structure of the former enzyme. The fluorescence studies showed that the intrinsic tryptophanyl fluorescence of the Bacillus acidocaldarius protein was well represented by the three-exponential model, and that the temperature affected the protein conformational dynamics. The data suggested an increase in the protein flexibility on increasing the temperature. Moreover, comparison of Bacillus acidocaldarius esterase with the Archaeoglobus fugidus enzyme fluorescence data indicated a higher flexibility of the former enzyme at all temperatures tested, supporting the infrared data and giving a possible explanation of its unusual relative high activity at low temperatures.
Keywords: infrared, protein structure, thermophilic enzyme, frequency-domain fluorometry, anisotropy decays, protein stability
INTRODUCTION
Hyperthermophilic organisms thrive at temperatures near and even above 100°C.1–3 In recent years much interest has been focused on the characterization of these microorganisms, and in particular on their enzymes.4–6 Identifying the bases of protein adaptation to high temperature is integral to our understanding of protein folding, the relationship of protein structure to function, the design of high temperature biocatalysts, and the history of the life on this planet.7 Despite the great importance attached to both fundamental research and biotechnological applications, the general features of thermophilic adaptation are still unknown, and there are no reliable strategies of bio-molecular stabilization.8,9 The increasing number of 3D-structures of enzymes and proteins from thermophiles has shed some light on the determinants of their structural stability. The most relevant difference found when comparing the 3D-structures of proteins from thermophiles with their mesophilic counterparts are an increased number of ion-pairs organized in large networks.10,11
Recently Tang and Dill have studied the temperature-induced fluctuations in a lattice model;12 their data suggested that proteins having greater stability tend to have fewer large fluctuations, and hence lower flexibility.12 In other words, if flexibility is necessary for enzyme catalysis, this could explain why enzymes from thermophilic organisms, which are exceptionally stable at high temperatures, may be catalytically inactive at normal temperatures. Their conclusion is consistent with the experimental observations by Tilton et al., on the ribonuclease A.13
Despite of the enormous importance of such studies, relatively few experimental investigations have been carried out on the dynamics of very stable enzymes, but evidence from hydrogen-deuterium exchange also shows that, at a given temperature, thermostable enzymes are less flexible than thermolabile ones, and more specifically that enzymes from extreme thermophiles are, at room temperature, less flexible than those from mesophiles.14,15
Time-resolved fluorescence studies involve the investigation of the rate of decay from the first excited singlet electronic state (intensity decays) or an induced polarization of the excited state (anisotropy decays).16 Protein structural fluctuations can perturb either the intensity or anisotropy decays; these perturbations may be related to local events near or involving the probe and its immediate environment (relatively fast), to “global” processes involving the entire protein structure (relatively slow), or both.16 Tryptophan residues in proteins are often used as probes to monitor the structural changes of the macromolecules in solution. The photo-physics of indolic residues in proteins is complex, involving multiple non-radiative pathways, such as excited-state proton transfer, excited-state electron transfer, and solvent quenching.17,18
In a recent article we have shown the effect of the temperature on the secondary structure, on the stability and on the conformational dynamics of the esterase isolated from the hyperthermophilic archaeon Archaeoglobus fulgidus (AFEST).19 The hyperthermophilic enzyme displayed the maximal enzyme activity at 80°C, being scarcely active at room temperature. The structural data suggested the presence of a temperature-sensitive β-sheet involved in the functional features of the enzyme.19
In this study, analogously to AFEST, we investigated by FT-IR and fluorescence spectroscopy the secondary structure, the thermal stability and the conformational dynamics of the esterase from the moderate thermophilic eubacterium Bacillus acidocaldarius (EST2). The enzyme is a monomer protein with a molecular mass of 34 kDa, similar to that of AFEST (35.5 KDa), containing four trytptophan residues. EST2 displays the maximal activity at 65°C, but it shows also a quite high activity at room temperature.20 The aim of the work was to elucidate the structural features of EST2. The unusual high activity of EST2 at low temperatures, which is an uncommon feature for a thermophilic enzyme, prompted us to compare the results with those from AFEST in order to shed light to the structural-functional relationships in these two thermophilic esterases. The stability and the conformational dynamics of EST2, investigated at different temperatures, are discussed in comparison of the results obtained from AFEST.19
MATERIALS AND METHODS
Materials
Deuterium oxide (99.9% 2H2O) was purchased from Aldrich. All the other chemicals were commercial samples of the purest quality.
Preparation and Purification of EST2
The purification of homogeneous EST2 was reported previously.20 Typically the specific activity of the homogeneous enzyme was approximately 3,000 U/mg at 65°C by using 0.2 mM p-nitrophenyl exanoate as substrate in a mixture of 40 mM Na2HPO4/NaH2PO4/ 0.09% (w/v) arabic gum/ 0.36% (v/v) Triton X-100/ 2% (v/v) propan-2-ol (pH 7.1). Protein samples were concentrated and placed in 50 mM Tris-HCl, 2.5 mM MgCl2, 0.5 mM EDTA, 1 mM DTT buffer, pH 7.1 by means of an Amicon ultrafiltration apparatus equipped with PM-30 membranes.
Protein Assay
The protein concentration was determined by the method of Bradford21 with bovine serum albumin as standard.
Preparation of Samples for Infrared Measurements
Typically, 1.5 mg of protein dissolved in 500 μl of buffer used for EST2 purification were centrifuged in a “30 K microsep” micro concentrator (Dasit) at 3000 × g and 4°C and concentrated into a volume of approximately 40 μl. Then 300 μl of 50 mM Tris-HCl, 2.5 mM MgCl2, 0.5 mM EDTA, 1 mM DTT buffer, prepared in 1H2O pH 7.1 or 2H2O p2H 7.1, were added and the sample concentrated again. This procedure was repeated several times in order to completely replace the buffer, in which the protein was originally dissolved, with the Tris buffer. The washings took 24 hours, which is the time of contact of the protein with the 2H2O medium prior FT-IR analysis. In the last washing the protein sample was concentrated to a final volume of approximately 40 μl and used for the infrared measurements.
Infrared Spectra
The concentrated protein samples were placed in a thermostated Graseby Specac 20500 cell (Graseby-Specac Ltd, Orpington, Kent, UK) fitted with CaF2 windows and 6 or 25 μm spacers for measurements in 1H2O or 2H2O medium, respectively. FT-IR spectra were recorded by means of a Perkin-Elmer 1760-× Fourier transform infrared spectrometer using a deuterated triglycine sulphate detector and a normal Beer-Norton apodization function. At least 24 h before, and during data acquisition the spectrometer was continuously purged with dry air at a dew point of −40°C. Spectra of buffers and samples were acquired at 2 cm−1 resolution under the same scanning and temperature conditions. Typically, 256 scans were averaged for each spectrum obtained at 20°C, while 16 scans were averaged for spectra obtained at higher temperatures. In the thermal-denaturation experiments, the temperature was raised in 5°C steps from 20°C to 95°C. Before the spectrum acquisition, samples were maintained at the desired temperature for the time necessary for the stabilization of temperature inside the cell (6 min). The deconvoluted parameters for the amide I band were set with the half-bandwidth at 18 cm−1 and a resolution enhancement factor of 2.5.
Fluorescence Spectroscopy
Frequency-domain measurements were performed as previously described.22 The excitation source was a synchronously pumped frequency-doubled rhodamine 6 G dye laser at 298 nm. The tryptophan emission was selected by a Corning 7–60 and 345 nm cut off filter. All intensity decay measurements were performed with magic angle polarize conditions. Temperature of the sample compartment was stabilized with the precision better than ±0.5°C using Lauda RMT6 water-bath.
Intensity decays were analyzed in terms of the multi-exponential model, where αi are the pre-exponential factors, the decay times, and Σαi = 1.0. The fractional contribution fi of each decay component to the steady-state intensity is given by
and the mean intensity weighted lifetime is
The time-resolved anisotropy decays were obtained by a least-squares analysis of the differential polarized phase and modulation ratio22,23
where gk are fractional amplitudes, Φk rotational correlation times, Σgk = 1.0, and r0 is the anisotropy in the absence of rotational motion during the excited state lifetime. For the excitation at 298 nm the time-zero anisotropy was fixed to the value of r0 = 0.29.22 The uncertainties in the differential phase angles (δΔ) and modulation ratios (δ ) were assumed to be δΔ = 0.2 deg and (δ) = 0.005, respectively.
RESULTS AND DISCUSSION
Absorbance Spectra
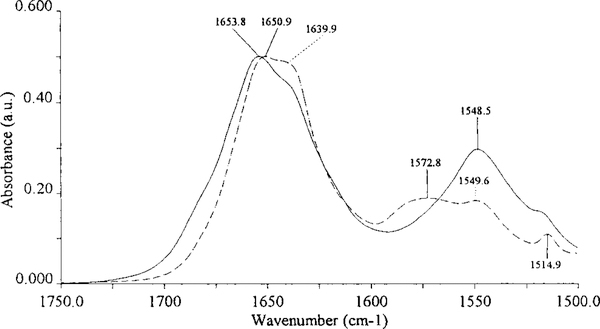
Figure 1 shows the original absorbance spectra of EST2 in H2O (continuous line) and in 2H2O (dashed line). The exchange of H2O with2H2O causes a change of the shape of the amide I band, a downshift of its maximum from 1,653.8 to 1,650.9 cm−1 and an increase in intensity of the 1,639.9 cm−1 shoulder. The 1H/2H exchange also causes a decrease of the amide II band (1,548.5) intensity and the extent of exchange gives information on the accessibility of the solvent (2H2O) to the protein.24 Since the spectrum of the protein in 2H2O shows a residual amide II band (1,549.6) it is clear that, upon a contact of the protein with 2H2O for 24 h at 4°C (see Materials and Methods), the amide hydrogens were not completely exchanged with deuterium. The 1,572.8 and 1,514.9 cm−1 bands are due to amino acid side-chain absorption.25
Fig. 1.
Original absorbance spectra of EST2 at 20°C upon subtraction of buffer. Continuous and dashed lines represent the spectra of protein in H2O and 2H2O, respectively. The spectra were normalized to the amide I band intensity.
Deconvolved Spectra and Secondary Structure
The deconvolved spectra of EST2 in H2O and 2H2O are shown in Figure 2, continuous and dashed lines, respectively. These resolution-enhanced spectra show the amide I (1,700–1,600 cm−1 range) components due to a particular secondary structure. In H2O (continuous line) two main bands (1,655.8 and 1,638.1 cm−1) are well visible. In spectrum obtained in 2H2O (dashed line) these bands are located to a lower wavenumber and can be assigned to α-helix (1,652.7) and β-sheets (1,636.2 cm−1).26 In 2H2O medium a 1,642.2 cm−1 band, due to unordered structures,26 is also visible.
Fig. 2.
Deconvolved spectra of EST2 at 20°C in H2O (continuous line) and in 2H2O (dashed line).
The 1,666 cm−1 band can be assigned to turns, the and 1,623.8 cm−1 bands to −-sheets26 and the 1,683 cm−1 band to turns and/or β-sheets.27 The bands below 1,615 cm−1 are due to amino acid side-chain absorption25 while the 1,548.1 cm−1 peak represents the residual amide II band.24
The estimation of the secondary structure composition was obtained by using the method of Lee et al.28 using factor analysis of the infrared spectrum of EST2 obtained in H2O. The analysis gave α-helix 43%, β-sheet 26%; turns 18%.
Thermal Denaturation
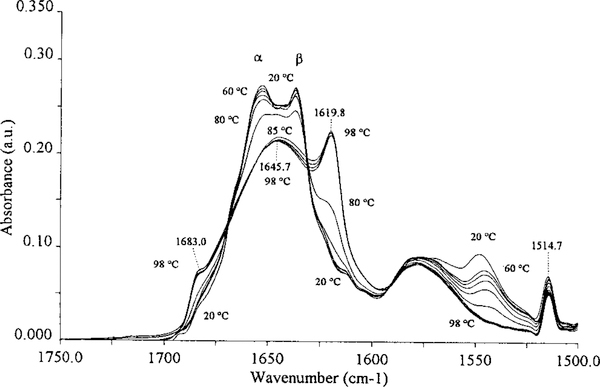
The increase in temperature caused changes in the amide I’ band reflecting different phenomena. In particular, Figure 3 shows a small decrease in intensity of the β-sheet and α-helix bands between 20°C and 75°C. At 80°C the intensity of these bands is much lower than at 75°C indicating that at this temperature a significant loss of secondary structure occurred. The partial loss of secondary structure at 80°C was accompanied by the appearance of a band close to 1,620 cm −1 due to protein aggregation brought on by thermal denaturation.29 However, the main changes in the infrared spectrum occurred at 85°C. At this temperature the β-sheet and α-helix bands disappeared and the amide I’ band became broader showing two strong bands close to 1,620 and 1,683 cm−1 due to protein aggregation caused by thermal denaturation.29 From 85°C to 98°C the amide I’ band remained almost unaltered showing a maximum at 1,645.7 cm −1 characteristic of unordered structures.26 The decrease in intensity of residual amide I’ band (close to 1,550 cm −1) with the increase of the temperature is due to a further 1H/2H exchange caused by high temperature and protein unfolding. The 1,514.7 cm −1 peak is due to absorption of tyrosine residues.25
Fig. 3.
Deconvolved spectra of EST2 in 2H2O as a function of the temperature. The spectra were collected from 20°C to 95°C in 5°C steps (see Materials and Methods). The figure shows the spectrum collected at 20°C and the spectra from 60°C to 98°C.
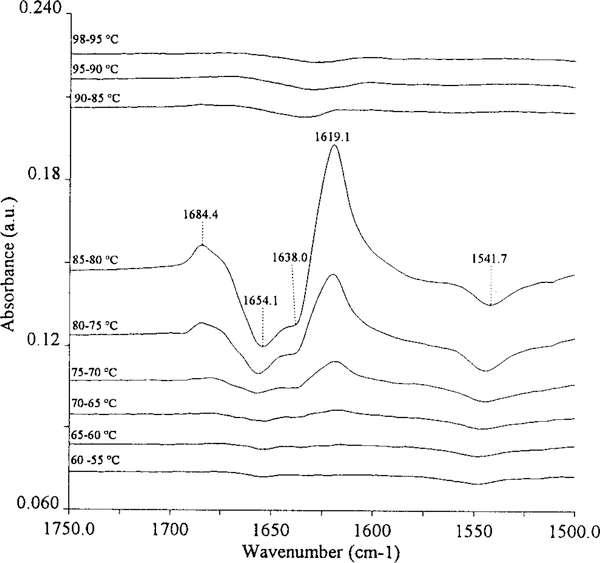
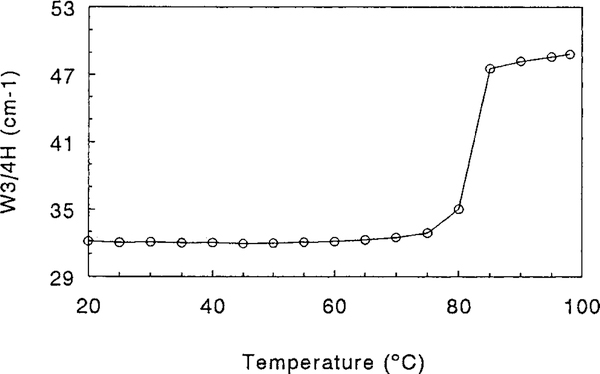
Thermal denaturation was also followed by making difference spectra between two original absorbance spectra collected at close temperatures (Fig. 4)30 and by monitoring the amide I’ bandwidth as a function of the temperature31 (Fig. 5). In a difference spectrum negative and positive bands indicate a lower and higher content, respectively, of a particular structure present in the sample treated at higher temperature.30 In particular, the negative 1,654.1 and 1,638 cm −1 bands shown in Figure 4 indicate a lower content of α-helix and β-sheet, respectively, in the sample recorded at higher temperature.30 This loss of secondary structure induced by high temperature can be followed as shown in the figure, giving detailed information on thermal denaturation. Analogously, the intensity of the positive 1,619.1 and 1,684.4 cm −1 bands, which represent protein intermolecular interactions (aggregation) brought on by thermal denaturation,29,30 indicates the extent of aggregation induced by high temperature.
Fig. 4.
Difference spectra between two original absorbance spectra obtained at different temperatures. Difference spectra were originated by making the difference between two original absorbance spectra obtained at the temperature reported in the Figure.
Fig. 5.
Thermal denaturation of EST2 in 2H2O. The thermal denaturation curve was obtained by monitoring the amide I’ band width calculated at 3/4 of amide band height (W3/4H) as a function of the temperature.
Thus, the figure shows that Tm of thermal denaturation is in the temperature range of 85–80°C. The very small, but visible negative and positive bands close to 1,654 and 1,619 cm−1, respectively, in the difference spectrum (70–65°C) indicate in this temperature range the onset of thermal denaturation and aggregation, respectively. The cm−1 negative band represents a further 1H/2H exchange caused by high temperature and thermal denaturation.24,30
When a protein undergoes thermal denaturation, a sharp increase of the amide I bandwidth is observed at Tm, as shown by Figure 5. The graph shows that the temperature of denaturation (Tm) is approximately at 82°C while the onset of denaturation is at about 75°C. It must be pointed out that the identification of the onset of denaturation by this graph is less precise than the use of difference spectra shown in Figure 4.
The FT-IR results show a secondary structure composition similar to that obtained by CD and secondary structure prediction.20 In particular, the α-helix and turn content is particularly in agreement with CD data (44% and 19%, respectively), while the content of β-sheets is higher with respect to that predicted by CD measurements (15%). This discrepancy may be ascribed to the lower sensitivity of CD to β-sheets even thought it must be underlined that the results on secondary structure estimation made by FT-IR or CD spectroscopy must be always taken with caution.32 However, both techniques are particularly useful for comparative studies and infrared spectroscopy may distinguish between β-sheets having different hydrogen bonding pattern.32
The molecular mass of EST2 is very similar to that of AFEST.20 Moreover, the secondary structure of AFEST, estimated by CD, is very similar to that of EST2.20 These data may suggest that a particular secondary structure composition and topological arrangement of the structural elements is necessary for the esterase activity of a protein. Although these similarities, AFEST showed a Tm19 much higher than EST2 and this may be ascribed to the hyperthermophilic nature of Archaeoglobus fulgidus from which AFEST was isolated.19 Fluorescence studies showed a temperature-dependent flexibility of AFEST, which may be responsible of the increased activity of the enzyme at high temperature.19 This may also be a common feature of proteins from thermophilic microorganisms. Moreover, an unusual flexibility at low temperatures was recently suggested for EST2.20 Comparison of EST2 with AFEST FT-IR resolution-enhanced spectra19 reveals a lower position of the α-helix and β-sheet bands in EST2, indicating a higher accessibility of the solvent (2H2O) to EST2 than to AFEST. This, in turn, may indicates a less compact structure of EST2 with respect to AFEST and could support the data concerning the unusual flexibility of EST2 at low temperature.20
Fluorescence Spectroscopy
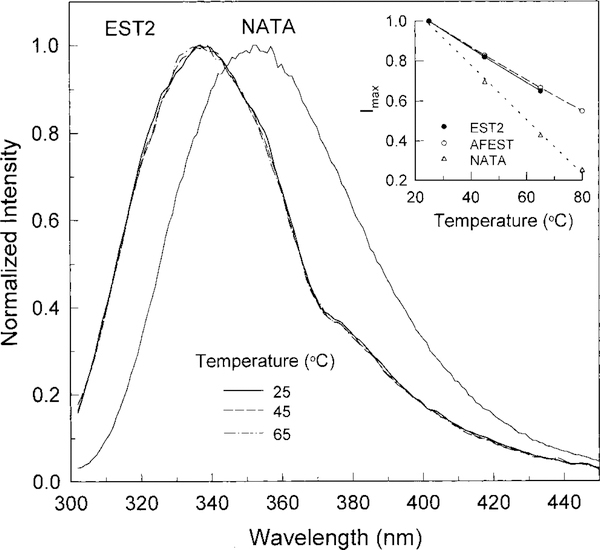
Figure 6 shows the fluorescence emission spectra of EST2 at 25°C, 45°C, and 65°C as well as the spectrum of NATA at 25°C. The spectra were normalized to unity at the peak of the fluorescence intensity. The EST2 emission spectrum at 25°C displays a maximum at 338 nm, suggesting that the protein fluorescence emission arises from indolic residues that are partially buried in the protein matrix.16 Figure 6 also shows EST2 spectra at 45°C, and 65°C as well as the spectrum of NATA at 25°C, which displays an emission maximum at 352 nm. The protein spectra at 45°C and 65°C completely overlay the EST2 spectrum at 25°C, indicating that the indolic residues in this enzyme remain in a protected environment even at 65°C. When the temperature is raised over 65°C the protein solution becomes milky, indicating the enzyme aggregation (data not shown), in accordance with infrared data which showed the onset of protein denaturation and aggregation between 65 and 70°C.
Fig. 6.
Fluorescence emission spectra of EST2 (at different temperatures) and NATA (at 25°C). The spectra were normalized to 1 as regard the fluorescence emission. The excitation was at 295 nm. The absorbance of the protein and NATA solutions was below 0.1. The protein concentration was 0.05 mg/ml.
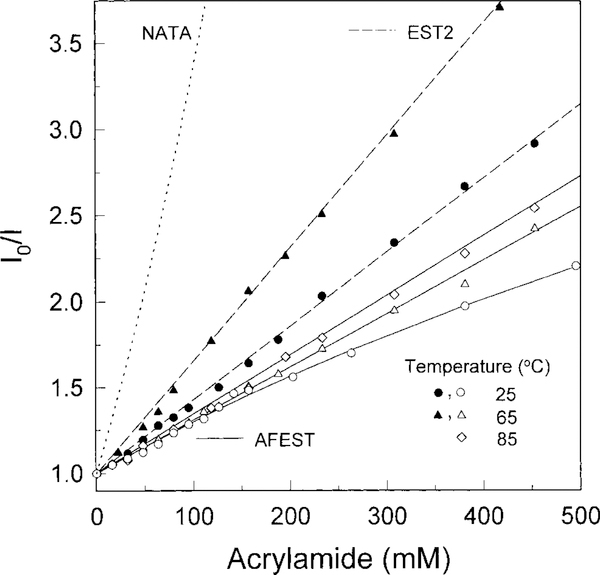
Recently we have investigated the effect of the temperature on the esterase from the hyperthermophilic archaeon Archaeoglobus fulgidus (AFEST).19 The data showed that the fluorescence spectrum of AFEST was still centered at 337 nm at 80°C, and in turn that the tryptophan residues in AFEST were still shielded to the solvent even at 80°C.19 The effect of temperature on EST2 and NATA fluorescence intensity is shown in the inset of Figure 6. Both the EST2 and NATA fluorescence intensities linearly decrease with temperature increase. However, the protein emission intensity decreases with increasing temperature to a smaller extent than NATA, corroborating our suggestion of a protected tryptophan environment from 25°C to 65°C. Figure 7 shows the effect of acrylamide on the fluorescence emission of EST2 at 25°C and 65°C. The addition of acrylamide to the enzyme solution at 25°C results in a linear Stern-Volmer plot. The calculated KSV and kq are 4.3 M−1 and 0.9 × 10⁹ M−1 sec−1, indicating that the EST2 indolic residues are about 10% accessible to the solvent at 25°C. The EST2 Stern-Volmer plot is still linear upon the addition of acrylamide to the protein at 65°C, and the calculated KSV and kq are 6.6 M−1 and 1.7 × 10⁹ M−1 sec−1, respectively. These results indicate that the protein tryptophan residues are shielded from the solvent at 65°C, that is the temperature at which the enzyme displays the maximal activity.20 Comparing the EST2 and AFEST acrylamide quenching results (see Fig. 7) it appears that both enzyme structures become more accessible to the solvent with increasing the temperature. At 25°C the AFEST structure is more rigid that the EST2 one and this may explain why AFEST is almost inactive at room temperature, and, on the contrary, EST2 can work quite well at low temperatures.33–36
Fig. 7.
Effect of acrylammide on the fluorescence emission of EST2 (closed symbols) and AFEST(opened symbols) at different temperatures. Acrylammide quenching of NATA at 25°C was adopted from Eftink and Ghiron,34 and data for AFEST were adopted from D’Auria et al.19 The Stern-Volmer plots were calculated according to Eftink.42
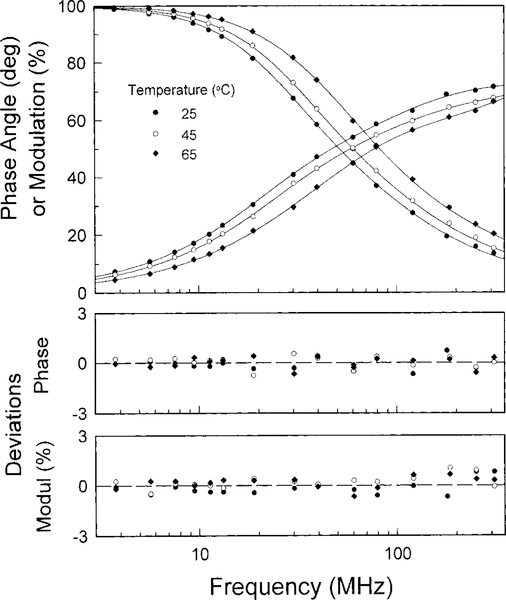
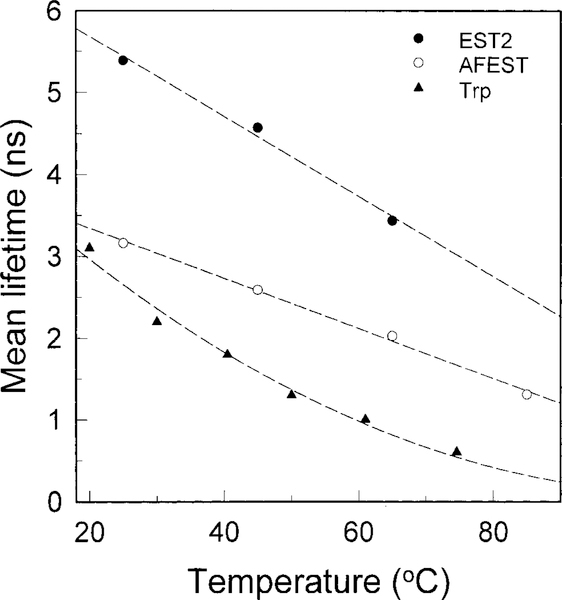
The intensity decays of the intrinsic fluorescence of EST2 were measured using the frequency-domain method.37,38 The data were analyzed in terms of the multi-exponential models and are shown in Figure 8. In all cases, the best fits were obtained using the three exponential model, characterized by reduced χ2 values that were much lower than those obtained with simpler models (data not shown). Figure 9 shows the temperature dependence of EST2 fluorescence decays mean lifetime. The mean lifetime values (see Materials and Methods section for the definition of mean lifetime) of EST2 at 25°C, 45°C, and 65°C are 5.3 ns, 4.6 ns, and 3.4 ns, respectively, and larger than those displayed from AFEST at the same temperatures (see Fig. 9). For both proteins the mean lifetimes are, at the investigated temperatures, longer than those exhibited from the aqueous tryptophan solution, indicating that the indolic residues in both enzymes are shielded from the solvent in the entire range of the investigated temperatures.16
Fig. 8.
Frequency dependence of the phase shift and demodulation factors of EST2 fluorescence emission at the indicated temperatures. The solid lines represent the best triple-exponential fits. Fluorescence was excited by a frequency-doubled rhodamine 6G dye laser at 298 nm and the absorbance of the enzyme solution was below 0.1 at the excitation wavelength. Emission was selected by a Corning 7–60 and cut-off 345 nm filters. The protein concentration was 0.05 mg/ml in 50 mM Tris-HCl, 2.5 mM MgCl2, 0.5 mM EDTA, 1 mM DTT buffer, pH 7.1.
Fig. 9.
Effect of the temperature on the mean lifetime of EST2, AFEST, and tryptophan solution at pH 7.0 according to Robbins et al.44 The protein concentration was 0.05 mg/ml in 50 mM Tris-HCl, 2.5 mM MgCl2, 0.5 mM EDTA, 1 mM DTT buffer, pH 7.1.
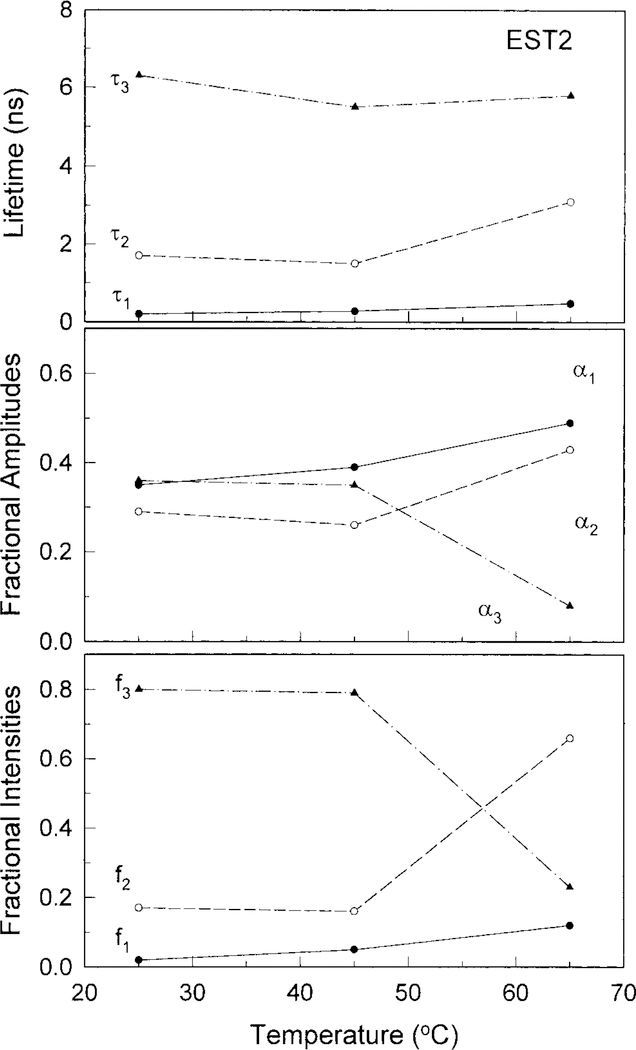
In Figure 10 are shown the temperature dependence of EST2 fluorescence decay parameters. At 25°C EST2 shows three lifetime components at 0.2 ns (τ1), 1.7 ns (τ2) and 6.3 ns (τ3). Increasing the temperature to 45°C results in a decrease of the middle-and long-lived components to 1.5 ns and 5.5 ns, respectively. On the other hand, the short-lived component (τ1) remains almost unchanged. Finally, at 65°C the enzyme displays the lifetime components at 0.48 ns, 3.1 ns, 5.8 ns, whose fluorescence intensity fractions are 12%, 66% and 23%, respectively. The observed changes in the fractional amplitude of EST2 fluorescence components with the temperature increase (Fig. 10) indicate the presence of different local environments of EST2 tryptophan residues. In particular, the decrease of the fractional amplitude of the longest component (α3) as well as the increase of the fractional amplitude of α1 and α2 suggest that EST2 possesses a more solvent-exposed structure at high temperatures.
Fig. 10.
Temperature dependence of EST2 fluorescence emission decay parameters. The experimental conditions were as described in Figure 8.
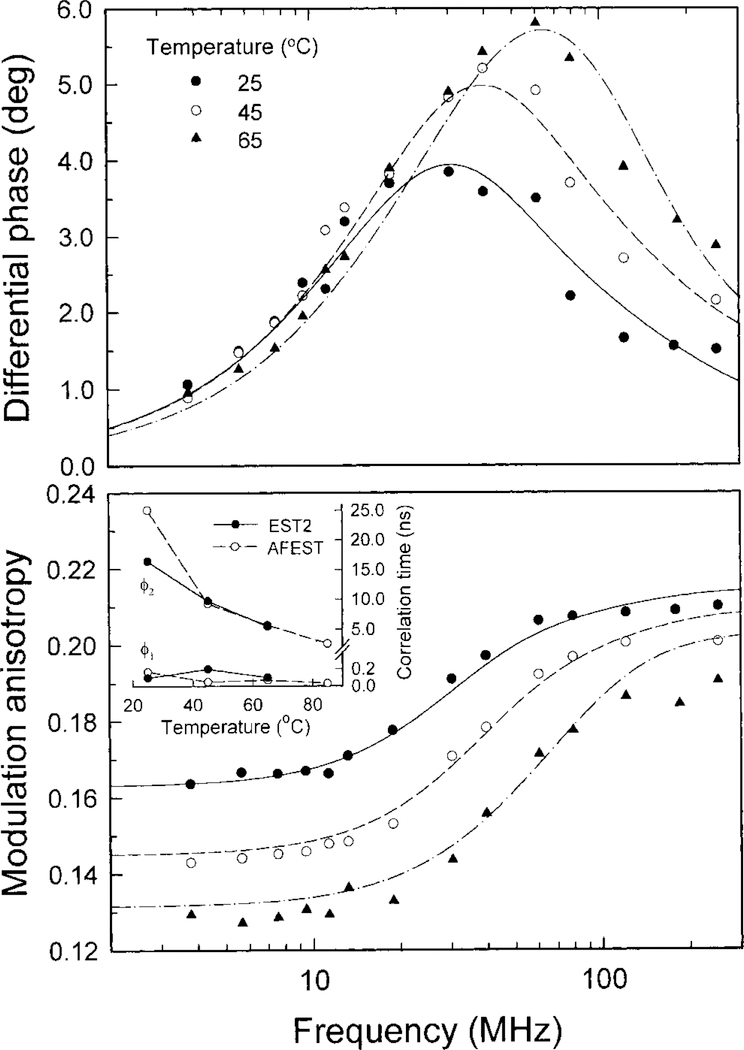
The frequency-domain anisotropy decays of EST2 are shown in Table I. The best fit was obtained by the two exponential model. Figure 11 depicts the anisotropy decays of EST2 at 25°C, 45°C, and 65°C.
TABLE I.
Fluorescence Anisotropy of the EST2 at Different Temperatures
| t (C°) | θk (ns) | δθk (ns)a | gkc | δgka | b |
|---|---|---|---|---|---|
| 25.0 | 0.01 | 0.01 | 0.26 | 0.01 | |
| 16.5 | −0.6, +0.7 | 0.74 | 0.01 | 1.8 | |
| 45.0 | 0.02 | −0.01,+0.006 | 0.28 | ||
| 9.8 | −0.2, +0.4 | 0.72 | −0.01,+0.007 | 1.4 | |
| 65.0 | 0.01 | −0.01,+0.004 | 0.29 | 0.01 | |
| 5.5 | 0.2 | 0.71 | 0.01 | 1.3 | |
Protein concentration 0.05 mg/ml in 50 mM Tris-HCl, 2.5 mM MgCl2, 0.5 mM EDTA, 1 mM DTT buffer, pH 7.1.
Standard deviations calculated by the Monte Carlo method.
For experimental uncertainties δp = 0.2 deg and δm = 0.005.
For λexc = 298 nm the r0 was fixed to the value of 0.29.42
Fig. 11.
Frequency-domain anisotropy decays of tryptophan emission of EST2 at the indicated temperatures. The differential phases and the modulated anisotropies are shown in the upper and lower panels, respectively. The lines represent the best double correlation time fits. The temperature-dependent correlation times of EST2 and AFEST are shown in the inset.
At 25°C the two-exponential anisotropy decays indicate both local motions of EST2 tryptophanyl residues and flexibility degree of the side-chains of the macromolecule. The short one is associated with the local freedom of the tryptophanyl residues, as described in several studies of anisotropy decays of proteins.39–42 The longer correlation time near 16 ns can be associated both with the overall rotation of the protein and with segmental motions of the side-chains of EST2. When the temperature is increased the long correlation times component becomes shorter, suggesting a gradual increase of the overall flexibility of the protein structure. This conclusion is supported by the gradual increase in the fraction of the shortest correlation time (see Table I).
The inset in Figure 11 shows the comparison of the correlation times for EST2 and AFEST at different temperatures. At 25°C EST2 displays a significantly lower value of the longer correlation time component (Φ2) than AFEST, corroborating the hypothesis of a more flexible structure of EST2 at low temperatures. From 45°C the longer correlation times (Φ2) of EST2 almost coincide with those shown by AFEST, suggesting that both enzymes may show similar segmental dynamics motions. The short correlation lifetime of the both proteins is almost the same at the all investigated temperatures, indicating that the enzymes may show comparable dynamics of the tryptophanyl local motions.
CONCLUSIONS
EST2 is a thermophilic and thermostable esterase from the eubacterium Bacillus acidocaldarius. It is a monomeric protein with a molecular mass of 34 Kda, containing four tryptophan residues. The enzyme was characterized towards different substrates and inhibitors and it was demonstrated to be a “B”-type carboxylesterase.20
In this study we have investigated the structural as well as the thermal characteristics of EST2 by using FT-IR spectroscopy and time-resolved fluorescence, and compared the results with those obtained from the esterase from the hyperthermophilic archaeon Archaeoglobus fulgidus (AFEST).19
Our results show that EST2 possesses a secondary structure rich in α-helices as described for AFEST.19 Moreover, the infrared spectra also indicate a higher accessibility of the solvent (2H2O) to EST2 than to AFEST,19 suggesting a less compact structure of the former enzyme which is also quite active at low temperatures.20
The fluorescence quenching data show that the structure of EST2 is still well conserved up to 65°C, and that the enzyme possesses a more solvent-exposed structure at low temperatures than AFEST. Moreover, the observed changes in the fluorescence and anisotropy decays induced by the temperature indicate that the structure of EST2 is more flexible at room temperature than AFEST one. The higher flexibility of EST2 correlates with its unusual activity at low temperatures. These observations are in agreement with the data showed by Manco et al.20 Finally, our results are also in good agreement with other investigations on the conformational dynamics of thermophilic enzymes. In particular, recently it has been demonstrated that the β-glycosidase from the hyperthermophilic archaeon Sulfolobus solfataricus possesses a quite rigid structure at room temperature (at which it is almost inactive).36 Moreover, Varley and Pain showed that while at a given temperature the 3-phosphoglycerate kinase from Thermus thermophilus was more stable, its conformational dynamics as well as the specific activity were lower than the mesophilic counterpart. These results suggested a direct relationship between conformational dynamics and specific activity in globular proteins.43
ACKNOWLEDGMENTS
This work was supported by a contract from European Community “Extremophiles” and by the National Center for Research Resource, NIH RR-08119 and by the PRIN 99 Project (E.B., F.T., and M.R.).
Abbreviations:
- FT-IR
Fourier transform infrared
- Amide I’
amide I band in 2H2O medium
- NATA
N-acetyltryptophanylamide
- TM
temperature of maximum denaturation
- EST2
esterase from Bacillus acidocaldarius
- AFEST
esterase from Archaeglobus fulgidus
REFERENCES
- 1.Stetter KO. The lessons of archaebacteria. In: Bengston S, editor. Early life on earth. Nobel Symposium 84. New York: Columbia University Press; 1993. p 101–109. [Google Scholar]
- 2.Stetter KO, Fiala G, Huber R, Segerer A. Hyperthermophilic microorganisms FEMS Microbiol Rev 1990:75:117–124. [Google Scholar]
- 3.Adams MWW. Enzymes and proteins from organisms that grow near and above 100 °C. Annu Rev Microbiol 1993;47:627–658. [DOI] [PubMed] [Google Scholar]
- 4.D’Auria S, Moracci M, Febbraio F, Tanfani F, Nucci R, Rossi M. Structure-function studies on ß-glycosidase from Sulfolobus solfataricus. Molecular bases of thermostability. Biochimie 1998;80: 949–957. [DOI] [PubMed] [Google Scholar]
- 5.Van den Burg B, Vriend G, Veltman OR, Vemma G, Eijsink VGH. Engineering an enzyme to resist boiling. Proc Natl Acad Sci 1998;95:2056–2060. [DOI] [PMC free article] [PubMed] [Google Scholar]
- 6.Cowan DA. Enzymes from thermophilic archaebacteria: current and future applications in biotechnology. Biochem Soc Symp 1992;58:149–169. [PubMed] [Google Scholar]
- 7.Kraut J. How do enzymes work? Science 1988:242:533–540. [DOI] [PubMed] [Google Scholar]
- 8.Perutz MF, Raidt H. Stereochemical basis of heat stability in bacterial ferredoxins and in hemoglobin A2. Nature 1975;255:256–259. [DOI] [PubMed] [Google Scholar]
- 9.Goldman A. How to make my blood boil. Structure 1995;3:1277–1279. [DOI] [PubMed] [Google Scholar]
- 10.Baumann H, Knapp S, Lundback T, Ladenstain R, Hrd T. Solution structure and DNA binding properties of a thermostable protein from the archaeon Sulfolobus solfataricus Nat Struct Biol 1994;1:808–819. [DOI] [PubMed] [Google Scholar]
- 11.Yip KSP, Stillman TJ, Britton KL, et al. The structure of Pyrococcus furiosus glutamate dehydrogenase reveals a key role for ion-pairs networks in maintaining enzyme stability at extreme temperatures, Structure 1995;3:1147–1158. [DOI] [PubMed] [Google Scholar]
- 12.Tang KES, Dill KA. Native protein fluctuations: the conformational motions temperature and the inverse correlation of protein flexibility with protein stability. J Biomol Struct Dyn 1998;16:397–410. [DOI] [PubMed] [Google Scholar]
- 13.Tilton RF, Dewan JC, Petsko GA. Biochemistry 1992;31:2469–2481. [DOI] [PubMed] [Google Scholar]
- 14.Daniel RM, Dines M, Petach HH. The denaturation and degradation of stable enzymes at high temperature. Biochem J 1996;317: 1–11. [DOI] [PMC free article] [PubMed] [Google Scholar]
- 15.Hiller R, Zhon ZH, Adams MMW, Englander SW. Stability and dynamics in a hyperthermophilic protein with melting point close to 200°C. Proc Natl Acad Sci 1997;94:11329–11332. [DOI] [PMC free article] [PubMed] [Google Scholar]
- 16.Lakowicz JR. In: Principles of fluorescence spectroscopy. New York: Plenum Press; 1999. [Google Scholar]
- 17.Eftink MR, Jia Y, Hu D, Ghiron C. Fluorescence studies with tryptophan analogues: excited state interactions involving the side-chain amino groups. J Phys Chem 1995;99:5713–5723. [Google Scholar]
- 18.Hong-Tao Y, Vela M, Fronczek F, Mc Laughim M, Barkley MD. Micro-environmental effects on the solvent quenching rate in constrained tryptophan derivatives. J Am Chem Soc 1995;117:348–358. [Google Scholar]
- 19.D’Auria S, Herman P, Lakowicz JR, Bertoli E, Tanfani F, Rossi M, Manco G. The thermophilic esterase from Archaeoglobus fulgidus: structure and conformational dynamics at high temperature. Proteins 2000;38:351–360. [DOI] [PMC free article] [PubMed] [Google Scholar]
- 20.Manco G, Adinolfi E, Pisani FM, Ottolina G, Carrea G, Rossi M. Overexpression and properties of a new thermophilic and thermostable esterase from Bacillus acidocaldarius with sequence similarity to hormone-sensitive lipase subfamily. Biochem J 1998;332: 203–212. [DOI] [PMC free article] [PubMed] [Google Scholar]
- 21.Bradford MM. A rapid and sensitive method for the quantification of microgram quantities of protein utilizing the principle of protein-dye binding. Anal Biochem 1976;72:248–254. [DOI] [PubMed] [Google Scholar]
- 22.Lakowicz JR, Gryczynski I. Frequency-domain fluorescence spectroscopy In: Topics in Fluorescence Spectroscopy, Volume 1: Techniques. New York: Plenum Press; 1991. p 293–335. [Google Scholar]
- 23.Lakowicz JR, Cherek H, Kusba J, Gryczynski I, Johnson ML. Review of fluorescence anisotropy decay analysis by frequency-domain fluorescence spectroscopy. J Fluoresc 1993;3:103–116. [DOI] [PubMed] [Google Scholar]
- 24.Osborne HB, Nabedryk-Viala E. Infrared measurements of peptide hydrogen exchange in rhodopsin. Methods Enzymol 1982;88: 676–680. [Google Scholar]
- 25.Chirgadze YN, Fedorow OW, Trushina NP. Estimation of amino acid residue side-chain absorption in the infrared spectra of proteinsolutions inheavywater. Biopolymers 1975;14:679–694. [DOI] [PubMed] [Google Scholar]
- 26.Arrondo JLR, Muga A, Castresana J, Goñi FM. Quantitative studies of the structure of proteins in solutions by Fourier-transform infrared spectroscopy. Prog Biophys Mol Biol 1993;59:23–56. [DOI] [PubMed] [Google Scholar]
- 27.Krimm S, Bandekar J. Vibrational spectroscopy and conformation of peptides, polypeptides, and proteins. Adv Protein Chem 1986;38: 181–364. [DOI] [PubMed] [Google Scholar]
- 28.Lee DC, Haris PI, Chapman D, Mitchell R. Determination of protein secondary structure using factor analysis of infrared spectra. Biochemistry 1990;29:9185–9193. [DOI] [PubMed] [Google Scholar]
- 29.D’Auria S, Barone R, Rossi M, et al. Effects of temperature and SDS on the structure of ß-glycosidase from the thermophilic archaeonSulfolobussolfataricus. Biochem J 1997;323:833–840. [DOI] [PMC free article] [PubMed] [Google Scholar]
- 30.Banecki B, Zylicz M, Bertoli E, Tanfani F. Structural and functional relationships in DnaK and DnaK756 heat-shock proteins from Escherichia coli. J Biol Chem 1992;267:25051–25058. [PubMed] [Google Scholar]
- 31.Tanfani F, Kulawiak D, Kossowska E, et al. Structural-functional relationships in pig hearth AMP-deaminase in the presence of ATP, orthophosphate, and phosphatidate bilayers. Mol Genet Metabol 1998;65:51–58. [DOI] [PubMed] [Google Scholar]
- 32.Surewicz WK, Mantsch HH, Chapman D. Determination of protein secondary structure by Fourier transform infrared spectroscopy: a critical assessment. Biochemistry 1993;32:389–394. [DOI] [PubMed] [Google Scholar]
- 33.Eftink MR, Ghiron CA. Exposure of tryptophanyl residues in proteins. Quantitative determination by fluorescence quenching studies. Biochemistry 1976;15:672–680. [DOI] [PubMed] [Google Scholar]
- 34.Eftink MR, Ghiron CA. Fluorescence quenching of indole and model micelle systems. J Phys Chem 1976;80:486–493. [Google Scholar]
- 35.Eftink MR, Ghiron CA. Does the fluorescence quencher acrylamide bind to proteins? Biochim Biophys Acta 1987;916:343–349. [DOI] [PubMed] [Google Scholar]
- 36.D’Auria S, Nucci R, Rossi M, Gryczniski I, Gryczniski Z, Lakowicz JR. The ß-glycosidase from the hyperthermophilic archaeon Sulfolobus solfataricus: enzyme activity and conformational dynamics at temperatures above 100°C. Biophys Chem 1999;81:23–31. [DOI] [PubMed] [Google Scholar]
- 37.Lackzo G, Gryczyniski I, Wiczk W, Malak H, Lakowicz JR. A 10 GHz frequency-domain fluorometer. Rev Sci Instrum 1990;61: 9231–9237. [Google Scholar]
- 38.Lakowicz JR, Lackzo G, Cherek H, Gratton E, Limkeman H Analysis of fluorescence decay kinetic from variable frequency phase shifts and modulation data. Biophys J 1984; 46:463–477. [DOI] [PMC free article] [PubMed] [Google Scholar]
- 39.Lakowicz JR, Cherek H, Maliwal B, Gratton E. Time-resolved fluorescence anisotropies of fluorophores in solvents and lipid bilayers obtained from frequency-domain phase modulation fluorometry Biochemistry;1985:376–383. [DOI] [PMC free article] [PubMed] [Google Scholar]
- 40.Lakowicz JR, Gryczniski I, Cherek H, Lackzo G. Anisotropy decays of indole, mellitin monomer and mellitin tetramer by frequency-domain fluorometry and multi-wavelength global analysis. Biophys Chem 1991;39:241–251. [DOI] [PubMed] [Google Scholar]
- 41.Lakowicz JR, Gryczniski I, Szmacinski H, Cherek H, Joshi N. Anisotropy decays of single tryptophan proteins measured by GHz frequency-domain fluorometry with collisional quenching. Eur J Biophys 1991;19:125–140. [DOI] [PMC free article] [PubMed] [Google Scholar]
- 42.Eftink MR, Selvidge LA, Callis PR, Rehms AA. Photophysics of indole derivatives: Experimental resolution of 1La and 1Lb transitions and comparison with theory. J Phys. Chem 1990;94:3469–3479. [Google Scholar]
- 43.Varley PG, Pain RH. Relation between stability, dynamics and enzyme activity in 3-phosphoglycerate kinases from yeast and Thermus thermophilus. J Mol Biol 1991;220: 531–538. [DOI] [PubMed] [Google Scholar]
- 44.Robbins RJ, Fleming GR, Beddard GS, Robinson GW, Thisleth-waite PJ, Woolfe GJ. Photophysics of aqueus tryptophan: pH and temperature effects. J Am Chem Soc 1980; 102:6271–6280. [Google Scholar]


