Abstract
Objective
To assess risks and costs of hospital admission associated with short term exposure to fine particulate matter with diameter less than 2.5 µm (PM2.5) for 214 mutually exclusive disease groups.
Design
Time stratified, case crossover analyses with conditional logistic regressions adjusted for non-linear confounding effects of meteorological variables.
Setting
Medicare inpatient hospital claims in the United States, 2000-12 (n=95 277 169).
Participants
All Medicare fee-for-service beneficiaries aged 65 or older admitted to hospital.
Main outcome measures
Risk of hospital admission, number of admissions, days in hospital, inpatient and post-acute care costs, and value of statistical life (that is, the economic value used to measure the cost of avoiding a death) due to the lives lost at discharge for 214 disease groups.
Results
Positive associations between short term exposure to PM2.5 and risk of hospital admission were found for several prevalent but rarely studied diseases, such as septicemia, fluid and electrolyte disorders, and acute and unspecified renal failure. Positive associations were also found between risk of hospital admission and cardiovascular and respiratory diseases, Parkinson’s disease, diabetes, phlebitis, thrombophlebitis, and thromboembolism, confirming previously published results. These associations remained consistent when restricted to days with a daily PM2.5 concentration below the WHO air quality guideline for the 24 hour average exposure to PM2.5. For the rarely studied diseases, each 1 µg/m3 increase in short term PM2.5 was associated with an annual increase of 2050 hospital admissions (95% confidence interval 1914 to 2187 admissions), 12 216 days in hospital (11 358 to 13 075), US$31m (£24m, €28m; $29m to $34m) in inpatient and post-acute care costs, and $2.5bn ($2.0bn to $2.9bn) in value of statistical life. For diseases with a previously known association, each 1 µg/m3 increase in short term exposure to PM2.5 was associated with an annual increase of 3642 hospital admissions (3434 to 3851), 20 098 days in hospital (18 950 to 21 247), $69m ($65m to $73m) in inpatient and post-acute care costs, and $4.1bn ($3.5bn to $4.7bn) in value of statistical life.
Conclusions
New causes and previously identified causes of hospital admission associated with short term exposure to PM2.5 were found. These associations remained even at a daily PM2.5 concentration below the WHO 24 hour guideline. Substantial economic costs were linked to a small increase in short term PM2.5.
Introduction
Particulate matter (PM) is a mixture of solid and liquid particles with aerodynamic diameter smaller than 2.5 µm (PM2.5) and between 2.5 and 10 µm (PM10-2.5), respectively known as fine and coarse particles. PM2.5 particles are smaller than PM10-2.5 particles but have a larger surface area to volume ratio. Thus PM2.5 can carry more toxic pollutants and pass through the lung into the bloodstream.1 2 3 In 2005, the World Health Organization set the air quality guideline for 24 hour average exposure to PM2.5 at 25 µg/m3.4 The guideline is being reviewed and expected to be published in 2020. Scientific evidence supporting update of the guideline is subject to an unprecedented level of scrutiny.5
Previous studies have primarily focused on either long term or short term exposure to PM2.5.6 7 8 9 10 11 12 13 14 15 16 In the Global Burden of Disease Study 2017, long term exposure to PM2.5 was assessed extensively and considered to be a leading risk of global disease burden from lower respiratory infections, ischemic heart disease, chronic obstructive pulmonary disease, lung cancer, and diabetes mellitus.17 Short term exposure to PM2.5 is also associated with adverse health effects, including cardiovascular and respiratory diseases, diabetes, neurological diseases, and deep vein thrombosis, among others.9 10 11 12 13 14 15 16 However, a comprehensive analysis investigating associations between short term exposure to PM2.5 and all possible diseases is lacking. Such an investigation is needed to discover associations between short term exposure to PM2.5 and other prevalent but rarely studied diseases, and to thoroughly evaluate the corresponding healthcare costs. Cost-benefit analyses considering only cardiovascular and respiratory diseases could underestimate the costs of the impact of PM2.5 on health if other diseases are not negligible.
We analyzed 95 277 169 Medicare inpatient claims of all fee-for-service beneficiaries in the United States during 2000-12. We classified all plausible causes of hospital admission into 214 mutually exclusive disease groups to estimate the increased risk of admission and the corresponding costs associated with 1 µg/m3 increase in short term exposure to PM2.5 for each disease group.
Methods
Medical data
We obtained Medicare inpatient claims from January 1, 2000 to December 31, 2012 from the Medicare Provider Analysis and Review (MEDPAR) file. From each claim, we extracted the following details:
Admission date
Principal discharge ICD-9 (international classification of diseases, 9th revision) code
Number of days in hospital
Unfavorable discharge destinations (that is, death at discharge, discharge to skilled nursing facilities, or home healthcare services)
Diagnosis related group (DRG) price (payment due to healthcare providers determined by DRG, if there are no deductibles, co-insurance, primary payers, or outliers)
DRG outlier amount (additional amount approved because an outlier exceeded the DRG price)
Pass through amount (established reimbursable costs in the current year divided by estimated Medicare days multiplied by MEDPAR use day count) in US dollars ($).
The sum of DRG price, DRG outlier, and pass through amounts corresponded to the payment due to the healthcare provider, made by Medicare, beneficiary, and primary payers. We used the zip code of residence from the Medicare enrollment file to link each beneficiary with daily exposures to PM2.5 and covariates. We restricted our analysis to urgent or emergent hospital admissions and excluded scheduled admissions. These admissions totaled 95 277 169 during the 2000-12 study period.
We applied the Clinical Classification Software (CCS) scheme to more than 15 000 ICD-9 principal diagnosis codes at discharge to classify hospital admissions into clinically meaningful and mutually exclusive disease groups.18 The CCS scheme is a comprehensive classification tool for clustering diagnoses into a manageable number of categories on the basis of disease characteristics and treatment protocol, and is widely used to analyze disease specific conditions.19 20 21 We excluded diseases that are biologically implausible for adults aged 65 or older, including certain conditions originating in the perinatal period, female infertility, complications of pregnancy, childbirth, and puerperium.19 We included injury and poisoning as a negative outcome control owing to the lack of biological plausibility of associating these hospital admissions with exposure to PM2.5. Use of a negative outcome control allows identification of residual confounding.22 In total, we analyzed 214 mutually exclusive disease groups (that is, 214 outcomes). A full list of CCS categories and the corresponding ICD-9 diagnosis codes can be found on the healthcare cost and utilization project website.23
Environmental data
We estimated daily PM2.5 levels at each 1×1 km grid cell in the continental US for years 2000-12 using a well validated, satellite based, neural network model.24 The model was calibrated using daily PM2.5 concentrations measured at 1928 monitoring sites by the US Environmental Protection Agency (US EPA), with excellent out-of-sample prediction ability (overall cross validated R2 of 0.83, 0.78-0.88 by region and 0.74-0.89 by year), using previously published methodology.24 25 We have included predictors for daily PM2.5 used in this model in section 1 of the supplementary appendix. We used the same approach as Di et al—namely, short term exposure to PM2.5 as the average PM2.5 on the same and previous days of each hospital admission (lag 0-1).25 Meteorological variables, including daily air and dew point temperatures, were obtained from the National Center for Environmental Prediction/National Center for Atmospheric Research reanalysis project at each 32×32 km grid cell in the continental US.26
We assigned short term exposure to PM2.5 (lag 0-1) and air and dew point temperatures to each person based on their zip code of residence. Specifically, we gathered latitude and longitude of centroid of each person’s zip code of residence. Using the latitude and longitude, we linked the zip code of residence to the closest 1×1 km PM2.5 grid cell and the closest 32×32 km temperature grid cell. We then assigned the linked grid cell PM2.5 exposure and air and dew point temperatures to that person.
Statistical analysis
In the main analysis, for each disease group, we estimated percentage and absolute increases in cause specific risk of hospital admission associated with each 1 µg/m3 increase in lag 0-1 PM2.5 using a time stratified, case crossover analysis. This well established approach estimates acute health effects of exposure and has been widely applied to estimate associations between short term exposure to air pollution and health outcomes.10 13 16 25 27 28
For each disease group, we created a case crossover dataset. We defined a case day as the date of hospital admission. For each case day, we identified matched control days as days with the same zip code of residence (same person), day of the week (before and after the case day), month, and year. Self matching by the same month and year controlled for confounding variables that do not change markedly within a month. These variables include age, race, sex, body mass index, diet, and other time invariant behavior factors, and also zip code level variables, such as socioeconomic status, population density, area level measure of ethnicity, and access to parks, food, and drug stores. Matching by day of the week controlled for potential confounding that varies within a week, such as weekday/weekend differences in air pollution and rates of hospital admissions, with bidirectional selection of control days before and after the case day to remove potential bias induced by long term time trends of PM2.5.29 Matching by month controlled for potential confounding by seasonality, and matching by year controlled for potential confounding by long term time trends.30
For each of the 214 case crossover datasets, we used a conditional logistic regression model to estimate associations between short term exposure to PM2.5 (lag 0-1) and risk of hospital admission. The model was adjusted for potential non-linear confounding effects of air and dew point temperatures during lag 0-1 by including penalized cubic splines, with at most nine degrees of freedom each.31 Methodology and computation details are presented in section 2 of the supplementary appendix.
Percentage and absolute increases in cause specific risk of hospital admission associated with an increase in short term exposure to PM2.5
For each of the 214 disease groups, denoted by c, we estimated the percentage increase in risk of admission to hospital (pc) associated with each 1 μg/m3 increase in lag 0-1 PM2.5 (95% confidence interval pc,low to pc,high), adjusting for multiple comparisons using the Bonferroni correction.19 Corresponding absolute increase in risk of hospital admission for each 1 μg/m3 increase in lag 0-1 PM2.5 was calculated with the same method as that used by Di et al.25 Details are provided in section 3 of the supplementary appendix.
Increase in number of hospital admissions and days in hospital associated with an increase in short term exposure to PM2.5
For each of the 214 disease groups (denoted by c) and for each 1 μg/m3 increase in lag 0-1 PM2.5, we estimated the annual increase in the number of admissions to hospital as pcNc (pc,lowNc to pc,highNc), where Nc is annual average number of hospital admissions; and the number of days in hospital as pcNcLc (pc,lowNcLc to pc,highNcLc), where Lc is the average number of days in hospital for each admission. Details of calculations for increases in numbers of admissions by discharge destination are given in section 4 of the supplementary appendix.
Increase in healthcare costs and value of statistical life associated with an increase in short term exposure to PM2.5
We estimated the annual increase in healthcare costs (inpatient and post-acute care) associated with each 1 μg/m3 increase in lag 0-1 PM2.5 as pcNc(Kc+Pc) (pc,lowNc(Kc+Pc) to pc,highNc(Kc+Pc)) in 2017 dollars,32 where Kc denotes the average inpatient costacross all admissions for disease group c and is defined as the sum of DRG price, DRG outlier, and pass through amounts based on the inpatient claim.33 The variable Pc denotes the average post-acute care costacross all admissions for disease group c and is defined as the sum of cause specific proportion of discharges to skilled nursing facilities multiplied by the average cost ($12 871, adjusted for inflation from the average cost in 2016)34; cause specific proportion of discharges to home healthcare services multiplied by the average cost ($3040 adjusted for inflation from the average cost in 2016)34; and additional outpatient and physician payment during the year after discharge, which was assigned to admissions of patients with acute myocardial infarction ($14 495, adjusted for inflation from 2009 estimates) and congestive heart failure ($14 024 adjusted for inflation from 2009 estimates) owing to the availability of data sources.35 The economic costs of the annual increase of deaths at discharge were calculated by multiplying the annual increase of deaths at discharge by the value of statistical life (V, which is equal to $10.4m 2017 dollars (estimated from $7.4m 2006 dollars, as suggested by the US EPA).36
Among the disease groups found to be statistically significantly associated with short term exposure to PM2.5, the annual increases in number of hospital admissions, days in hospital, and healthcare costs (inpatient and post-acute care) were gathered together for the newly identified disease groups and those identified from previous studies, separately. Details of the calculations are provided in section 5 of the supplementary appendix.
To assess the association between short term exposure to PM2.5 and cause specific risk of hospital admission below the WHO air quality guideline for the 24 hour PM2.5 values, we conducted a below-guideline analysis for each disease group. This analysis used the same model specifications as the main analysis but was restricted to days with daily PM2.5 concentration of 25 μg/m3 or less.
Sensitivity analyses
We assessed the robustness of the results in the main analysis by conducting sensitivity analyses with respect to the definition of the lags in the exposure for air and dew point temperatures (from lag 0-1 to lag 0-6). Single lag models were fitted with the exposure of daily PM2.5 concentrations on lag 0, 1, and 2. In addition, confidence intervals corrected for false discovery rate were reported, with critical significance level at P<0.05.37
Some related disease groups might share a similar PM2.5 pathogenic effect. To reduce the potential overlap of disease groups and diagnostic misclassifications, we categorized hospital admissions into 122 broader disease categories.38 Details of these groups are provided in section 6 of the supplementary appendix. For each broader disease group, we carried out the entire statistical analysis again, including main analysis, below-guideline analysis, and sensitivity analyses, and estimated the percentage and absolute increases in risk of hospital admission associated with each 1 µg/m3 increase in lag 0-1 PM2.5.
Patient and public involvement
We analyzed all Medicare inpatient claims during 2000-12 through de-identified data files available for public use. No patients were involved in implementing the study design. We will craft press releases that will adequately disseminate the research findings to the relevant patient groups, such as the American Association of Retired Persons. We will also share the findings with a larger audience, including members of the public, patients, and health professionals through the Harvard T H Chan School of Public Health website and other Harvard publications, networks, and social media.
Results
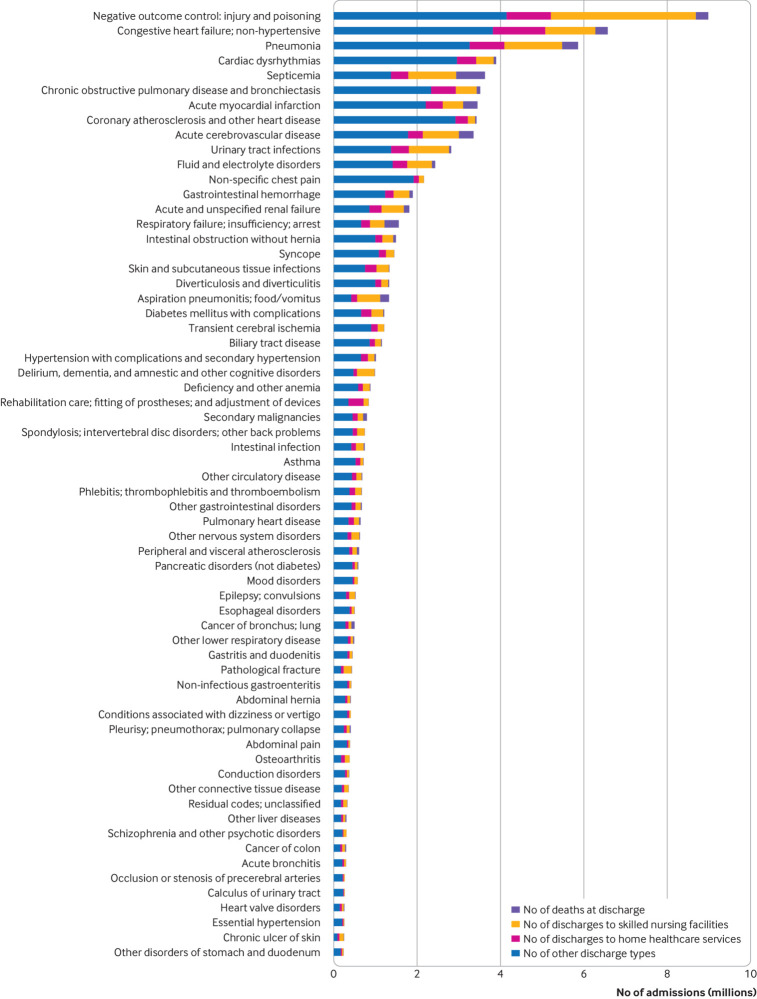
The most prevalent (top 30%) causes of hospital admissions were injury and poisoning, congestive heart failure, pneumonia, cardiac dysrhythmias, and septicemia (fig 1). Figure S1 (https://nsaph.shinyapps.io/cause_specific_viz/) shows descriptive statistics for each of the 214 disease groups.
Fig 1.
Descriptive statistics for the top 30% prevalent disease groups during 2000-12 among Medicare fee-for-service beneficiaries in the United States. Total number of hospital admissions, according to discharge destination (deaths at discharge, discharges to skilled nursing facilities, discharges to home healthcare services, and other discharge destinations). Figure S1 in the supplementary online contents provides descriptive statistics for each of the 214 disease groups
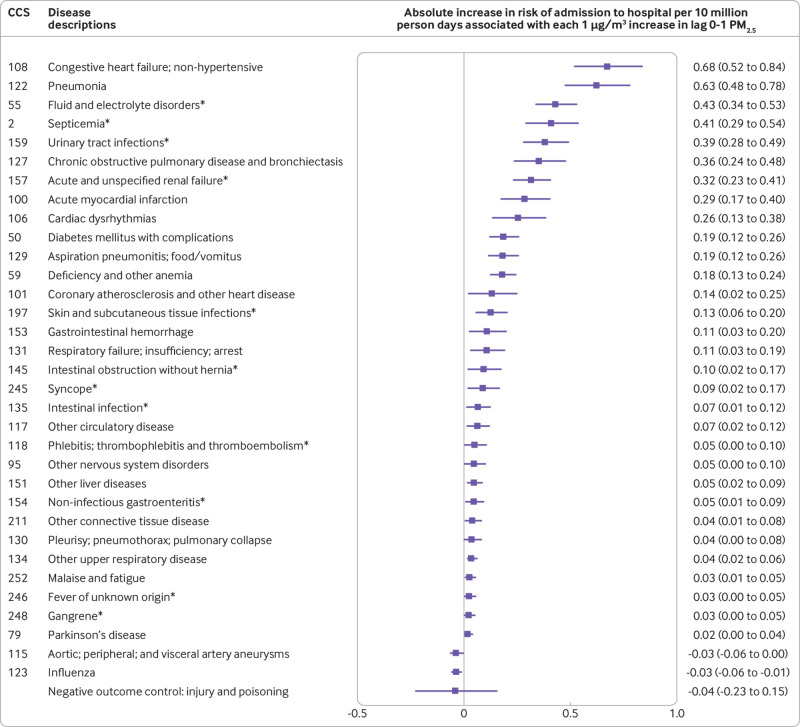
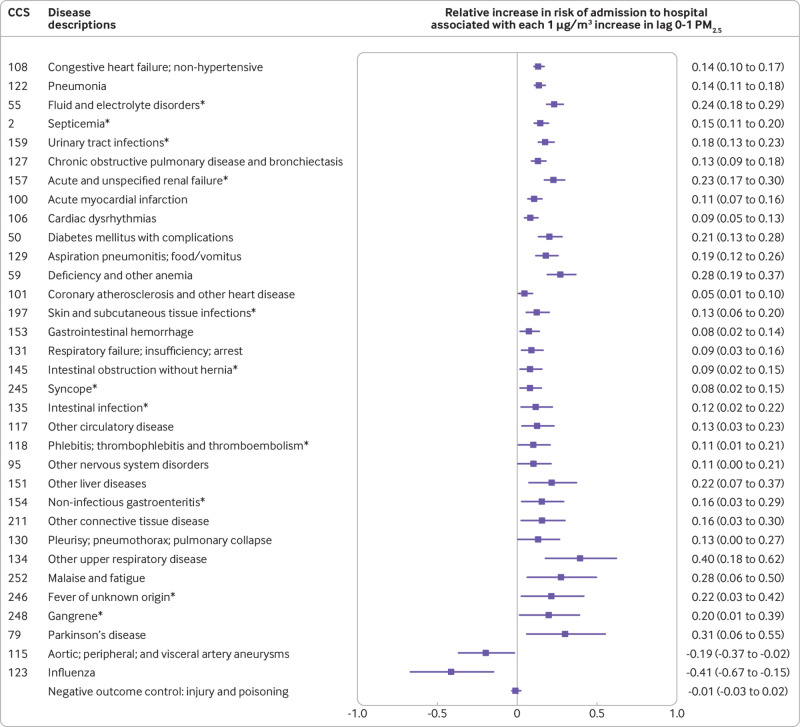
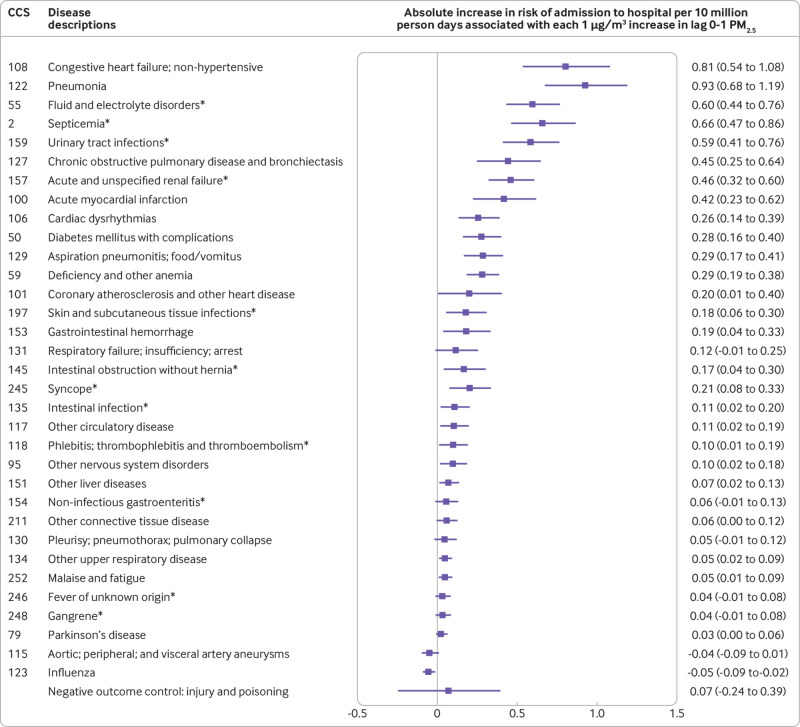
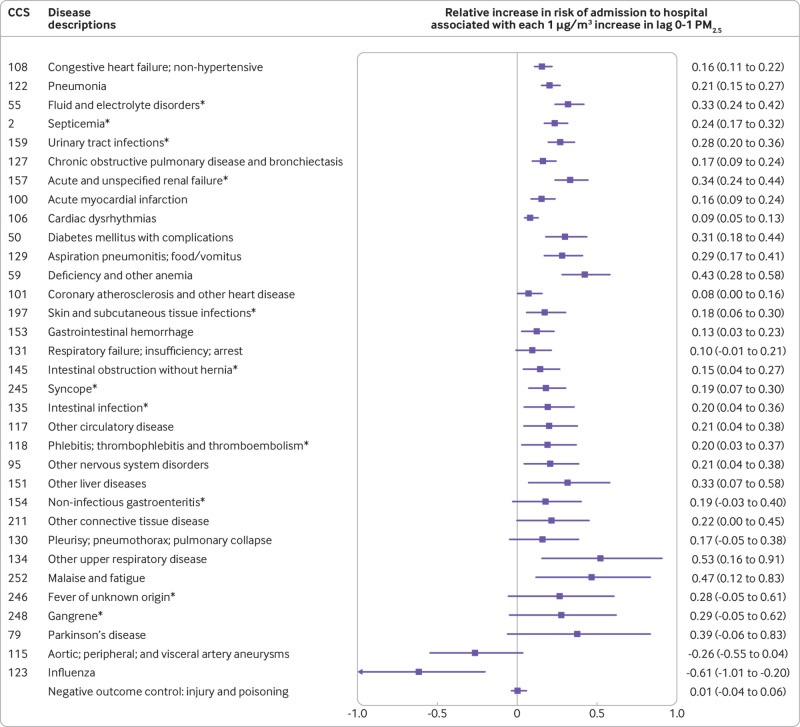
We found that several prevalent but rarely studied disease groups were associated with short term exposure to PM2.5, including septicemia (CCS code 2), fluid and electrolyte disorders (CCS code 55), acute and unspecified renal failure (CCS code 157), urinary tract infections (CCS code 159), and skin and subcutaneous tissue infections (CCS code 197) (fig 2 and fig 3).Further, we confirmed positive associations, consistent with previous studies, between short term exposure to PM2.5 and several disease groups, including non-hypertensive congestive heart failure (CCS code 108); pneumonia (CCS code 122); chronic obstructive pulmonary disease and bronchiectasis (CCS code 127); acute myocardial infarction (CCS code 100); cardiac dysrhythmias (CCS code 106); coronary atherosclerosis and other heart disease (CCS code 101); respiratory failures, insufficiency, or arrest (CCS code 131); Parkinson’s disease (CCS code 79); diabetes mellitus with complications (CCS code 50); and phlebitis, thrombophlebitis, and thromboembolism (CCS code 118). For each 1 µg/m3 increase in lag 0-1 PM2.5, the absolute increase in risk of hospital admissions for these disease groups ranged from 0.02 to 0.68 per 10 million people at risk per day (fig 2), and the relative percentage increase in risk of these hospital admissions ranged from 0.05% to 0.40% (fig 3). By comparison, absolute and relative percentage increases in risk of admissions due to injury and poisoning, the negative outcome control, were −0.04% (95% confidence interval −0.23% to 0.15%; fig 2) and −0.01% (−0.03% to 0.02%; fig 3) per 10 million people at risk per day, which were not significant. We found negative associations for influenza (CCS code 123) and aortic, peripheral, and visceral artery aneurysms (CCS code 115). Figure S2 shows the percentage and absolute increases in risk of hospital admission for each of the 214 disease groups.
Fig 2.
Main analysis showing absolute increases in risk of hospital admission, ordered from highest to lowest, associated with each 1 μg/m3 increase in lag 0-1 PM2.5. The main analysis was conducted in the case crossover study setting with lag 0-1 PM2.5 as the exposure, adjusted for penalized splines of lag 0-1 air and dew point temperatures for each disease group. The Bonferroni correction was used to adjust 95% confidence intervals for disease groups associated with lag 0-1 PM2.5 and negative outcome control (injury and poisoning). CCS=Clinical Classification Software code. *Indicates newly identified disease groups. Figure S2 in the supplementary online contents provides results for each of the 214 disease groups
Fig 3.
Main analysis showing relative percentage increases in risk of hospital admission associated with each 1 μg/m3 increase in lag 0-1 PM2.5. Disease groups are ranked from highest to lowest absolute increase in risk of hospital admission. The main analysis was conducted in the case crossover study setting with lag 0-1 PM2.5 as the exposure, adjusted for penalized splines of lag 0-1 air and dew point temperatures for each disease group. The Bonferroni correction was used to adjust 95% confidence intervals for disease groups associated with lag 0-1 PM2.5 and negative outcome control (injury and poisoning). CCS=Clinical Classification Software code. *Indicates newly identified disease groups. Figure S2 in the supplementary online contents provides results for each of the 214 disease groups
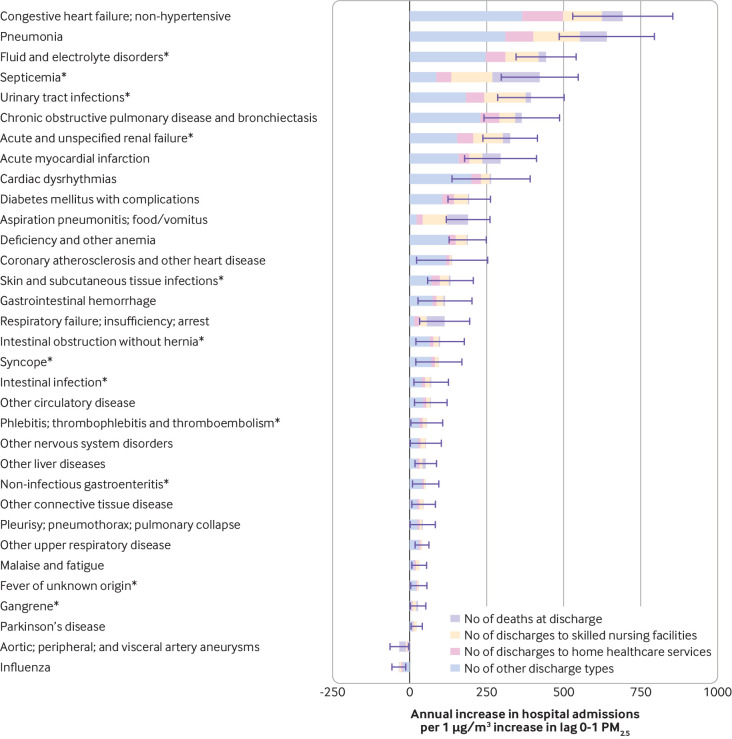
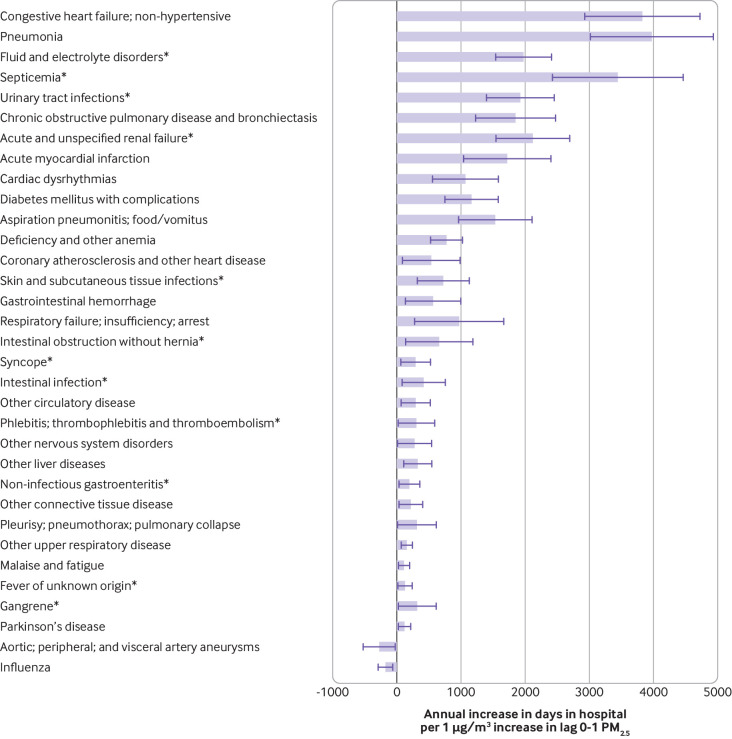
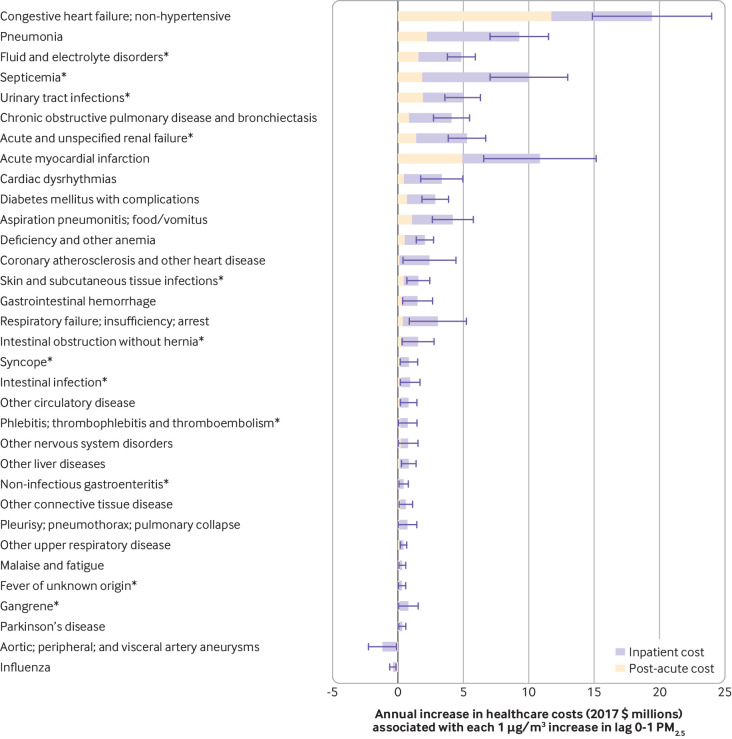
For the rarely studied disease groups that were significantly associated with short term exposure to PM2.5, we found that each 1 µg/m3 increase in lag 0-1 PM2.5 was associated with an average annual increase during the study of 2050 hospital admissions (95% confidence interval 1914 to 2187), including 237 deaths at discharge (193 to 281), 570 discharges to skilled nursing facilities (532 to 608), and 297 discharges to home healthcare services (277 to 317; fig 4); 12 216 days in hospital (11 358 to 13 075; fig 5); $31m ($29m to $34m) in inpatient and post-acute care costs (fig 6); and $2.5bn ($2.0bn to $2.9bn) in the value of statistical life due to the lives lost at discharge. For the disease groups that were previously identified and confirmed to be significantly associated with short term exposure to PM2.5, we found that each 1 µg/m3 increase in lag 0-1 PM2.5 was associated with an average annual increase in 2000-12of 3642 hospital admissions (3434 to 3851), including 397 deaths at discharge (340 to 453), 711 discharges to skilled nursing facilities (671 to 751), and 538 discharges to home healthcare services (508 to 568; fig 4); 20 098 days in hospital (18 950 to 21 247; fig 5); $69m ($65m to $73m) in inpatient and post-acute care costs (fig 6); and $4.1bn ($3.5bn to $4.7bn) in the value of statistical life due to the lives lost at discharge.
Fig 4.
Annual increase in hospital admissions associated with each 1 μg/m3 increase in lag 0-1 PM2.5, according to discharge destination (deaths at discharge, discharges to skilled nursing facilities, discharges to home healthcare services, and other discharge destinations). Disease groups are ranked from highest to lowest absolute increase in risk of hospital admission. Error bars show 95% confidence intervals for estimates of hospital admissions. *Indicates newly identified disease groups. Results are from the main analysis using the full dataset
Fig 5.
Annual increase in days in hospital associated with each 1 μg/m3 increase in lag 0-1 PM2.5. Disease groups are ranked from highest to lowest absolute increase in risk of hospital admission. Error bars show 95% confidence intervals for estimates of annual increase in days in hospital. *Indicates newly identified disease groups. Results are from the main analysis using the full dataset
Fig 6.
Annual increase in healthcare costs (inpatient and post-acute care) associated with each 1 μg/m3 increase in lag 0-1 PM2.5. Disease groups are ranked from highest to lowest absolute increase in risk of hospital admission. Error bars show 95% confidence intervals for estimates of annual increase in healthcare costs. *Indicates newly identified disease groups. Results are from the main analysis using the full dataset
When restricting the analysis to days with daily PM2.5 concentrations of 25 μg/m3 or less(that is, the below-guideline analysis), absolute and relative percentage increases in risk of hospital admission remained consistent with the main analysis for most disease groups (fig 7 and fig 8). Figure S2 shows the percentage and absolute increases in risk of hospital admission for each of the 214 disease groups from the below-guideline analysis.
Fig 7.
Below-guideline analysis showingabsolute increases in risk of hospital admission associated with each 1 μg/m3 increase in lag 0-1 PM2.5. Disease groups are ranked from highest to lowest absolute increase in risk of hospital admission. The below-guideline analysis used the same model specification as the main analysis and was restricted to days with daily PM2.5 concentrations ≤25 μg/m3 (WHO air quality guideline value for daily PM2.5). The Bonferroni correction was used to adjust 95% confidence intervals for disease groups associated with lag 0-1 PM2.5 and negative outcome control (injury and poisoning). CCS=Clinical Classification Software code. *Indicates newly identified disease groups. Figure S2 in the supplementary online contents provides results for each of the 214 disease groups
Fig 8.
Below-guideline analysis showing relative percentage increases in risk of hospital admission associated with each 1 μg/m3 increase in lag 0-1 PM2.5. Disease groups are ranked from highest to lowest absolute increase in risk of hospital admission. The below-guideline analysis used the same model specification as the main analysis and was restricted to days with daily PM2.5 concentrations ≤25 μg/m3 (WHO air quality guideline value for daily PM2.5). The Bonferroni correction was used to adjust 95% confidence intervals for disease groups associated with lag 0-1 PM2.5 and negative outcome control (injury and poisoning). CCS=Clinical Classification Software code. *Indicates newly identified disease groups. Figure S2 in the supplementary online contents provides results for each of the 214 disease groups
In the sensitivity analyses, the estimates of relative percentage and absolute increases in risk of hospital admission remained robust after adjusting for lag 0-6 of air and dew point temperatures. Results from single lag models and confidence intervals corrected for false discovery rate are also presented in figure S2. Results of 122 broader disease groups are presented in figure S3.
Discussion
Comprehensive scientific evidence on health effects and healthcare costs must inform how to set the National Ambient Air Quality Standards in the US and, globally, WHO air quality guidelines.5 39 Our study linked more than 95 million Medicare inpatient claims with estimated daily exposure to PM2.5 in the US over 13 years. We carried out a comprehensive analysis to estimate absolute and relative risks of hospital admission and the corresponding costs associated with short term exposure to PM2.5 for the 214 mutually exclusive disease groups. Air pollution and healthcare resources are distributed unevenly across the world. Nevertheless, this study could provide information for assessing the cost effectiveness of air pollution interventions in other high income countries, such as the United Kingdom, Canada, Germany, Australia, Japan, Sweden, Netherlands, and others, where the burdens of disease, population demographics, and healthcare use are similar to those of the US.17 40
Principal findings
We found that short term exposure to PM2.5 was associated with several newly identified causes of hospital admissions, and several previously identified causes. These associations remained consistent at a daily PM2.5 concentration below the WHO 24 hour guideline, suggesting that the guideline needs reviewing and updating. In contrast, there was no evidence of an association between short term exposure to PM2.5 and the negative outcome control (injury and poisoning), consistent with results from Dominici et al.9 Although unmeasured confounders of short term exposure to PM2.5 and the negative control might not be completely identical to those of exposure and other disease outcomes, the use of a negative control provides reassurance that our results are not substantially biased from residual confounding.
The health effects and economic costs associated with each 1 µg/m3 increase in short term exposure to PM2.5 were substantial and could merit particular attention in the evaluation of an environmental policy. During the study, each unit increase in lag 0-1 PM2.5 was associated with an annual increase of 5692 hospital admissions, 32 314 days in hospital, and 634 deaths at discharge. It was also associated with $100m annual inpatient and post-acute care costs (0.1% of the total Medicare fee-for-service spending of 2012) and $6.6bn in the value of statistical life due to the lives lost at discharge.34 An increase in the rising phase of lag 0-1 PM2.5 of more than 1 µg/m3 was especially common between 2000 and 2012, occurring on more than 122 days in each year within each zip code. On the other hand, a 1 µg/m3 reduction in PM2.5 is considered small and achievable. For example, Russell et al41 and Jaffe and Reidmiller42 showed that a regional reduction of 1 µg/m3 in PM2.5 was achievable by shutting down three coal fired power plants in Pittsburgh, Pennsylvania, or by closing a single power plant in Boardman, Oregon.
Comparison with other studies
We confirmed previously published results suggesting positive associations between cardiovascular and respiratory diseases and short term exposure to PM2.5, including those by Bell et al,12 Dominici et al,9 Kloog et al,15 and Zanobetti et al.11 We also found positive associations of PM2.5 exposure with Parkinson’s disease and diabetes mellitus with complications, which is consistent with findings by Kloog et al14 and Zanobetti et al.11 16 We identified multiple prevalent but rarely studied causes of hospital admissions that had significant associations with short term exposure to PM2.5. Our understanding, however, of the varied disordered physiological processes induced by PM2.5 for the newly identified disease groups is incomplete. Thus the associations and the corresponding hospital admissions and costs should be interpreted cautiously. This lack of supporting evidence requires further epidemiological studies and investigations into possible underlying mechanisms.
A number of explanations are possible for the negative associations between influenza and aneurysms and an increase in short term exposure to PM2.5. Short term exposure to PM2.5 might increase risk of mortality and admission to hospital for other diseases, thus reducing the number of subjects at risk for admission due to influenza or aneurysms25; influenza or aneurysms might trigger hospital admission due to diseases that are positively associated with short term PM2.5, making themselves less likely to be the principal discharge diagnosis owing to the coexisting conditions.
Strengths and limitations
Our comprehensive analysis of all disease groups has advantages. Firstly, it avoided selective presentation of only positive findings. Secondly, it allowed us to identify new causes of hospital admission that have never been studied. Thirdly, it confirmed the causes of admissions previously detected, thus demonstrating consistency of the study findings. Fourthly, the negative outcome control made it possible to evaluate residual confounding for estimated associations. Finally, the implementation of the Bonferroni correction minimized the chance of falsely identifying significant associations.
This study also has some limitations. Firstly, data sources were restricted. Thus we could not fully capture costs after discharge associated with short term exposure to PM2.5, such as drug costs, readmission costs, and outpatient costs, among others. Secondly, the Bonferroni correction for the 214 comparisons performed might have been overly conservative. To reduce the chance of missing true associations for some of the disease groups, we used results from the sensitivity analyses corrected for the false discovery rate. With these corrected results, we further identified stroke and asthma that were significantly associated with exposure to PM2.5. Thirdly, some unmeasured time variant factors might have confounded this study. For example, smoking, alcohol consumption, physical activity, and drug use could trigger hospital admission and could also vary with air pollution levels, which is a concern. Fourthly, the generalizability of results is limited by the characteristics of Medicare population and the study period 2000-12. This restriction meant that we were unable to study whether the associations were consistent in younger populations or in recent years. Fifthly, the diagnostic coding of some diseases may not be accurate, and some were probably classified into miscellaneous disease groups, such as “other diseases”. Finally, the assessment of exposure was subject to measurement error because zip codes (rather than home addresses) were the best geographical unit we could use to match PM2.5 with each beneficiary. A recent methodological study suggests that adjusting for measurement error results in larger effect estimates.43
Conclusions
Comprehensive analyses provide timely evidence for the revision of WHO air quality guidelines, which is soon to be completed. This study discovered several new causes of hospital admissions associated with short term exposure to PM2.5 and confirmed several already known associations, even at daily PM2.5 concentrations below the current WHO guideline. Economic analysis suggests that even a small increase in short term exposure to PM2.5 is associated with substantial economic effect.
What is already known on this topic
Short term exposure to PM2.5 is associated with increased risk of mortality and hospital admissions due to cardiovascular and respiratory diseases, diabetes mellitus, neurological diseases, and deep vein thrombosis, among others
Existing evidence for the health effects of short term exposure to PM2.5 was driven by hypotheses about specific disease outcomes that might be affected by the exposure, which could underestimate the potential effects of exposure to PM2.5 if other diseases are not negligible
What this study adds
Short term exposure to PM2.5 was positively associated with risks of several prevalent but rarely studied causes of hospital admissions, such as septicemia, fluid and electrolyte disorders, acute and unspecified renal failure, and intestinal obstruction without hernia
When the analysis was restricted to days with a daily PM2.5 concentration below the WHO air quality guideline for the 24 hour average exposure to PM2.5, most newly identified causes of hospital admission and those identified from previously published studies remained positively associated with short term PM2.5 exposure, suggesting that the guideline needs updating
A small increase in short term PM2.5 was associated with substantial inpatient and post-acute care costs and the economic costs due to lives lost at discharge
Web extra.
Extra material supplied by authors
Web appendix: Supplementary appendix (also available at https://nsaph.shinyapps.io/cause_specific_viz/)
Contributors: YWe and YaWa are joint first authors and contributed to data preparation, data analysis, data interpretation, development of the Shiny app, and writing of this manuscript. QD and YuWa contributed to data preparation and data analysis. CC contributed to data interpretation and development of the Shiny app. PK, AZ, FD, and JDS contributed to formulation of the idea, study design, data analysis, and review of the manuscript. All authors had full access to all the data in the study. FD is the study guarantor. The corresponding author attests that all listed authors meet authorship criteria and that no others meeting the criteria have been omitted.
Funding: This study was supported by National Institute of Health (NIH) grants P30 ES000002, R01 ES024332-01A1, R01 ES026217, R01 ES028033, and R21 ES024012; NIH/National Cancer Institute (NCI) grant R35 CA197449; Health Effects Institute (HEI) grant 4953-RFA14-3/16-4; and United States Environmental Protection Agency (US EPA) grants RD-83587201-0 and RD-83479801. The contents of this publication are solely the responsibility of the grantee and do not necessarily represent the official views of the US EPA. Further, the US EPA does not endorse the purchase of any commercial products or services mentioned in the publication. Research described in this article was conducted under contract to the HEI, an organization jointly funded by the US EPA (Assistance Award No CR-83467701) and certain motor vehicle and engine manufacturers. The contents of this article do not necessarily reflect the views of HEI, or its sponsors, nor do they necessarily reflect the views and policies of the US EPA or motor vehicle and engine manufacturers.
Competing interests: All authors have completed the ICMJE uniform disclosure form at www.icmje.org/coi_disclosure.pdf and declare: support from the NIH, NIH/NCI, HEI, and US EPA for the submitted work; no financial relationships with any organizations that might have an interest in the submitted work in the previous three years; no other relationships or activities that could appear to have influenced the submitted work.
Ethical approval: This study was approved by the institutional review board at the Harvard T H Chan School of Public Health and was exempt from informed consent requirements as a study of previously collected administrative data.
Data sharing: No additional data available.
The corresponding author affirms that the manuscript is an honest, accurate, and transparent account of the study being reported; that no important aspects of the study have been omitted; and that any discrepancies from the study as planned (and, if relevant, registered) have been explained.
References
- 1. Feng S, Gao D, Liao F, Zhou F, Wang X. The health effects of ambient PM2.5 and potential mechanisms. Ecotoxicol Environ Saf 2016;128:67-74. 10.1016/j.ecoenv.2016.01.030 [DOI] [PubMed] [Google Scholar]
- 2. Xing YF, Xu YH, Shi MH, Lian YX. The impact of PM2.5 on the human respiratory system. J Thorac Dis 2016;8:E69-74. [DOI] [PMC free article] [PubMed] [Google Scholar]
- 3. Brook RD, Franklin B, Cascio W, et al. Expert Panel on Population and Prevention Science of the American Heart Association Air pollution and cardiovascular disease: a statement for healthcare professionals from the Expert Panel on Population and Prevention Science of the American Heart Association. Circulation 2004;109:2655-71. 10.1161/01.CIR.0000128587.30041.C8 [DOI] [PubMed] [Google Scholar]
- 4.Air quality guidelines WHO. Geneva: World Health Organization. 2006. [Google Scholar]
- 5. World Health Organization (WHO) WHO expert consultation: available evidence for the future update of the WHO global air quality guidelines (AQGs). WHO, 2016. [Google Scholar]
- 6. Di Q, Wang Y, Zanobetti A, et al. Air pollution and mortality in the Medicare population. N Engl J Med 2017;376:2513-22. 10.1056/NEJMoa1702747 [DOI] [PMC free article] [PubMed] [Google Scholar]
- 7. Hart JE, Garshick E, Dockery DW, Smith TJ, Ryan L, Laden F. Long-term ambient multipollutant exposures and mortality. Am J Respir Crit Care Med 2011;183:73-8. 10.1164/rccm.200912-1903OC [DOI] [PMC free article] [PubMed] [Google Scholar]
- 8. Puett RC, Hart JE, Yanosky JD, et al. Chronic fine and coarse particulate exposure, mortality, and coronary heart disease in the Nurses’ Health Study. Environ Health Perspect 2009;117:1697-701. 10.1289/ehp.0900572 [DOI] [PMC free article] [PubMed] [Google Scholar]
- 9. Dominici F, Peng RD, Bell ML, et al. Fine particulate air pollution and hospital admission for cardiovascular and respiratory diseases. JAMA 2006;295:1127-34. 10.1001/jama.295.10.1127 [DOI] [PMC free article] [PubMed] [Google Scholar]
- 10. Wellenius GA, Burger MR, Coull BA, et al. Ambient air pollution and the risk of acute ischemic stroke. Arch Intern Med 2012;172:229-34. 10.1001/archinternmed.2011.732 [DOI] [PMC free article] [PubMed] [Google Scholar]
- 11. Zanobetti A, Franklin M, Koutrakis P, Schwartz J. Fine particulate air pollution and its components in association with cause-specific emergency admissions. Environ Health 2009;8:58. 10.1186/1476-069X-8-58 [DOI] [PMC free article] [PubMed] [Google Scholar]
- 12. Bell ML, Ebisu K, Leaderer BP, et al. Associations of PM2.5 constituents and sources with hospital admissions: analysis of four counties in Connecticut and Massachusetts (USA) for persons ≥ 65 years of age. Environ Health Perspect 2014;122:138-44. 10.1289/ehp.1306656 [DOI] [PMC free article] [PubMed] [Google Scholar]
- 13. Kloog I, Zanobetti A, Nordio F, Coull BA, Baccarelli AA, Schwartz J. Effects of airborne fine particles (PM2.5 ) on deep vein thrombosis admissions in the northeastern United States. J Thromb Haemost 2015;13:768-74. 10.1111/jth.12873 [DOI] [PMC free article] [PubMed] [Google Scholar]
- 14. Kloog I, Coull BA, Zanobetti A, Koutrakis P, Schwartz JD. Acute and chronic effects of particles on hospital admissions in New-England. PLoS One 2012;7:e34664. 10.1371/journal.pone.0034664 [DOI] [PMC free article] [PubMed] [Google Scholar]
- 15. Kloog I, Nordio F, Zanobetti A, Coull BA, Koutrakis P, Schwartz JD. Short term effects of particle exposure on hospital admissions in the Mid-Atlantic states: a population estimate. PLoS One 2014;9:e88578. 10.1371/journal.pone.0088578 [DOI] [PMC free article] [PubMed] [Google Scholar]
- 16. Zanobetti A, Dominici F, Wang Y, Schwartz JD. A national case-crossover analysis of the short-term effect of PM2.5 on hospitalizations and mortality in subjects with diabetes and neurological disorders. Environ Health 2014;13:38. 10.1186/1476-069X-13-38 [DOI] [PMC free article] [PubMed] [Google Scholar]
- 17. James SL, Abate D, Abate KH, et al. GBD 2017 Disease and Injury Incidence and Prevalence Collaborators Global, regional, and national incidence, prevalence, and years lived with disability for 354 diseases and injuries for 195 countries and territories, 1990-2017: a systematic analysis for the Global Burden of Disease Study 2017. Lancet 2018;392:1789-858. 10.1016/S0140-6736(18)32279-7 [DOI] [PMC free article] [PubMed] [Google Scholar]
- 18.HCUP CCS. Healthcare cost and utilization project (HCUP). 2017. Agency for Healthcare Research and Quality, Rockville, MD. https://www.hcup-us.ahrq.gov/toolssoftware/ccs/ccs.jsp. [PubMed]
- 19. Bobb JF, Obermeyer Z, Wang Y, Dominici F. Cause-specific risk of hospital admission related to extreme heat in older adults. JAMA 2014;312:2659-67. 10.1001/jama.2014.15715 [DOI] [PMC free article] [PubMed] [Google Scholar]
- 20. Alshekhlee A, Horn C, Jung R, Alawi AA, Cruz-Flores S. In-hospital mortality in acute ischemic stroke treated with hemicraniectomy in US hospitals. J Stroke Cerebrovasc Dis 2011;20:196-201. 10.1016/j.jstrokecerebrovasdis.2009.11.019 [DOI] [PubMed] [Google Scholar]
- 21. Radley DC, Gottlieb DJ, Fisher ES, Tosteson AN. Comorbidity risk-adjustment strategies are comparable among persons with hip fracture. J Clin Epidemiol 2008;61:580-7. 10.1016/j.jclinepi.2007.08.001 [DOI] [PMC free article] [PubMed] [Google Scholar]
- 22. Lipsitch M, Tchetgen Tchetgen E, Cohen T. Negative controls: a tool for detecting confounding and bias in observational studies. Epidemiology 2010;21:383-8. 10.1097/EDE.0b013e3181d61eeb [DOI] [PMC free article] [PubMed] [Google Scholar]
- 23.HCUP CCS. Healthcare cost and utilization project (HCUP). Agency for Healthcare Research and Quality, Rockville, MD. 2017. https://www.hcup-us.ahrq.gov/toolssoftware/ccs/AppendixASingleDX.txt. [PubMed]
- 24. Di Q, Kloog I, Koutrakis P, Lyapustin A, Wang Y, Schwartz J. Assessing PM2.5 exposures with high spatiotemporal resolution across the continental United States. Environ Sci Technol 2016;50:4712-21. 10.1021/acs.est.5b06121 [DOI] [PMC free article] [PubMed] [Google Scholar]
- 25. Di Q, Dai L, Wang Y, et al. Association of short-term exposure to air pollution with mortality in older adults. JAMA 2017;318:2446-56. 10.1001/jama.2017.17923 [DOI] [PMC free article] [PubMed] [Google Scholar]
- 26. Kalnay E, Kanamitsu M, Kistler R, et al. The NCEP/NCAR 40-year reanalysis project. Bull Am Meteorol Soc 1996;77:437-71 . [DOI] [Google Scholar]
- 27. Talbott EO, Rager JR, Benson S, Brink LA, Bilonick RA, Wu C. A case-crossover analysis of the impact of PM(2.5) on cardiovascular disease hospitalizations for selected CDC tracking states. Environ Res 2014;134:455-65. 10.1016/j.envres.2014.06.018 [DOI] [PubMed] [Google Scholar]
- 28. Symons JM, Wang L, Guallar E, et al. A case-crossover study of fine particulate matter air pollution and onset of congestive heart failure symptom exacerbation leading to hospitalization. Am J Epidemiol 2006;164:421-33. 10.1093/aje/kwj206 [DOI] [PubMed] [Google Scholar]
- 29. Levy D, Lumley T, Sheppard L, Kaufman J, Checkoway H. Referent selection in case-crossover analyses of acute health effects of air pollution. Epidemiology 2001;12:186-92. 10.1097/00001648-200103000-00010 [DOI] [PubMed] [Google Scholar]
- 30. Navidi W. Bidirectional case-crossover designs for exposures with time trends. Biometrics 1998;54:596-605. 10.2307/3109766 [DOI] [PubMed] [Google Scholar]
- 31. Wood SN. Generalized additive models: an introduction with R. 2nd ed Chapman and Hall/CRC, 2017. 10.1201/9781315370279. [DOI] [Google Scholar]
- 32.US Bureau of Labor Statistics. CPI-all urban consumers. Medical care in US city average, all urban consumers, not seasonally adjusted. 2018. https://data.bls.gov/timeseries/CUUR0000SAM?output_view=pct_12mths.
- 33.Centers for Medicare and Medicaid Services. Medicare fee-for-service provider utilization & payment data inpatient public use file: a methodological overview. 2018. https://www.cms.gov/Research-Statistics-Data-and-Systems/Statistics-Trends-and-Reports/Medicare-Provider-Charge-Data/Downloads/Inpatient_Methodology.pdf.
- 34.Medicare Payment Advisory Commission. Report to Congress: Medicare payment policy. Washington, DC. 2018. http://www.medpac.gov/docs/default-source/reports/mar18_medpac_entirereport_sec.pdf.
- 35. Chandra A, Dalton MA, Holmes J. Large increases in spending on postacute care in Medicare point to the potential for cost savings in these settings. Health Aff (Millwood) 2013;32:864-72. 10.1377/hlthaff.2012.1262 [DOI] [PMC free article] [PubMed] [Google Scholar]
- 36.US Environmental Protection Agency. Mortality risk valuation. 2018. https://www.epa.gov/environmental-economics/mortality-risk-valuation.
- 37. Benjamini Y, Hochberg Y. Controlling the false discovery rate: a practical and powerful approach to multiple testing. J R Stat Soc Ser A Stat Soc 1995;57:289-300. https://www.researchgate.net/publication/221995234_Controlling_The_False_Discovery_Rate_-_A_Practical_And_Powerful_Approach_To_Multiple_Testing [Google Scholar]
- 38.HCUP CCS. Healthcare cost and utilization project (HCUP). 2017. Agency for Healthcare Research and Quality, Rockville, MD. https://www.hcup-us.ahrq.gov/toolssoftware/ccs/AppendixCMultiDX.txt. [PubMed]
- 39. US Environmental Protection Agency 40 CFR Part 50. National Ambient Air Quality Standards for particulate matter. Final rule. Fed Regist 2006;71:61144-233. https://www.federalregister.gov/documents/2006/10/17/06-8477/national-ambient-air-quality-standards-for-particulate-matter [Google Scholar]
- 40. Papanicolas I, Woskie LR, Jha AK. Health care spending in the United States and other high-income countries. JAMA 2018;319:1024-39. 10.1001/jama.2018.1150 [DOI] [PubMed] [Google Scholar]
- 41. Russell MC, Belle JH, Liu Y. The impact of three recent coal-fired power plant closings on Pittsburgh air quality: a natural experiment. J Air Waste Manag Assoc 2017;67:3-16. 10.1080/10962247.2016.1170738 [DOI] [PubMed] [Google Scholar]
- 42. Jaffe D, Reidmiller D. Now you see it, now you don’t: impact of temporary closures of a coal-fired power plant on air quality in the Columbia River Gorge national scenic area. Atmos Chem Phys Discuss 2009;9:7997-8005 10.5194/acp-9-7997-2009 https://core.ac.uk/download/pdf/25823270.pdf [DOI] [Google Scholar]
- 43. Wu X, Braun D, Kioumourtzoglou MA, Choirat C, Di Q, Dominici F. Causal inference in the context of an error prone exposure: air pollution and mortality. Ann Appl Stat 2019;13:520-47. 10.1214/18-AOAS1206 [DOI] [PMC free article] [PubMed] [Google Scholar]
Associated Data
This section collects any data citations, data availability statements, or supplementary materials included in this article.
Supplementary Materials
Web appendix: Supplementary appendix (also available at https://nsaph.shinyapps.io/cause_specific_viz/)


