

Abstract
The two-dimensional shape of the receptive field center of macaque retinal ganglion cells was determined by measuring responses to drifting sinusoidal gratings of different spatial frequency and orientation. The responses of most cells to high spatial frequencies depended on grating orientation, indicating that their centers were not circularly symmetric. In general, center shape was well described by an ellipse. The major axis of the ellipse tended to point towards the fovea or perpendicular to this. Parvocellular pathway cells had greater center ellipticity than magnocellular pathway cells; the median ratio of the major-to-minor axis was 1.72 and 1.38, respectively. Parvocellular pathway cells also had centers that were often bimodal in shape, suggesting that they received patchy cone/bipolar cell input. We conclude that most ganglion cells in primate retina have elongated receptive field centers and thus show orientation sensitivity.
Keywords: macaque monkeys, MC- and PC-pathway cells, receptive field, orientation tuning
INTRODUCTION
Experiments in cat have shown that the receptive field centers of most X and Y ganglion cells and lateral geniculate cells are not circular but slightly elongated in shape (Hammond, 1974; Levick & Thibos, 1980, 1982; Peichl & Wässle, 1981; Vidyasagar & Heide, 1984; Soodak, Shapley & Kaplan, 1987; Shou & Leventhal, 1989). Similar results have been reported for magnocellular (MC) and parvocellular (PC) cells of the primate lateral geniculate nucleus (Lee, Creutzfeldt, & Elepfandt 1979; Smith, Chino, Ridder, Kitagawa & Langston, 1990; Kremers & Weiss, 1997). In most cases, the elongated distribution of center sensitivity could be adequately described by an elliptical Gaussian function (Soodak et al., 1987; Smith et al., 1990). In some cases, however, sensitivity profiles with more than one peak were found (Thibos & Levick, 1983; Smith et al., 1990; Soodak, Shapley & Kaplan, 1991; McMahon, Lankheet, Lennie & Williams, 2000). These findings suggest that elongated receptive field centers arise from the convergence of spatially offset subunits and that the relative size and location of the subunits determines whether elliptical or multimodal center profiles result (Soodak, 1986).
In cat the elongation in receptive field center shape has been linked to ganglion cell morphology. Anatomical studies have shown that most cat ganglion cells have elongated dendritic trees (Boycott & Wässle, 1974; Leventhal & Schall, 1983) and that the amount of elongation is comparable to that of their receptive field centers (Peichl & Wässle, 1981; Levick & Thibos, 1982; Leventhal & Schall, 1983). Moreover, the major axis of dendritic tree elongation tends to point towards the area centralis (Leventhal & Schall, 1983), just as the major axis of receptive field center elongation does (Levick & Thibos, 1980, 1982). Subsequent studies have shown that many primate ganglion cells also have elongated dendritic trees that tend to point towards the fovea (Schall, Perry & Leventhal, 1986a; Watanabe & Rodieck, 1989), suggesting that their receptive field centers would be elongated and oriented in the same manner. The exception may be midget (PC-pathway) ganglion cells in central primate retina. These cells would be expected to have circular receptive field centers because their punctate dendritic fields are thought to receive input from a single cone via a single midget bipolar cell (Polyak, 1941). Recordings from geniculate PC cells with foveal receptive fields, however, indicate that the center mechanism of these cells is fed by more than one cone (McMahon et al., 2000). Hence, even in central retina, it is possible that PC-pathway ganglion cells have elongated receptive field centers.
The anatomical and physiological findings described above suggest that primate retinal ganglion cells may be orientation sensitive and prefer radial stimulus orientations. The aim of this study was to test this hypothesis by measuring the receptive field center shape of MC- and PC-pathway ganglion cells in central and near peripheral retina.
MATERIALS AND METHODS
Experimental Preparation
Ganglion cell discharges were recorded extracellularly from the retinal surface of 6 anesthetized and paralyzed adult monkeys (Macaca fascicularis). Full details of the experimental procedures have been provided elsewhere (Lee, Martin & Valberg, 1989). In brief, general anesthesia was induced by intramuscular injection of ketamine (10–15 mg kg−1) and maintained thereafter with isofluorane in a 70%:30% mixture of N2O and O2. Local anesthetic was applied to points of surgical intervention. Once a stable plane of anesthesia was reached, as assessed by standard methods (e.g. lack of pedal withdrawal and eye blink reflexes), eye movements were minimized by continuous infusion of gallamine triethiodide (5 mg kg−1 hr−1) in dextrose Ringer (5 ml hr−1). Following paralysis, end-tidal CO2 was kept near 4% by adjusting the rate and depth of ventilation and body temperature was maintained near 37.5° C. The depth of anesthesia was monitored using the EEG and ECG. Adequate anesthesia was indicated by slow-wave EEG activity interspersed with faster spindles and no increase in ECG rate to potentially painful stimulation. Pupils were dilated with a few drops of 1% atropine sulfate and 3-mm artificial pupils were placed in front of the eyes. Eye refraction was measured periodically during the experiment with a refractometer (Rodenstock, Germany) and contact lenses fitted to focus the eyes on the stimulus display. Auxiliary lenses were later added as needed. An additional 0.5–1 diopter of optical correction was often required over the course of an experiment. The eyes were also checked for astigmatism. Astigmatic errors were small (less than 0.5 diopters) and did not develop during an experiment.
Action potentials from individual ganglion cells were recorded with tungsten-in-glass microelectrodes advanced into the eye through a protective guide tube. Electrical activity was conventionally amplified and filtered. Times of spike discharge were detected by a window discriminator and stored with 0.1-msec precision on an Apple computer.
Visual Stimulation
Visual stimuli were generated on a Barco Calibrator color monitor by a VSG3 (Cambridge Research Systems, UK) controller linked to the computer. The monitor display ran at 160 Hz and spanned a 6- by 6-deg region of space at a distance of 226 cm. The product of display luminance (30 cd m−2) and pupil area resulted in a retinal illuminance of 220 monkey trolands, which lies in the mid-photopic range of the animal. The stimulus consisted of an achromatic sinusoidal grating of 0.50 contrast drifting at 4.03 Hz. Grating contrast was defined as , where and are the peak and trough luminance, respectively. Grating spatial frequency ranged from 0.1 to 20 cpd (cycles deg−1), and grating orientation varied from 0 to 157.5 deg in steps of 22.5 deg.
Data Collection and Analysis
The receptive field centers of ganglion cells were mapped using a hand-held projector on a tangent screen onto which the locations of the fovea and optic disk were also drawn. Those belonging to PC-pathway cells were identified by sustained responses to lights of specific wavelengths, while those belonging to MC-pathway cells were identified by transient responses to lights of any wavelength. PC-pathway cells with strong input from short- (S), medium- (M), and long-wavelength (L) cones are referred to as +S-ML, +M-L, and +L-M cells, respectively. A total of 29 MC-pathway cells and 49 PC-pathway cells were recorded and analyzed. They were located 1–20 deg from the fovea. After cell classification, the stimulus display was centered on the receptive field by adjusting the positioning stage of the display. Spike discharges in response to 12.8-sec epochs of grating stimulation were accumulated into peristimulus time histograms (PSTHs) equal in duration to twice the temporal period of the grating. The bin width of the PSTHs was 4 msec.
For each combination of grating spatial frequency and orientation, fundamental response amplitude was determined by Fourier analysis of PSTHs and plotted against spatial frequency. The resulting spatial frequency curves were then analyzed using a difference-of-Gaussian model of the receptive field (Rodieck, 1965; Enroth-Cugell & Robson, 1966), which assumes that signals from the receptive field center and surround sum linearly. The spatial frequency response S of this model for drifting gratings of orientation is:
| (1) |
where is grating spatial frequency, and are center and surround strengths, respectively (ie. response amplitude at zero spatial frequency), and and are center and surround radii, respectively, at a given orientation. Parameter values yielding the best model fit to the measured spatial frequency curves were found using SigmaPlot® (Jandel Scientific Software, San Rafael, CA), which employs the Marquardt-Levenberg algorithm for regression. Estimates of surround strength and radii were not a focus of this study and are not discussed further.
Estimates of center radii were used to determine the preferred orientation and orientation sensitivity of ganglion cells. Two different methods were employed. One fitted radius estimates with an elliptical function given by:
| (2) |
where is center radius along the major axis, is center radius along the minor axis, and is the preferred orientation of the cell. If the ellipse fit the data well (ANOVA, p<0.05), the ratio of the major-to-minor radius, or ellipticity index (Soodak et al., 1987), was accepted as a measure of orientation sensitivity. Values greater than 1 indicate a deviation from circularity. The other method of analysis was based on the approach developed by Levick and Thibos (1982), which derives from the statistical analysis of circular data (Fisher, 1993). This method provided a check on the ellipticity measurements because no model of center shape was assumed. It differed from the approach of Levick and Thibos (1982) in one important aspect: radius estimates were used instead of response amplitudes. The importance of this distinction is explained in the Discussion. Accordingly, center radius at a given orientation was represented in phasor notation as the complex number:
| (3) |
where is the square root of –1. The mean radius vector for a series of equally spaced orientations was then given by:
| (4) |
To compare across cells, was normalized by the mean center radius for all orientations (ie. ), yielding an orientation bias vector given by:
| (5) |
The magnitude of the orientation bias vector is a measure of orientation selectivity known as the orientation bias index and the phase is the preferred orientation. An orientation bias index of 0 indicates that the cell is equally sensitive to all orientations, whereas a bias index of 1 indicates that it is sensitive to only one orientation. Note that vectors in the above equations are bold faced.
To facilitate comparisons of our results with those of visual cortical cells, a third measure of orientation selectivity was also determined. This measure is known as the half width at half height (HWHH) of orientation tuning curves (eg., Campbell, Cleland, Cooper, & Enroth-Cugell, 1968; Henry, Dreher, & Bishop, 1974). Orientation tuning curves were constructed from the fundamental response of ganglion cells to different orientations of a high spatial frequency grating. The spatial frequency of the grating was approximately twice the optimal frequency of the cell so as to isolate its center mechanism. The tuning curves were fit with a Gaussian function (Carandini & Ferster, 2000). The center of the function defined the preferred orientation and 1.18 times the standard deviation gave the HWHH.
RESULTS
Effect of grating orientation on ganglion cell responses
The response of primate ganglion cells to drifting achromatic gratings often depended on grating orientation. This is demonstrated in Fig. 1a, which plots the responses of an ON-center MC-pathway cell to a 3-cpd grating of different orientations. Gratings oriented ~22.5 deg from horizontal evoked the strongest response from this particular cell, while those oriented ~112.5 deg evoked the weakest response. The filled circles in Fig. 1b plot the amplitude of the fundamental Fourier component of the responses as a function of grating orientation. Like previously reported curves for cat ganglion cells (Levick & Thibos, 1980, 1982) and primate geniculate cells (Smith et al., 1990), orientation tuning curves for this and other MC- and PC-pathway cells were not flat, indicating that their receptive field centers were elongated in shape. The cells also showed little or no directional sensitivity (n = 5) as gratings drifting in the opposite direction gave comparable results (open circles in Fig. 1b).
FIGURE 1.
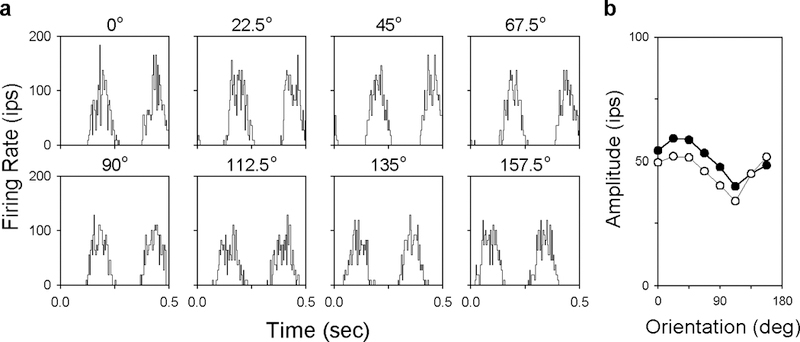
Response of a primate retinal ganglion cell to drifting gratings of different orientations. a, PSTHs of an ON-center MC-pathway cell to a 3-cpd grating drifting at 4.03 Hz. Two cycles of response are plotted. b, Fundamental response amplitude as a function of grating orientation for the gratings in a (filled symbols) and for ones of the same orientation moving in the opposite direction (unfilled symbols). This cell was the only one of five to show a slight directional preference.
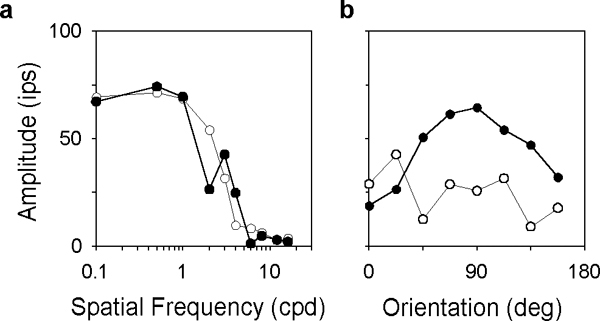
The effect of grating orientation on ganglion cell responses was most apparent with moderate-to-high spatial frequency gratings. Figs. 2 and 3 respectively plot the fundamental response amplitude of 3 MC- and 3 PC-pathway cells for the 4 pairs of orthogonal gratings depicted to the right. The cells were chosen to illustrate different degrees of orientation tuning. The ones in Figs. 2a and 3a, for example, showed little if any orientation sensitivity. This is evidenced by the high frequency cutoff of their spatial frequency curves, which was about the same for each pair of gratings. The other cells in the figures, on the other hand, showed clear orientation tuning as their high spatial frequency cutoff depended systematically on grating orientation. The cutoff frequency for the cell in Fig. 2c, for example, was maximal for vertical gratings, minimal for horizontal gratings, and shifted between these limits for oblique gratings.
FIGURE 2.
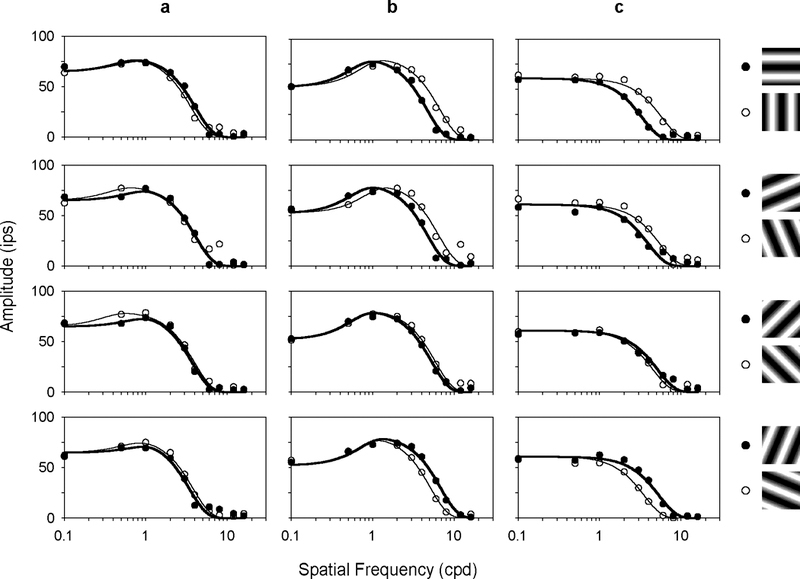
Spatial frequency curves of three MC-pathway cells having different orientation sensitivities. The first cell (a) is an ON-center cell, the other two (b-c) are OFF-center cells. Filled and unfilled symbols plot the fundamental response to the gratings depicted to the right. Solid lines are the best fit of a difference-of-Gaussian model (see Methods) to the data.
FIGURE 3.
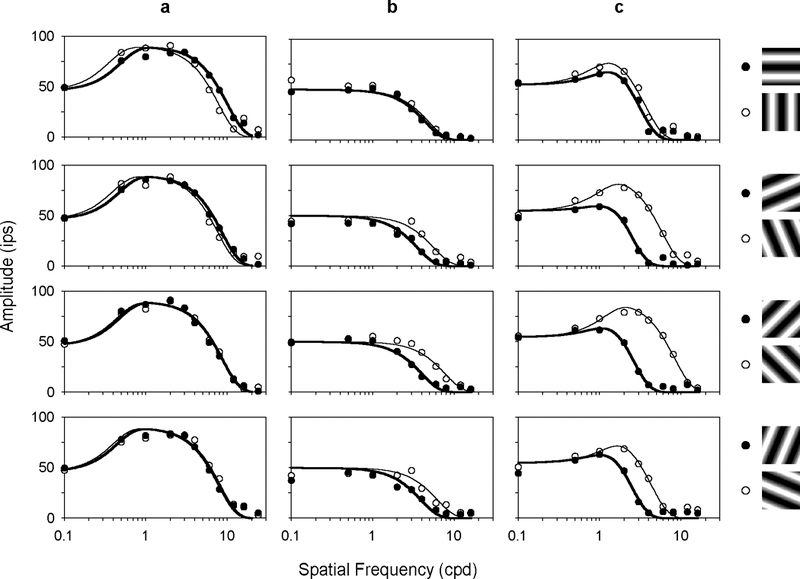
Spatial frequency curves of three PC-pathway cells having different orientation sensitivities. The first cell (a) is an OFF-center +L-M cell, the other two (b-c) are ON-center +L-M cells. Symbols and lines are the same as in Fig. 2.
Quantification of orientation sensitivity
One method of quantifying orientation sensitivity that is common in the cortical literature is to compute the preferred orientation and HWHH of orientation tuning curves. Fig. 4 plots the orientation tuning curves of the representative MC- and PC-pathway cells for a high spatial frequency grating above the peak frequency of the cells. Based on fits of a Gaussian function to the data (solid lines), the preferred orientation with respect to horizontal was 94 (a), −3 (b), and 3 deg (c) for the MC-pathway cells and 86 (a), 43 (b), and 39 deg (c) for the PC-pathway cells. The HWHH was 30 (a), 48 (b), and 42 deg (c) for the former group of cells and 28 (a), 29 (b), and 28 deg (c) for the latter group. The median value of HWHH for the ensemble of MC- and PC-pathway cells was 48 and 38 deg, respectively. These measures of orientation sensitivity provided a means of comparison with visual cortical cells (see Discussion), but they were dependent on grating spatial frequency in some cases because the receptive field center was spatially inhomogeneous. The anisotropy in center sensitivity often produced a second smaller peak in spatial frequency curves (Thibos & Levick, 1983; Soodak et al., 1991; Smith et al., 1990), causing the orientation tuning curves of some cells to differ markedly at nearby spatial frequencies (Fig. 5).
FIGURE 4.
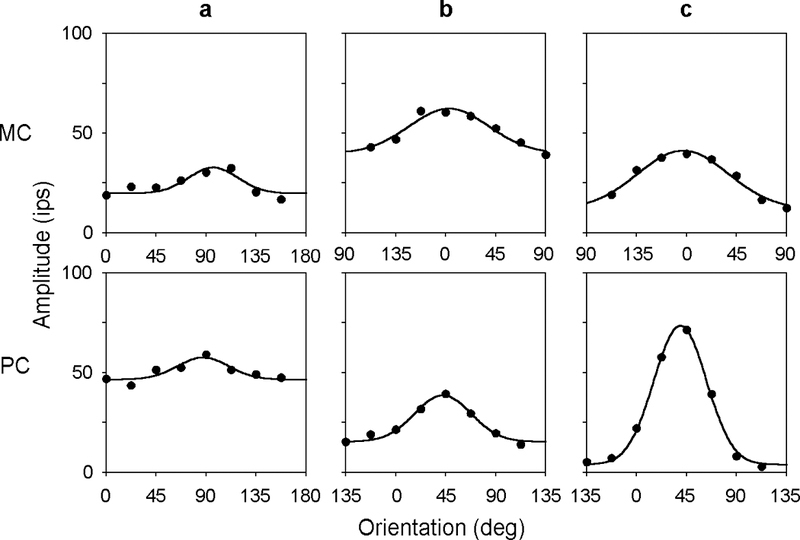
Orientation tuning curves of the MC- and PC-pathway cells in Figs. 2 and 3. Grating spatial frequency was 4 cpd for all cells except the cell in Fig. 3a, for which it was 6 cpd. Solid lines are the best fit of a Gaussian function to the data.
FIGURE 5.
Spatial frequency and orientation tuning curves of an ON-center +M-L cell having a bimodal receptive field center profile. a, spatial frequency curves for grating orientations of 22.5 deg (filled symbols) and 112.5 deg (unfilled symbols). b, orientation tuning curves for grating spatial frequencies of 2 cpd (filled symbols) and 3 cpd (unfilled symbols). Solid lines connect points of common orientation (left) or spatial frequency (right).
Other methods of quantifying orientation sensitivity were also employed. These methods were based not on orientation-dependent responses but on orientation-dependent estimates of receptive field center radius. The radius estimates were obtained by fitting spatial frequency curves with a difference-of-Gaussian model of the ganglion cell receptive field (solid lines in Figs. 2 and 3). Since the estimates derived from responses at multiple spatial frequencies this approach was less affected by receptive field anisotropy. Fig. 6 plots center radius estimates for each axis of measurement for the MC- and PC-pathway cells described previously. The polar plots depict the approximate two-dimensional shape of the receptive field center of the cells under the assumption that they were not directionally selective, which was generally the case (Fig. 1). The center profiles of these and most other recorded cells were well described by an ellipse (solid lines in Fig. 6), so we took the ratio of the major-to-minor axis of the ellipse as a second measure of orientation sensitivity. Ellipticity indices ranged from 1.15 to 2.02 for MC-pathway cells and from 1.12 to 3.18 for PC-pathway cells with median values of 1.38 and 1.72, respectively (Fig. 7a). PC-pathway cells had more elongated centers than MC-pathways cells (Mann-Whitney test, p<0.01). ON- and OFF-center varieties of these cells, however, did not appear to differ in center elongation (data not shown). The ellipticity of center shape was not an artifact of optical or mechanical distortion by the intraocular electrode because it was found in recordings from passing nerve fibers as well as from ganglion cell bodies. It is also seen in recordings from cat optic tract (Levick & Thibos, 1982; Thibos & Levick, 1983) and primate lateral geniculate nucleus (Smith et al., 1990).
FIGURE 6.
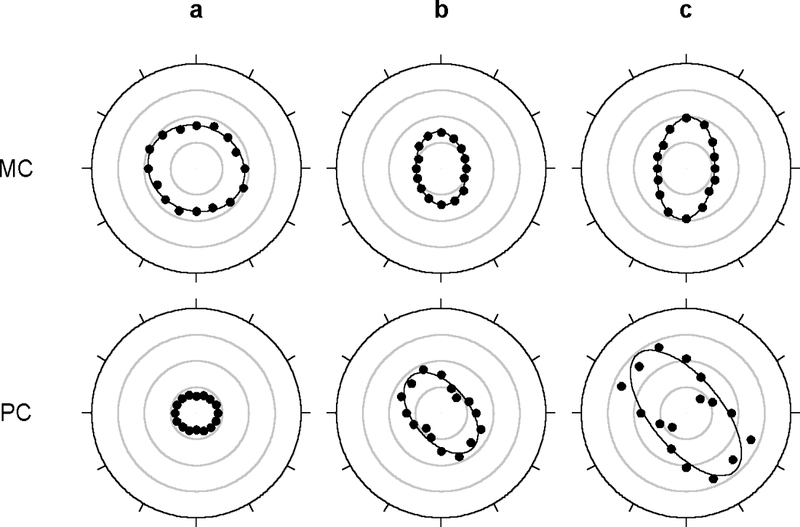
Receptive field center shape of the MC- and PC- pathway cells in Figs. 2 and 3. Filled symbols plot model estimates of Gaussian center radius from Figs. 2 and 3 for each axis of measurement (0–157.5 deg). The same estimates were used for the opposite direction of motion along a given axis (180–337.5 deg). Solid lines are the best fit of an ellipse to the data. The ratio of the major-to-minor axis of the ellipse, or ellipticity index, was 1.15 (a), 1.49 (b), and 1.76 (c) for the MC-pathway cells and 1.20 (a), 1.70 (b), and 2.16 (c) for the PC-pathway cells. The orientation bias was 0.03 (a), 0.10 (b), 0.14 (c) for the MC-pathway cells and 0.05 (a), 0.16 (b), and 0.25 (c) for the PC-pathway cells. Radial rings are 0.05 deg of visual angle apart.
FIGURE 7.
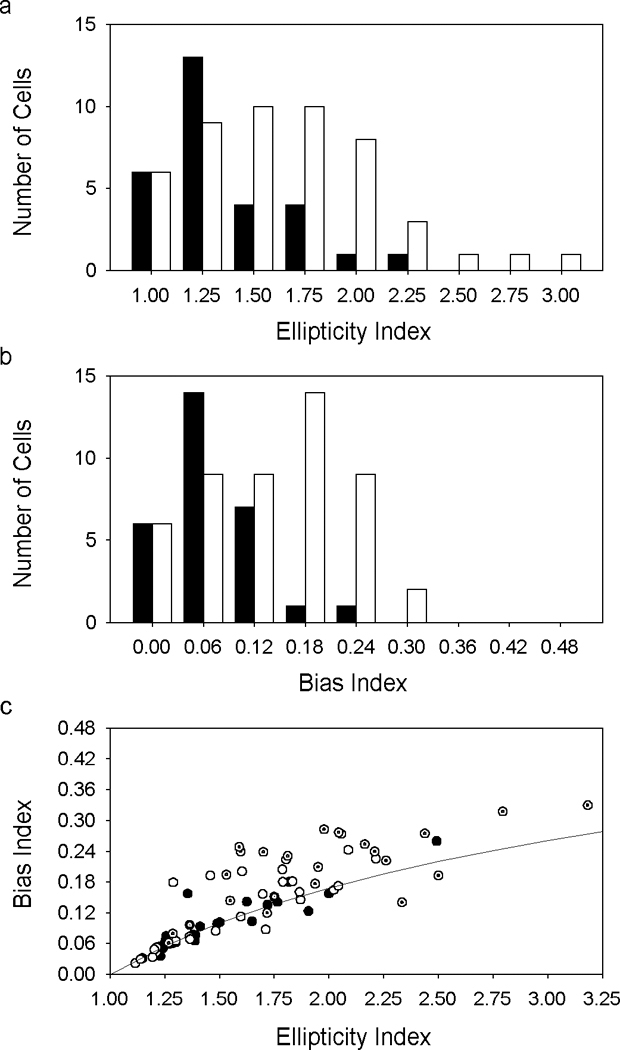
Orientation selectivity of primate ganglion cell receptive field centers. a, Histogram of ellipticity indices from the ensemble of recorded MC- (filled bars) and PC-pathway (unfilled bars) cells. b, Histogram of orientation bias indices for the two ganglion cell populations. c, Relationship between ellipticity index and bias index of MC- (filled circles) and PC-pathway (unfilled circles) cells. The subset of MC- and PC-pathway cells having bimodal center profiles are identified by dotted symbols. The curve gives the orientation bias index computed for a perfectly elliptical center profile having different ellipticity indices.
As evident in Figs. 5 and 6, the receptive field centers of some cells were not exactly elliptical. Rather, they appeared bimodal in shape. The incidence of bimodal profiles was quantified by examining the standard error of radius estimates along the minor axis of the receptive field center. The center was deemed bimodal if one or more of these estimates was greater than two standard errors from the ellipse fit. Few of the MC-pathway cells (2/29) but almost half of the PC-pathway cells (23/49) met this criterion. Bimodal cells tended to have the greatest orientation sensitivity (Fig. 7c, dotted symbols) and were found at almost every retinal location tested (Fig. 8b, dotted symbols).
FIGURE 8.
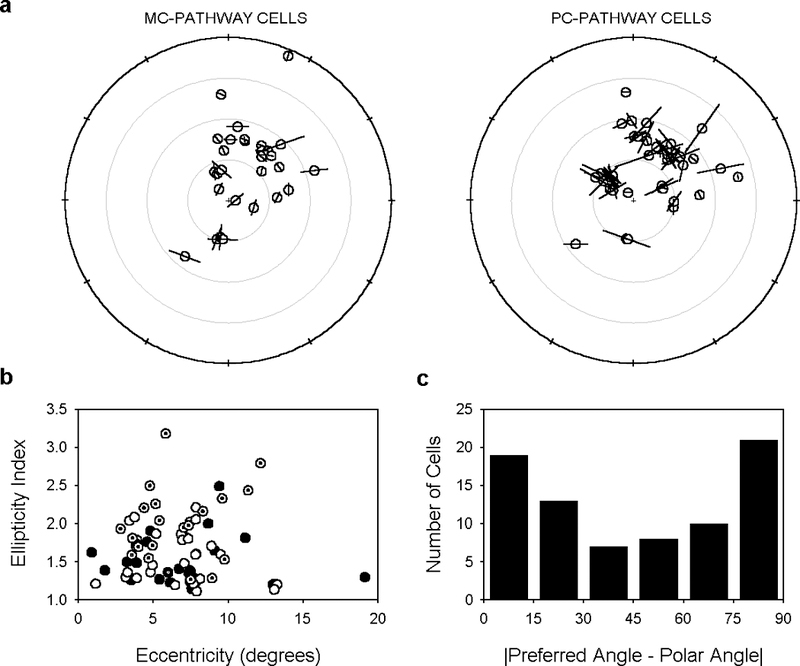
Preferred orientation of primate ganglion cell receptive field centers. a, Receptive field locations and center ellipticity of the ensemble of recorded cells. Lines depict the orientation of the major axis of the receptive field center. They are scaled in length in proportion to the ellipticity index (E) of the cell by the equation 2∙(E-1). Small crosshairs mark the location of the fovea. Radial rings are 5 deg apart. b, Ellipticity index of MC- (filled symbols) and PC-pathway (unfilled symbols) cells as a function of retinal eccentricity. The subset of MC- and PC-pathway cells having bimodal center profiles are indicated by dotted symbols. c, Histogram of the absolute angular difference between the preferred and polar angle of cells. Polar angle is the angle formed by a line intersecting the receptive field midpoint and the fovea measured with respect to horizontal. The first bin of the histogram thus gives the number of center profiles that pointed within ±15 deg of the fovea and the last bin gives the number that pointed –75 to –90 deg and 75 to 90 deg of the fovea.
We examined whether ellipticity index remained a useful measure for bimodal cells by computing from the radius estimates a third measure of orientation sensitivity, known as the orientation bias index (see Methods). This measure is less intuitive than ellipticity index but more objective since no assumptions are made about receptive field shape. Orientation bias indices ranged up to 0.26 for MC-pathway cells and 0.33 for PC-pathway cells with median values of 0.08 and 0.18, respectively (Fig. 7b). Fig. 7c plots bias index against ellipticity index. As one would expect, the two measures were positively correlated. Cells with the most orientation bias had the greatest ellipticity. Less obvious may be the inherently nonlinear relationship between the two measures, illustrated by the curved line in the plot. The curve was determined empirically by varying the radius of the major and minor axes of an ellipse and then computing the resulting bias index with equations 3–5 (see Methods). It thus gives the bias index of a perfectly elliptical center profile having different ellipticity indices. Notice that many points fell above the curve, indicating that one or more radius estimates differed noticeably from the best-fitting ellipse. This could result from measurement variability, but seemed to depend upon center shape because the outlying points often corresponded to cells that were considered to have bimodal center profiles (dotted symbols). Ellipticity index generally underestimated the orientation bias of such cells.
Dependence of orientation sensitivity on the retinal location of ganglion cells
Fig. 8a illustrates the retinal location of the receptive field centers of all recorded cells with respect to the fovea (crosshairs). The ellipticity and preferred orientation of the cells is given by the length and angle of the lines, respectively. Note that line length is proportional to the deviation of center shape from circularity so a cell having an ellipticity index of 1 would have no line in the figure. This also means that line length conveys no information about center size. Fig. 8b plots the ellipticity index of MC- (filled circles) and PC-pathway (unfilled circles) cells as a function of their distance from the fovea. For both cell types the degree of orientation tuning depended weakly, if at all, on retinal eccentricity over the range of measurement (Pearson’s product-moment correlation coefficient, r, was 0.07 for MC-pathway and 0.03 for PC-pathway cells). The preferred orientation of recorded cells, on the other hand, seemed to depend on their location in the retina. Inspection of Fig. 8a suggests a tendency for the receptive field center to point either toward the fovea or tangential to it. To confirm this, we computed the absolute value of the angular difference between the preferred orientation of cells and their polar angle. The polar angle is the angle formed by a line intersecting the fovea and the receptive field center measured with respect to horizontal (Levick & Thibos, 1982). A difference of 0 degrees indicates that the major axis was oriented radially, whereas a difference of 90 degrees indicates that it was oriented tangentially. Fig. 8c gives the distribution of the absolute difference between preferred and polar angle for the ensemble of ganglion cells. This distribution would be flat if their receptive field centers were randomly oriented with respect to the fovea. Instead, the first (−15 to 15 deg) and last (−90 to –75 deg and 75 to 90 deg) bins contained a disproportionate number of cells. A Rayleigh test of circular data (Fisher, 1993) confirmed that the distribution differed significantly from uniformity (p<0.05).
DISCUSSION
Retinal ganglion cells and lateral geniculate cells of cat are known to have elongated receptive field centers with the major axis pointing towards the area centralis. Troy (1993) suggested that such a spatial sampling scheme would be expected where cell density decreases with retinal eccentricity. In primate the centers of PC-pathway cells also must make cone specific connections in order to preserve chromatic sensitivity. It is of interest therefore how PC-pathway cells balance these spectral and spatial constraints. MC-pathway cells serve as a good comparison because they are not challenged in the same way.
We found that PC-pathway cells generally had more elongated receptive field centers than MC-pathway cells and greater orientation bias. Both showed a preference for either radial or tangential stimulus orientations. In addition, many PC-pathway cells had center profiles that were more bimodal than elliptical in shape. Such cells were found not only in peripheral retina but also in parafoveal retina.
Orientation sensitivity of subcortical neurons
Hammond (1974) was first to systematically investigate center elongation. He reported that the major-to-minor axis ratio of cat retinal ganglion cells ranged from 1 to 1.9 with a mean value of 1.23. Levick and Thibos (1982) subsequently quantified the orientation sensitivity of cat ganglion cells in terms of orientation bias index and found that bias indices were much the same for the various ganglion cell types, ranging from 0 to 0.46 with a mean value of 0.16. They also noted a tendency for the cells to prefer radial orientations. Leventhal and Schall (1983) showed that this orientation preference likely derived from the radial bias of their dendritic trees. Similar values of ellipticity index and orientation bias index have since been reported for lateral geniculate cells in cat (1.26, Soodak et al., 1987; 1.27 and 0.14, respectively, Shou & Leventhal, 1989) and monkey (1.35 and 0.18, respectively, Smith et al., 1990), leading the investigators to conclude that the orientation sensitivity of geniculate cells is largely a reflection of retinal input as opposed to cortical feedback (but see Vidyasagar & Urbas, 1982). Consistent with this interpretation, Thompson, Leventhal, Zhou and Liu (1994) found no difference in the distribution of orientation bias indices of geniculate cells after surgical ablation of the cortex. Geniculate cells have also been shown in cat and monkey to prefer radial orientations (Shou & Leventhal, 1989; Smith et al., 1990), lending additional support to the notion.
While the correspondence of previous results is compelling, their comparison deserves a word of caution. This is because most of the studies used response amplitude to quantify orientation sensitivity and, as evident in Figs. 2, 3, and 5, response amplitude depends on spatial frequency. Thus, ellipticity and orientation bias indices computed from orientation-dependent responses are not fixed quantities but functions of the spatial frequency characteristics of cells. Fig. 9a, for example, shows orientation tuning curves measured at different spatial frequencies above the optimal spatial frequency of a cell. The nearly parallel shift in the curves indicates that orientation sensitivity remained constant. Yet, ellipticity and orientation bias indices based on responses to the lowest and high frequency gratings would differ by a factor of ~2 (Fig. 9b). Comparing results based on response amplitude across cells or studies may be misleading (Leventhal, Thompson, Liu, Zhou & Ault, 1995). For this reason we followed Soodak et al. (1987) and computed ellipticity and orientation bias indices using center radius estimates extracted from a difference-of-Gaussian model of the receptive field. To the extent that the model captures the spatial frequency characteristics of cells, radius estimates provide a better indicator of orientation sensitivity than response amplitudes.
FIGURE 9.
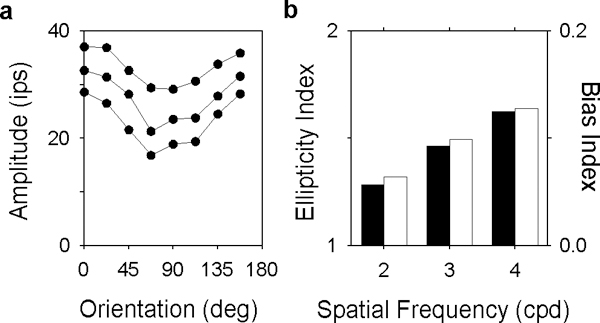
Measures of orientation sensitivity based on response amplitude depend on spatial frequency. a, orientation tuning curves of an OFF-center MC-pathway cell for a 2- (top), 3- (middle), and 4-cpd (bottom) drifting grating. Lines connect points of common spatial frequency. b, Ellipticity index (filled bars) and orientation bias index (unfilled bars) computed at each spatial frequency from response amplitude.
Our results overlap considerably with previous findings but differ in some respects. As noted by Smith et al. (1990), subcortical neurons appear to have more elongated receptive field centers in monkey than in cat. This conclusion is based on direct comparison of the mean ellipticity index of recorded cells in monkey with the same index reported by Soodak et al. (1987) for cat ganglion cells and geniculate cells, which was 30% smaller. No differences were apparent between cat and monkey in terms of orientation bias index but this may reflect the different methods used to compute bias index. Bias index is also a relatively insensitive indicator of center elongation (line in Fig. 7c). The greater center elongation in primate can be attributed mostly to the contributions of PC-pathway cells, which had a mean ellipticity index of 1.72 in our data set. The mean ellipticity index of MC-pathway cells was 1.38, more in line with findings in cat. Such a disparity in orientation sensitivity between cell types was not seen in cat nor in the lateral geniculate nucleus of monkey. It resulted from a relatively high incidence of bimodal center profiles among PC-pathway cells. These profiles usually had larger ellipticity indices than elliptical ones (Fig. 7c). Smith et al. (1990) reported that about half of their geniculate cells had spatial frequency curves with secondary peaks (eg., Fig. 5a), suggesting that the incidence of bimodal profiles is also high in the primate lateral geniculate nucleus. They did not specify the frequency of occurrence in the two cell types, so we cannot say whether the number of bimodal PC-pathway cells in the retina was excessive by comparison.
Ganglion cells also appear to have somewhat different orientation preference in monkey and cat. In that, disproportionate numbers of MC- and PC-pathway cells had tangentially-oriented receptive field centers in addition to radially-oriented ones. An overrepresentation of tangential orientations has been previously reported in the lateral geniculate nucleus of cats (Shou & Leventhal, 1989) and monkeys (Smith et al., 1990), but not in the retina. Hence, to account for the tangential bias of many geniculate cells, Shou and Leventhal (1989) suggested that extra-retinal mechanisms were involved. Our results indicate that such mechanisms may not be necessary to explain the orientation preferences of geniculate cells. At least in primate, the retinal input to the lateral geniculate nucleus may suffice.
Comparison with orientation sensitivity of visual cortical neurons
Orientation sensitivity is a response property typically associated with visual cortical cells. It differs from that of subcortical neurons in two main respects. Firstly, the degree of orientation tuning is generally much greater in the visual cortex. In cat, for example, the mean HWHH of cortical cells was around 17–25 deg across several studies (Campbell et al., 1968; Henry et al., 1974; Rose & Blakemore, 1974; Carandini & Ferster, 2000), whereas the mean HWHH of retinal ganglion cells in this study was 40 deg. In monkey, the disparity in tuning strength is specific to cortical layers. Outside layer 4C cells are sharply tuned for orientation, having mean bias indices in the range of 0.37–0.59 (Leventhal et al., 1995; Sato, Katsuyama, Tamura, Hata & Tsumoto, 1996; Ringach, Hawken & Shapley, 1997). Inside layer 4C, however, they show weak orientation tuning. The mean bias index (0.07–0.27 in the above studies) resembles that of ganglion cells (Fig. 7) and lateral geniculate cells (Smith et al., 1990). This suggests that the orientation sensitivity of layer 4C cells in primate visual cortex is largely a reflection of subcortical mechanisms and that the convergence of geniculate input is minimal. In contrast to our findings, the α (magnocellular) subdivision of layer 4C had greater orientation sensitivity than the β (parvocellular) subdivision (Blasdel & Fitzpatrick; 1984; Sato et al., 1996).
The second difference between cortical and subcortical orientation tuning lies in the preferred orientation of cells. Subcortical neurons tend to have radially- or tangentially-oriented receptive fields. While such biases have been reported in cat visual cortex (Payne & Berman, 1983; Schall, Vitek & Leventhal, 1986b), the receptive field centers of many cortical cells point in other directions (Hubel & Weisel, 1962). The cortex thus processes each point in visual space with a larger set of orientation sensors.
Functional significance of bimodal receptive field centers
In the fovea, midget (PC-pathway) ganglion cells have small dendritic fields that are thought to receive input from individual cones via midget bipolar cells (Polyak, 1941). The midget system maintains single cone connectivity up to ~10 degrees eccentricity (Dacey, 1993; Goodchild et al., 1995). Recent experiments using interference fringes to avoid optical blurring have shown that foveal PC cells in the lateral geniculate nucleus do, in fact, derive their major input from single cones but the experiments also revealed in many PC cells a contribution from nearby cones (McMahon et al., 2000). This could result from convergence of midget ganglion cell input onto PC cells in the lateral geniculate nucleus, although simultaneous recordings of prepotential and geniculate cell activity indicate that such convergence is minimal (Lee, Virsu & Creutzfeldt, 1983). Here we found that parafoveal PC-pathway ganglion cells had bimodal center profiles, even without bypassing the optics of the eye. This offers direct evidence that some midget ganglion cells in central retina derive input from more than one cone.
The convergence of cone input onto ganglion cells becomes increasingly significant in peripheral retina where dendritic trees and receptive field centers expand in size and the midget morphology is lost. In spite of cone convergence, Martin, Lee, White, Solomon and Rüttiger (2001) recently showed that up to ~50 deg eccentricity most PC-pathway cells exhibit the same degree of chromatic opponency as central ones. This implies that peripheral midget ganglion cells contact midget bipolar cells in a cone specific manner. Otherwise, they would receive mixed spectral input and lack chromatic opponency. It is unclear how the cells could make cone specific connections when their dendritic fields would overlay 10–40 medium- and long-wavelength cones. Wässle and Boycott (1991) suggested that dendritic tree morphology might be important. In macaque and human the dendritic fields of peripheral midget cells often consist of two or more distinct clusters (Polyak, 1941; Kolb et al., 1992; Dacey, 1993; Goodchild et al., 1995). Since the cone mosaic contains patches of cones of the same type (Roorda, Metha, Lennie & Williams, 2001), dendritic clusters could convey chromatic signals to PC-pathway cells by selecting patches of either M- or L-cones (Dacey, 1993; Goodchild et al., 1995; Martin et al., 2001). If so, parasol (MC-pathway) ganglion cells should not show dendritic clustering because they are not chromatically sensitive. Consistent with the cone specificity hypothesis, they have large uniform dendritic fields (Dacey, 1993). Our finding that bimodal receptive field centers were common in PC-pathway cells and rare in MC-pathway cells lends additional support to the hypothesis.
While the cone specificity hypothesis may explain bimodal center profiles in primate, it cannot explain them in cat. Although cats can make color discriminations, their performance is that of a dichromat with S- and M-cones (Daw & Pearlman, 1970; Loop, Millican & Thomas, 1987). The few chromatic cells that have been recorded all showed blue-green opponency (Daw & Pearlman, 1970; Cleland & Levick, 1974; Ringo & Wolbarsht, 1986), in agreement with the behavioral findings. Moreover, the cell types known to have bimodal centers have uniform dendritic fields. This suggests that another explanation for bimodal center profiles may be needed, such as null inhibition. Such inhibition may generate bimodal receptive field centers in rabbit amacrine and ganglion cells (see Fig. 20 of Bloomfield, 1994). Whether dendritic clustering, null inhibition, or some other mechanism accounts for bimodal receptive field centers remains to be determined, but it is intriguing that ganglion cells and lateral geniculate cells in both cat and monkey have this feature in common.
ACKNOWLEDGEMENTS
Supported by DFG grant Le-524/14-2, NATO grant CRG931162, and NIH grants F32-EY06908, R01-EY06669, and R01-EY13112. We thank Dario Ringach and David Ferster for helpful comments about cortical orientation tuning.
REFERENCES
- Blasdel GG, Fitzpatrick D (1984) Physiological organization of Layer 4 in macaque striate cortex. Journal of Neuroscience, 4, 880–895. [DOI] [PMC free article] [PubMed] [Google Scholar]
- Bloomfield SA (1994) Orientation-sensitive amacrine and ganglion cells in the rabbit retina. Journal of Neurophysiology, 71, 1672–1691. [DOI] [PubMed] [Google Scholar]
- Boycott BB and Wässle H (1974) The morphological types of ganglion cells of the domestic cat’s retina. Journal of Physiology, 240, 397–419. [DOI] [PMC free article] [PubMed] [Google Scholar]
- Campbell FW, Cleland BG, Cooper GF & Enroth-Cugell C (1968) The angular sensitivity of visual cortical cells to moving gratings. Journal of Physiology, 198, 237–250. [DOI] [PMC free article] [PubMed] [Google Scholar]
- Carandini M & Ferster D Membrane potential and firing rate in cat primary visual cortex. Journal of Neuroscience, 20, 470–484. [DOI] [PMC free article] [PubMed] [Google Scholar]
- Cleland BG & Levick WR (1974) Properties of rarely encountered types of ganglion cells in the cat’s retina and an overall classification. Journal of Physiology, 240, 457–492. [DOI] [PMC free article] [PubMed] [Google Scholar]
- Dacey DM (1993) The mosaic of midget ganglion cells in the human retina. Journal of Neuroscience, 13, 5334–5355. [DOI] [PMC free article] [PubMed] [Google Scholar]
- Daw NW & Pearlman AL (1970) Cat colour vision: evidence for more than one cone process. Journal of Physiology, 211, 125–137. [DOI] [PMC free article] [PubMed] [Google Scholar]
- Enroth-Cugell C & Robson JG (1966) The contrast sensitivity of retinal ganglion cells in the cat. Journal of Physiology, 187, 517–522. [DOI] [PMC free article] [PubMed] [Google Scholar]
- Fisher NI (1993) Statistical Analysis of Circular Data. Cambridge: Cambridge University Press. [Google Scholar]
- Goodchild AK, Ghosh KK, & Martin PR (1995) Comparison of photoreceptor spatial density and ganglion cell morphology in the retina of human, macaque monkey, cat, and the marmoset Callithrix jacchus. Journal of Comparative Neurology, 366, 55–75. [DOI] [PubMed] [Google Scholar]
- Hammond P (1974) Cat retinal ganglion cells: size and shape of receptive field centers. Journal of Physiology, 242, 99–118. [DOI] [PMC free article] [PubMed] [Google Scholar]
- Henry GH, Dreher B & Bishop PO (1974) Orientation specificity of cells in cat striate cortex. Journal of Neurophysiology, 37, 1394–1409. [DOI] [PubMed] [Google Scholar]
- Hubel DH & Wiesel TN (1962) Receptive fields, binocular interaction and functional architecture in the cat’s visual cortex. Journal of Physiology, 160, 106–154. [DOI] [PMC free article] [PubMed] [Google Scholar]
- Kolb H, Linberg KA & Fisher SK (1992) Neurons of the human retina: a Golgi study. Journal of Comparative Neurology, 318, 147–187. [DOI] [PubMed] [Google Scholar]
- Kremers J & Weiss S (1997) Receptive field dimensions of lateral geniculate cells in the common marmoset (Callithrix jacchus). Vision Research, 37, 2171–2181. [DOI] [PubMed] [Google Scholar]
- Lee BB, Creutzfeldt OD & Elepfandt A (1979) The response of magno- and parvocellular cells of the monkey’s lateral geniculate body to moving stimuli. Experimental Brain Research, 35, 547–557. [DOI] [PubMed] [Google Scholar]
- Lee BB, Virsu V & Creutzfeldt OD (1983) Linear signal transmission from prepotentials to cells in the macaque lateral geniculate nucleus. Experimental Brain Research, 52, 50–56. [DOI] [PubMed] [Google Scholar]
- Lee BB, Martin PR & Valberg A (1989) Sensitivity of macaque ganglion cells to chromatic and luminance flicker. Journal of Physiology, 414, 223–243. [DOI] [PMC free article] [PubMed] [Google Scholar]
- Leventhal AG & Schall JD (1983) Structural basis of orientation selectivity of cat retinal ganglion cells. Journal of Comparative Neurology, 220, 465–475. [DOI] [PubMed] [Google Scholar]
- Leventhal AG, Thompson KG, Liu D, Zhou Y & Ault SJ (1995) Concomitant sensitivity to orientation, direction, and color of cells in layers 2, 3, and 4 of monkey striate cortex. Journal of Neuroscience, 15, 1808–1818. [DOI] [PMC free article] [PubMed] [Google Scholar]
- Levick WR & Thibos LN (1980) Orientation bias of cat retinal ganglion cells. Nature, 286, 389–390. [DOI] [PubMed] [Google Scholar]
- Levick WR & Thibos LN (1982) Analysis of orientation bias in cat retina. Journal of Physiology, 329, 243–261. [DOI] [PMC free article] [PubMed] [Google Scholar]
- Loop MS, Millican CL & Thomas SR (1987) Photopic spectral sensitivity of the cat. Journal of Physiology, 382, 537–553. [DOI] [PMC free article] [PubMed] [Google Scholar]
- Martin PR, Lee BB, White AJR, Solomon SG & Rüttiger L (2001) Chromatic sensitivity of ganglion cells in the peripheral primate retina. Nature, 410, 933–936. [DOI] [PubMed] [Google Scholar]
- McMahon MJ, Lankheet MJM, Lennie P & Williams DR (2000) Fine structure of parvocellular receptive fields in the primate fovea revealed by laser interferometry. Journal of Neuroscience, 20, 2043–2053. [DOI] [PMC free article] [PubMed] [Google Scholar]
- Payne BR & Berman N (1983) Functional organization of neurons in cat striate cortex: Variations in preferred orientation and orientation selectivity with receptive-field type, ocular dominance, and location in visual-field map. Journal of Neurophysiology, 49, 1051–1072. [DOI] [PubMed] [Google Scholar]
- Peichl L & Wässle H (1981) Morphological identification of on- and off-center brisk transient (Y) cells in the cat retina. Proceedings of the Royal Society of London B, 212, 139–156. [DOI] [PubMed] [Google Scholar]
- Polyak SL (1941) The Retina. Chicago: Chicago University Press. [Google Scholar]
- Ringach DL, Hawken MJ, Shapley R (1997) Dynamics of orientation tuning in macaque primary visual cortex. Nature, 387, 281–284. [DOI] [PubMed] [Google Scholar]
- Ringo JL & Wolbarsht ML (1986) Spectral coding in cat retinal ganglion cell receptive fields. Journal of Neurophysiology, 55, 320–330. [DOI] [PubMed] [Google Scholar]
- Rodieck RW (1965) Quantitative analysis of cat retinal ganglion cell response to visual stimuli. Vision Research, 5, 583–601. [DOI] [PubMed] [Google Scholar]
- Roorda A, Metha AB, Lennie P & Williams DR (2001) Packing arrangement of the three cone classes in primate retina. Vision Research, 41, 1291–1306. [DOI] [PubMed] [Google Scholar]
- Rose D & Blakemore C (1974) An analysis of orientation selectivity in the cat’s visual cortex. Experimental Brain Research, 20, 1–17. [DOI] [PubMed] [Google Scholar]
- Sato H, Katsuyama N, Tamura H, Hata Y & Tsumoto T (1996) Mechanisms underlying orientation selectivity of neurons in the primary visual cortex of the macaque. Journal of Physiology, 494, 757–771. [DOI] [PMC free article] [PubMed] [Google Scholar]
- Schall JD, Perry VH & Leventhal AG (1986a) Retinal ganglion cell dendritic fields in old-world monkeys are oriented radially. Brain Research, 368, 18–23. [DOI] [PubMed] [Google Scholar]
- Schall JD, Vitek DJ & Leventhal AG (1986b) Retinal constraints on orientation specificity in cat visual cortex. Journal of Neuroscience, 6, 823–836. [DOI] [PMC free article] [PubMed] [Google Scholar]
- Shou T & Leventhal AG (1989) Organized arrangement of orientation-sensitive relay cells in the cat’s dorsal lateral geniculate nucleus. Journal of Neuroscience, 9, 4287–4302. [DOI] [PMC free article] [PubMed] [Google Scholar]
- Smith EL III, Chino YM, Ridder WH III, Kitagawa K, & Langston A (1990) Orientation bias of neurons in the lateral geniculate nucleus of macaque monkeys. Visual Neuroscience, 5, 525–545. [DOI] [PubMed] [Google Scholar]
- Soodak RE (1986) Two-dimensional modeling of visual receptive fields using Gaussian subunits. Proceedings of the National Academy of Science, 83, 9259–9263. [DOI] [PMC free article] [PubMed] [Google Scholar]
- Soodak RE, Shapley RM & Kaplan E (1987) Linear mechanism of orientation tuning in the retina and lateral geniculate nucleus of the cat. Journal of Neurophysiology, 58, 267–275. [DOI] [PubMed] [Google Scholar]
- Soodak RE, Shapley RM, & Kaplan E (1991) Fine structure of receptive-field centers of X and Y cells of the cat. Visual Neuroscience, 6, 621–628. [DOI] [PubMed] [Google Scholar]
- Thibos LN & Levick WR (1983) Bimodal receptive fields of cat retinal ganglion cells. Vision Research, 23, 1561–1572. [DOI] [PubMed] [Google Scholar]
- Thompson KG, Leventhal AG, Zhou Y & Liu D (1994) Stimulus dependence of orientation and direction sensitivity of cat LGNd relay cells without cortical inputs: a comparison with area 17 cells. Visual Neuroscience, 11, 939–951. [DOI] [PubMed] [Google Scholar]
- Troy JB (1993) Modeling the receptive fields of mammalian retinal ganglion cells In Lam DM & Shapley RM (eds.) Contrast Sensitivity: from receptors to clinic. Proceedings of the Retina Research Foundation series 3. pp. 85–102. Cambridge, MA: MIT press. [Google Scholar]
- Vidyasagar TR & Urbas JV (1982) Orientation sensitivity of cat LGN neurons with and without inputs from visual cortical areas 17 and 18. Experimental Brain Research, 46, 157–169. [DOI] [PubMed] [Google Scholar]
- Vidyasagar TR & Heide W (1984) Geniculate orientation biases seen with moving sine wave gratings: implications for a model of simple cell afferent connectivity. Experimental Brain Research, 57, 196–200. [DOI] [PubMed] [Google Scholar]
- Wässle H & Boycott BB (1991) Functional architecture of the mammalian retina. Physiological Reviews, 71, 447–480. [DOI] [PubMed] [Google Scholar]
- Watanabe M & Rodieck RW (1989) Parasol and midget ganglion cells of the primate retina. Journal of Comparative Neurology, 289, 434–454. [DOI] [PubMed] [Google Scholar]