

Abstract
Background
Current guidelines are inadequate for use in predicting ITP recurrence. Therefore, our primary goal in this study was to investigate the association of platelet-to-lymphocyte ratio (PLR) at diagnosis with ITP recurrence in Chinese patients.
Material/Methods
We performed a historical cohort study and non-selectively enrolled 233 patients with newly-identified ITP from March 2013 to June 2017. The independent variable was PLR recorded at diagnosis and the dependent variable was recurrence-free survival (RFS) at 6 months. Data on the following variables were also collected for establishing a multivariate Cox regression model: demographic details, general details, and variables found to be closely related to PLR in previous studies, as well as risk factors for ITP recurrence.
Results
During follow-up, 85 patients had an event within 6 months. At the range of 0.86–9.7 of PLR, a 1-unit increase in PLR was associated with a 13% decrease in ITP recurrence (hazard ratio: 0.87; 95% confidence interval: 0.78–0.97), whereas no association was detected at the range of 9.7–33.75 of PLR (hazard ratio: 0.99; 95% confidence interval: 0.95–1.04). An interaction test indicated that patients with HP infection (0.91 (0.86–1.97)) or diabetes history (0.86 (0.78–0.96)) showed a stronger association compared with patients without HP infection (1.01 (0.95–1.04) and those without diabetes (1.01 (0.97–1.04)).
Conclusions
Our findings suggest that PLR is a useful parameter to consider when hematologists attempt to assess the risk of recurrence in ITP patients receiving first-line therapy, and the nonlinearity of PLR and ITP recurrence risk must be fully considered when constructing predictive models.
MeSH Keywords: Blood Platelets; Purpura, Thrombocytopenic, Idiopathic; Recurrence
Background
Immune thrombocytopenia (ITP) is an immune-mediated acquired disease. Its clinical manifestations include transient or persistent decrease of the platelet count, thrombocytopenia, and bleeding. The traditional concept holds that the core pathogenesis of ITP is the presence of antibodies against platelet glycoproteins [1]. More recently, inflammation has also been shown to be closely related to the pathogenesis and prognosis of ITP [1]. According to the current Chinese Consensus for Immune Thrombocytopenia (ITP) Diagnosis and Treatment (2016 version) [2], between 75 000 and 150 000 (5–10/100 000) adult cases would be newly diagnosed with immune thrombocytopenia (ITP) and roughly half of these cases would relapse within 6 months after first-line treatment in China in 2016. Although there has been important progress in the diagnosis and treatment of ITP in recent years, there are no well-established Chinese guidelines to predict recurrent risk at diagnosis [3]. Due to the high recurrence rate of newly-diagnosed ITP, sensitive markers are needed to improve risk-stratification algorithms.
Platelet-to-lymphocyte ratio (PLR) is an inflammatory biomarker that might play an important role in predicting the prognosis of patients with gastrointestinal and female reproductive system tumors [4–7]. PLR is also used to predict the prognosis of other diseases [8–10]. However, there appear to be have been no previous studies investigating the link between PLR and the risk of relapse in newly-diagnosed ITP in adults. A recent series of observational studies have reported that absolute lymphocyte count and platelet count at baseline are associated with ITP clinical characteristics and outcomes [11–13]. Growing evidence also suggests that ITP is closely correlated with inflammation, and inflammation can trigger ITP. In summary, we speculate that the baseline PLR, which is an indicator derived from platelets, lymphocytes, and inflammatory response factor, may be associated with the risk of recurrence in adult patients with newly-identified ITP who have received first-line treatment.
We used a historical cohort study to investigate whether PLR obtained at baseline is independently associated with ITP relapse after adjusting for other covariates.
Material and Methods
Study design
This was a historical cohort study.
Study setting
The Guizhou provincial People’s Hospital, Guiyang city, China.
Data source
We non-selectively and consecutively retrieved data for all participants with newly-diagnosed ITP from electronic medical records. In our center, each patient has a unique hospitalization number. When we extracted patients’ clinical records to build a database, we used the hospital number information instead of their names. In addition to our final data analysis, we removed the hospitalization number and generated a unique sequence based on each unique hospitalization number. Therefore, the requirement for patient informed consent was waived and the data was anonymous and the privacy of patients was protected. The Hospital Institutional Review Board approved this study.
Study cohort
The cohort included 437 patients aged 14–89 years with newly-diagnosed ITP. Cohort entry was the date of the first PLR any time from March 2013 to June 2017. We diagnosed patients according to the published guidelines [14]. Patients were included if they: (1) were newly identified with ITP (ITP diagnosis time was under 3 months); (2) were non-secondary ITP (e.g., other thrombocytopenic diseases or myelofibrosis); or (3) had no spleen enlargement. Exclusion criteria were: (a) hepatitis B, hepatitis C, or AIDS patients; (b) pregnant; (c) had concurrent severe dysfunction in a vital organ (e.g., heart, kidneys, liver, or lungs); (d) history of immunosuppressive use in the last 3 months; or (e) had no response to first-line treatment.
Variables
We specified the value of PLR at diagnosis as an untransformed continuous variable. For each enrolled patient, 2 ml of venous blood was put in an anticoagulant tube containing EDTA, and then tested using a blood cell classification automatic analyzer (BM830, Bao Ling Man Sunshine Technology Co., China) at the central laboratory of our institution. The reference ranges at our institute for platelet and absolute lymphocyte counts are 100–300×109/L and 1.1–3.2×10⁹/L, respectively.
The selection of covariates included in this study was based on our previous work and other relevant published studies. Therefore, we collected data on the following variables for data analysis: sex, age, height, weight, smoking status, drinking alcohol, HP burden status [15], comorbidity (type 2 diabetes [16], CVD [17–19], hyperuricemia [20]), bleeding-related symptoms (in skin, in mucosa, or in organs), first-line treatment (including oral prednisone or intravenous drip high-dose dexamethasone, intravenous immunoglobulin), mean platelet volume (MPV) [21], and mean platelet distribution width (MPD) at diagnosis.
We used recurrence-free survival (RFS) within 6 months as the outcome in this study. On the basis of the published guideline [14], the definition of ITP relapse was loss of complete remission (or response) during the follow-up period (6 months). To ensure accuracy, we used the 2 lowest platelet counts recorded at least 1 day apart. If patients were lost to follow-up, their data were excluded from the event records. The criteria for determining complete remission were mainly determined by platelet calculation (above 100×109/L) with bleeding symptoms (absence) after a cycle of first-line treatment. The criteria for determining response (R) were based on platelet calculation (beyond 30×109/L) and platelet trend (at least a 2-fold elevation of platelet count at diagnosis) and bleeding symptom (absence). We defined no response (NR) as platelet calculation under 30×109/L, a 2-fold increase in platelet count at baseline, or bleeding.
First-line treatment strategies
The first-line treatment was glucocorticoid administration, including oral prednisone or intravenous drip high-dose dexamethasone with or without intravenous immunoglobulin. The selection of first-line treatment alternatives for enrolled patients was determined by their pre-treatment platelet count and severity of bleeding symptoms [14].
High-dose dexamethasone: 40 mg/day, orally, days 1–4 and days 15–18, monitoring blood pressure and blood glucose during treatment, and simultaneously receiving proton pump inhibitors to protect gastric mucosa.
Oral prednisone: Starting dose at 1 mg/kg/day, orally, quickly reduced to the maintenance dose (15 mg/day) after remission, until drug withdrawal.
Intravenous immunoglobulin (IVIG) regimen: 400 mg/kg/day, days 1–5, mainly used for emergency treatment of ITP (continuous and severe bleeding symptoms, platelets below 20×109/L).
Statistical analysis
According the data distribution, we expressed continuous variables as mean±standard deviation (normal distribution) or median (quartile) (skewed distribution). We expressed categorical variables as percentages. To observe the distribution of baseline characteristics among different PLR groups (quartile, Q1 to Q4), we used the chi-square test (categorical variables), one-way ANOVA (normal distribution), or Kruskal-Wallis H test (skewed distribution).
Following the suggestions in the STROBE statement [21], the whole statistical analysis can be summarized as follows: (1) We assessed the linear relationship between the exposure variable (PLR) and ITP recurrence (i.e., the multivariable Cox model) after adjusting for other potential confounders; (2) Since PLR is a continuous variable, we also discussed its nonlinear correlation (in the generalized additive model); once we found the existence of a nonlinear relationship, we then calculated the inflection point [22] and clarified the correlation on the left and right sides of the inflection point (using the two-piecewise model); (3) We assessed the difference in the association between PLR and ITP recurrence in different populations (using the stratified proportional hazard model).
For data analysis, we used the was R package (http:www.R-project.org, The R Foundation) and EmpowerStats (http:www.empowerstats.com, X&Y Solutions, Boston, MA) statistical software. P values less than 0.05 (two-sided) were considered statistically significant.
Results
Screening and baseline characteristics of patients
There were 437 adult participants between the ages of 14 and 89 years with newly-diagnosed ITP. After screening, 233 patients remained for data analysis (Figure 1). Among these 233 patients, 85 patients (85/233, 36.48%) had an event within 6 months. The mean and standard deviations of age of selected patients was 41.1±19.0 years, and 33.9% (79/233) were male. According to quartile of PLR, no statistically significant differences were detected in age, sex, weight, height, smoking status, alcohol consumption, HP infection, diabetes history, hyperuricemia, cardiovascular diseases, MPV, bleeding in skin, bleeding in mucosa, bleeding in organ, high-dose dexamethasone, oral prednisone, MPD, or duration of prednisone use among different PLR groups. Compared with group Q1, there were significantly fewer patients using IVIG in group Q2–Q4 (Table 1).
Figure 1.
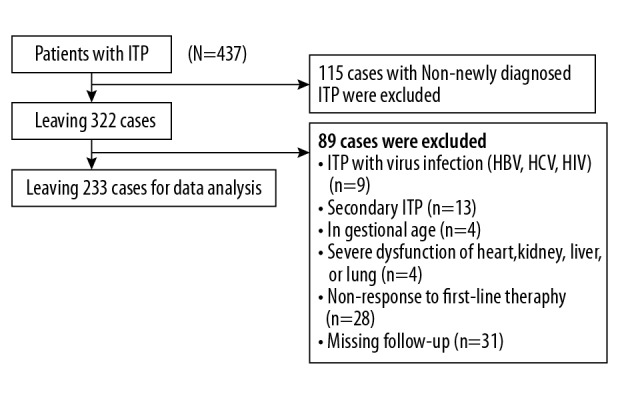
Flow chart of participant selection. The figure shows the full process of subject selection. We initially collected a total of 437 patients who were diagnosed as having ITP. Then, we restricted our analyses to patients with newly-diagnosed ITP (n=322, 115 cases were excluded). Then, we have further excluded 85 patients with virus infection (n=9), secondary ITP (n=13), pregnancy (n=4), severe organ dysfunction (n=4), and non-response to first-line therapy (n=28). During follow-up, 31 cases were excluded due to loss to follow-up, leaving 233 patients for final data analyses.
Table 1.
The description of baseline clinical characteristics of patients with newly-identified ITP.
| PLR, quartile | Q1 | Q2 | Q3 | Q4 | P value |
|---|---|---|---|---|---|
| N | 57 | 59 | 58 | 59 | |
| Age (year, median (min, max)) | 44.00 (15.00–81.00) | 40.00 (15.00–79.00) | 37.50 (14.00–88.00) | 31.00 (14.00–89.00) | 0.359 |
| Height (cm, mean±sd) | 161.84 (9.52) | 161.17 (7.96) | 163.78 (8.96) | 162.54 (8.06) | 0.408 |
| Weight (kg, mean±sd) | 59.23 (10.70) | 59.49 (10.01) | 57.38 (9.79) | 57.41 (7.98) | 0.487 |
| MPD (fL, mean±sd) | 16.38 (4.33) | 15.87 (4.34) | 16.15 (4.56) | 16.96 (4.24) | 0.58 |
| Relapse time (day, mean±sd) | 128.35 (57.71) | 146.51 (49.66) | 140.55 (53.73) | 145.02 (52.25) | 0.252 |
| Sex (n, %) | 0.621 | ||||
| Male | 23 (40.35%) | 20 (33.90%) | 19 (32.76%) | 17 (28.81%) | |
| Female | 34 (59.65%) | 39 (66.10%) | 39 (67.24%) | 42 (71.19%) | |
| Smoking (n, %) | 0.956 | ||||
| No | 38 (66.67%) | 40 (67.80%) | 38 (65.52%) | 44 (74.58%) | |
| Current smoker | 14 (24.56%) | 15 (25.42%) | 15 (25.86%) | 11 (18.64%) | |
| Ex-smoker | 5 (8.77%) | 4 (6.78%) | 5 (8.62%) | 4 (6.78%) | |
| Alcohol consumption (n, %) | 0.376 | ||||
| No | 45 (78.95%) | 45 (76.27%) | 48 (82.76%) | 52 (88.14%) | |
| Yes | 12 (21.05%) | 14 (23.73%) | 10 (17.24%) | 7 (11.86%) | |
| HP infection (n, %) | 0.616 | ||||
| Negative | 43 (75.44%) | 49 (83.05%) | 49 (84.48%) | 47 (79.66%) | |
| Positive | 14 (24.56%) | 10 (16.95%) | 9 (15.52%) | 12 (20.34%) | |
| Diabetes history (n, %) | 0.99 | ||||
| No | 49 (85.96%) | 51 (86.44%) | 51 (87.93%) | 50 (86.21%) | |
| Yes | 8 (14.04%) | 8 (13.56%) | 7 (12.07%) | 8 (13.79%) | |
| Hyperuricemia (n, %) | 0.851 | ||||
| No | 48 (84.21%) | 51 (86.44%) | 48 (82.76%) | 52 (88.14%) | |
| Yes | 9 (15.79%) | 8 (13.56%) | 10 (17.24%) | 7 (11.86%) | |
| Cardiovascular diseases (n, %) | 0.59 | ||||
| No | 52 (91.23%) | 50 (84.75%) | 49 (84.48%) | 53 (89.83%) | |
| Yes | 5 (8.77%) | 9 (15.25%) | 9 (15.52%) | 6 (10.17%) | |
| Bleeding in skin (n, %) | 0.541 | ||||
| No | 42 (73.68%) | 47 (79.66%) | 43 (74.14%) | 40 (67.80%) | |
| Yes | 15 (26.32%) | 12 (20.34%) | 15 (25.86%) | 19 (32.20%) | |
| Bleeding in mucosa (n, %) | 0.35 | ||||
| No | 47 (82.46%) | 45 (76.27%) | 40 (68.97%) | 42 (71.19%) | |
| Yes | 10 (17.54%) | 14 (23.73%) | 18 (31.03%) | 17 (28.81%) | |
| Bleeding in organ (n, %) | 0.857 | ||||
| No | 53 (92.98%) | 53 (89.83%) | 54 (93.10%) | 53 (89.83%) | |
| Yes | 4 (7.02%) | 6 (10.17%) | 4 (6.90%) | 6 (10.17%) | |
| High-dose dexamethasone (n, %) | 0.578 | ||||
| No | 45 (78.95%) | 41 (69.49%) | 40 (68.97%) | 41 (69.49%) | |
| Yes | 12 (21.05%) | 18 (30.51%) | 18 (31.03%) | 18 (30.51%) | |
| Oral prednisone (n, %) | 0.578 | ||||
| No | 12 (21.05%) | 18 (30.51%) | 18 (31.03%) | 18 (30.51%) | |
| Yes | 45 (78.95%) | 41 (69.49%) | 40 (68.97%) | 41 (69.49%) | |
| IVIG (n, %) | <0.001 | ||||
| No | 12 (21.05%) | 21 (35.59%) | 46 (79.31%) | 45 (76.27%) | |
| Yes | 45 (78.95%) | 38 (64.41%) | 12 (20.69%) | 14 (23.73%) | |
| Outcome (n, %) | 0.394 | ||||
| No relapse | 31 (54.39%) | 40 (67.80%) | 37 (63.79%) | 40 (67.80%) | |
| Relapse | 26 (45.61%) | 19 (32.20%) | 21 (36.21%) | 19 (32.20%) | |
| Duration of prednisone (Day) | 34.05 (5.56) | 34.47 (5.90) | 33.02 (5.05) | 33.69 (5.35) | 0.528 |
| MPV | 14.23 (6.57) | 12.04 (5.99) | 13.41 (6.10) 12.20 | 12.98 (6.14) | 0.289 |
| Peripheral blood lymphocyte count | 1.14 (0.43) | 1.06 (0.28) | 1.13 (0.25) | 1.04 (0.22) | 0.200 |
| Platelet count at baseline | 3.78 (1.87) | 8.67 (2.31) | 15.31 (4.19) | 22.40 (4.48) | <0.001 |
MPV – indicates mean platelet volume; MPD – indicates mean platelet distribution width; HP – indicates infection of helicobacter pylori; IVIG – indicated intravenous immunoglobulin; PLR – indicated platelet-to-lymphocyte ratio.
Univariate analysis
Univariate Cox regression analysis (Table 2) showed that age (1.03, 1.02–1.04), HP infection (hazard ratio (HR): 3.17; 95% confidence interval (CI): 2.03–4.94), bleeding in mucosa (HR: 2.07; 95% CI: 1.33–3.23), bleeding in organ (HR: 1.88; 95% CI: 1.04–3.39), MPV (HR: 1.20; 95% CI: 1.15–1.24), MPD (HR: 1.06; 95% CI: 1.01–1.11), and duration of prednisone use (HR: 1.06; 95% CI: 1.02–1.10) were risk factors for ITP relapse. Conversely, the use of IVIG (HR: 0.60; 95% CI: 0.39–0.94) was a protective factor for ITP recurrence.
Table 2.
Univariate analysis for the link among variables.
| HR 95% CI (lower, upper) | P values | |
|---|---|---|
| Sex | ||
| Male | Reference | |
| Female | 0.95 (0.60, 1.48) | 0.81 |
| Smoking | ||
| No smoking | Reference | |
| Current smoking | 0.99 (0.60, 1.65) | 0.97 |
| Ex-smoking | 1.33 (0.64, 2.79) | 0.45 |
| Alcohol consumption | ||
| No | Reference | |
| Yes | 1.31 (0.78, 2.21) | 0.31 |
| HP infection | ||
| Negative | Reference | |
| Positive | 3.17 (2.03, 4.94) | <0.0001 |
| Diabetes history | ||
| No | Reference | |
| Yes | 1.46 (0.84, 2.56) | 0.18 |
| Hyperuricemia | ||
| No | Reference | |
| Yes | 1.07 (0.59, 1.93) | 0.82 |
| Cardiovascular diseases | ||
| No | Reference | |
| Yes | 1.42 (0.80, 2.52) | 0.23 |
| Baseline platelets | 0.99 (0.96, 1.02) | 0.54 |
| Bleeding in skin | ||
| No | Reference | |
| Yes | 0.61 (0.36, 1.06) | 0.07 |
| Bleeding in mucosa | ||
| No | Reference | |
| Yes | 2.07 (1.33, 3.23) | 0.01 |
| Bleeding in organ | ||
| No | Reference | |
| Yes | 1.88 (1.04, 3.39) | 0.04 |
| High-dose dexamethasone | ||
| No | Reference | |
| Yes | 1.30 (0.82, 2.05) | 0.26 |
| Oral prednisone | ||
| No | Reference | 1.0 |
| Yes | 0.77 (0.49, 1.21) | 0.25 |
| IVIG | ||
| No | Reference | |
| Yes | 0.60 (0.39, 0.94) | 0.02 |
| MPV | 1.20 (1.15, 1.24) | <0.0001 |
| MPD | 1.06 (1.01, 1.11) | 0.02 |
| PLR | 0.98 (0.95, 1.01) | 0.25 |
| Duration of prednisone use | 1.06 (1.02–1.10) | 0.003 |
| Age | 1.03 (1.02, 1.04) | <0.0001 |
| Height | 1.01 (0.97, 1.02) | 0.91 |
| Weight | 1.02 (1.00, 1.04) | 0.12 |
HR – indicates hazard ratio; CI – indicates confidence interval; Ref – indicates reference.
The results of multivariate Cox regression models
In the crude model, the hazard ratio (HR) was 0.98 and the range of 95% confidence interval (CI) was 0.95–1.01 (Table 3), showing that the 1-unit increase in PLR was associated with a 5% decreased risk of ITP relapse. The same trend also was observed in another model in which we only adjusted for age, sex, height, and weight). In the completed adjusted model (adjusted for all covariates presented in Table 1), a 1-unit increase in PLR was associated with a 4% decrease in ITP recurrence, and the 95% CI was 0.93–1.00.
Table 3.
Multivariate analysis and presentation using non-adjusted and adjusted models.
| Exposure | Crude model (HR, 95% CI, P) | Adjusted model 1(HR, 95% CI, P) | Adjusted model 2(HR, 95% CI, P) |
|---|---|---|---|
| PLR | 0.98 (0.95, 1.01) 0.364 | 0.99 (0.96, 1.02) 0.595 | 0.97 (0.93, 1.00) 0.074 |
| Lymphocyte count | 4.83 (2.58, 9.03) <0.0001 | 3.60 (1.89, 6.87) 0.0001 | 2.08 (1.12, 3.87) 0.0203 |
| Platelet count | 0.99 (0.97, 1.02) 0.5561 | 0.99 (0.97, 1.02) 0.6338 | 0.97 (0.94, 1.00) 0.0521 |
Crude model: not adjusted for other covariates. Adjusted model 1: adjusted for age and sex. Adjusted model 2: adjusted for age, sex, HP infection, MPV, bleeding in mucosa, bleeding in organ, IVIG, MPD, duration of prednisone. HR – hazard ratio; CI – confidence interval.
Addressing nonlinearity
We used GAM and two-piecewise Cox equation to elucidate this nonlinear link and observe the potential saturation or threshold effect (Figure 2, Table 4). In this research, we observed that the relationship between PLR and risk of relapse was nonlinear (after adjusting for all covariates presented in Table 1). By use of a recurrence method algorithm, we found the inflection point was 9.7. Using the two-piecewise Cox regression model, we observed different trends of HR on left and right sides of the inflection point. On the left of the inflection point (PLR <9.7), a 1-unit increase in PLR at diagnosis was correlated with a 13% decrease in ITP relapse risk (HR=0.87, 95% CI was 0.78–0.97). On the right of the inflection point, however, the link between PLR and ITP relapse was not detected (HR=0.99, 95% CI: 0.95–1.04), meaning that this decrease in risk is saturated after PLR exceeds 9.7, as the concomitant risk of ITP relapse is not apparent with PLR above 9.7. We also showed the non-adjusted results of the two-piece model. Although the HR values and 95% CI showed slight changes compared with adjusted results, an PLR less than 9.7 was still significantly associated with ITP recurrence during follow-up.
Figure 2.
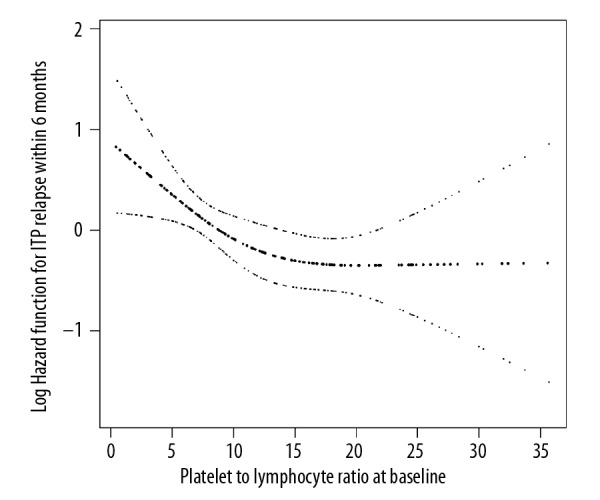
The icon for nonlinearity of PLR and risk of ITP recurrence. The saturate effect can be observed from Figure 2, as we did not observe a corresponding decrease for the risk of relapse after PLR exceeded 9.7.
Table 4.
Nonlinearity addressing using two-piecewise model.
| Inflection point of PLR | Effect size (HR) | 95% CI | P value |
|---|---|---|---|
| <9.7 | 0.87 | 0.78–0.97 | 0.01* |
| ≥9.7 | 0.99 | 0.95–1.04 | 0.77* |
| <9.7 | 0.90 | 0.74–0.95 | 0.03# |
| ≥9.7 | 1.03 | 0.74–1.24 | 0.83# |
Independent variable: PLR Dependent variable: ITP recurrence after treating with first-line treatment (no relapse, relapse).
The strategy of adjustment was the same as Table 3;
no covariates were adjusted.
The results of subgroup analyses
We found a significant interaction between PLR and diabetes history (P for interaction was 0.037). Subgroup analyses (Table 5) revealed that patients complicated with diabetes had a higher estimated protective effect (HR: 0.86; 95% CI: 0.78–0.96) of newly-diagnosed ITP relapse in association with PLR than in patients who had no diabetes history (HR: 1.01; 95% CI: 0.97–1.04). The protective effect of PLR associated with ITP relapse was significantly below 1 in the diabetes subgroups, but this protective effect was not observed in non-diabetic populations. We also detected a significant interaction between PLR and Hp infection (P for interaction=0.029). In terms of HP infection, the direction of effect size HR of ITP relapse on PLR is reversed in patients with or without a HP infection (as assessed by log likelihood ratio test). The negative correlation between PLR and newly-identified ITP recurrence was only detected in patients with HP infection (HR: 0.91; 95% CI: 0.86–0.97) and was not detected in those without HP infection (HR: 1.01; 95% CI: 0.97–1.03).
Table 5.
Results of subgroup analysis and interaction analysis.
| Characteristic | HR (95% CI) | P for interaction |
|---|---|---|
| Sex | 0.310 | |
| Male | 0.96 (0.91–1.01) | |
| Female | 1.00 (0.96–1.04) | |
| Alcohol consumption | 0.968 | |
| No | 0.98 (0.95–1.01) | |
| Yes | 0.97 (0.89–1.06 | |
| HP infection | 0.029 | |
| Negative | 1.01 (0.95–1.04) | |
| Positive | 0.91 (0.86–1.97) | |
| Diabetes history | 0.037 | |
| No | 1.01 (0.97–1.04) | |
| Yes | 0.86 (0.78–0.96) | |
| Hyperuricemia | 0.981 | |
| No | 1.01 (0.97–1.03) | |
| Yes | 0.93 (0.85–1.03) | |
| CVD | 0.628 | |
| No | 0.98 (0.95–1.01) | |
| Yes | 0.97 (0.89–1.07) | |
| Bleeding in skin | 0.616 | |
| No | 0.98 (0.95–1.01) | |
| Yes | 1.00 (0.94–1.08) | |
| Bleeding in mucosa | 0.594 | |
| No | 0.98 (0.94–1.01) | |
| Yes | 1.00 (0.94–1.06) | 0.94 |
| Bleeding in organ | 0.248 | |
| No | 1.01 (0.97–1.94) | |
| Yes | 0.95 (0.87–1.05) | |
| High-dose dexamethasone | 0.058 | |
| No | 1.01 (0.95–1.08) | |
| Yes | 0.92 (0.87–0.98)) | |
| Oral prednisone | 0.058 | |
| No | 0.92 (0.87–0.98)) | |
| Yes | 1.01 (0.95–1.08) | |
| IVIG | 0.445 | |
| No | 0.97 (0.94–1.01) | |
| Yes | 0.95 (0.89–1.01) | |
| Smoking status | 0.116 | |
| No | 0.99 (0.95, 1.03) | |
| Current smoker | 0.95 (0.87, 1.03) | |
| Ex-smoker | 0.79 (0.66, inf) | |
| Age (quintile) | 0.640 | |
| Q1 (14–22 year) | 1.02 (0.94, 1.11) | |
| Q2 (23–31year) | 0.94 (0.86, 1.03) | |
| Q3 (32–44 year) | 0.99 (0.92, 1.07) | |
| Q4(45–61 year) | 0.94 (0.86, 1.04) | |
| Q5 (62–88 year) | 0.98 (0.91, 1.05) | |
Above model adjusted for covariates presented in Table 1. For each interaction term, we did not adjust for the stratification variable.
Discussion
This retrospective cohort study investigated the association of PLR at baseline with ITP recurrence at 6-month follow-up and found that PLR at the range of 0.86–9.7 was associated with a significantly decreased risk of ITP relapse. However, when the PLR was greater than 9.7, a continued increase did not further reduce the risk of ITP recurrence. In subgroup analyses, a lower recurrence risk was observed in patients with HP infection and diabetes (with a 9% and 14% decreased risk, respectively). In summary, our analysis suggests that PLR at baseline is associated with decreased ITP recurrence risk and has potential use as a marker for prediction of ITP recurrence.
Although the treatment of ITP has made great progress, the risk of recurrence of ITP is still high. Unfortunately, the causes and risk factors for recurrence in ITP patients have not yet been elucidated. Epidemiological data indicated that ITP recurrence events occur in about half of newly-diagnosed ITP patients who received first-line treatment. We found that 85 patients (85/233, 36.48%) relapsed after 6 months. Although there is a paucity of published data from observational and experimental studies on the correlation between PLR and ITP recurrence, the prognostic values of initial platelet and lymphocyte counts have been reported. In a small (n=64) observational study, platelet counts >6.950/mm3 and absolute lymphocyte counts (ALC) ≤2.050/mm3 were associated with a significant risk for developing chronic ITP [23]. In a larger (n=188) observational study of newly-diagnosed ITP, ALC <3050/mL was associated with a significant risk for development of persistent ITP beyond 6 months [24]. Akbayram et al. reached a similar conclusion [25]. However, the target populations for the above studies were children, and no corresponding data have been reported in adult ITP patients. A French multicenter prospective cohort study published in Haematologica (2016) reported that higher platelet counts at diagnosis are negatively correlated with the risk of chronicity [26], which is consistent with our finding.
Following the suggestions of the STROBE statement, subgroup analysis is helpful to explore information in data analysis. Our present of interaction test results are shown in Table 5. A different trend of hazard ratio was observed in HP infection and diabetes history. Compared with patients without HP infection, the protective effect of PLR on ITP recurrence was weak in patients with HP infection. The same trend also was observed with diabetes. Therefore, the results obtained by subgroup analysis have the following clinical utility. (1) The effect of PLR on the recurrence of ITP (protection effect) is population-specific. Hematologists can develop more individual treatment protocol based on PLR value at diagnosis and precisely assess prognosis in different subgroups. (2) Both HP infection and diabetes are correlated with ITP clinical characteristics and outcomes, and this relationship has been confirmed by previous clinical studies [15,27,28]. In this study, our findings at least demonstrated that PLR can weaken the adverse effect on ITP relapse caused by HP infection and diabetes. However, it must be noted that this result was observed only in this study and further studies are needed to validate our results, and the underlying mechanisms need to be clarified.
The present systematic study aimed to construct a model used to assess the risk of recurrence in ITP patients. Therefore, the applicability of PLR as a marker for relapse risk stratification assessment should be considered. For linear relationship discovery of PLR on ITP relapse, only the completely adjusted model was statistically significant, meaning that use of PLR to assess the risk of ITP recurrence will be affected by other factors, which is not conducive to its clinical application. In contrast, the nonlinear exploration of PLR on ITP showed better clinical utility. In our study, although the adjusted and unadjusted results were slightly different between the HR values and the 95% confidence intervals, both results suggested that higher PLR was statistically associated with a decrease in risk of ITP relapse, indicating that clinicians can directly assess the risk of recurrence of ITP patients based on PLR due to less influence of other covariates. In summary, the elaboration of the association between PLR and ITP recurrence in this study will help to construct a predictive model for ITP recurrence assessments in the future, and will help hematologists to initially assess the risk of recurrence for newly-diagnosed ITP patients who receive first-line treatment.
Our study has some strengths. Firstly, we treated PLR as a continuous variable as well as a categorical variable (quartiles), and tested the P for trend, which is useful in evaluating the robustness of data analysis. Secondly, we built a Cox model to evaluate the linearity and used the generalized additive model (GAM) to explain the nonlinearity. The use of GAM is powerful to detect the real link between PLR and recurrence of newly-identified ITP [29]. Thirdly, this was a historical cohort study, and was thus susceptible to potential confounding. However, we used strict statistical adjustment to minimize the effect of residual confounders. Fourthly, the subgroup and interaction tests improved the use of data and yielded interesting findings. Fifthly, more stringent cohort inclusion and exclusion criteria are useful to eliminate potential confounders at the patient screening stage. Finally, we used 6 months as the follow-up time period and also analyzed ITP recurrence within 12 months. Since only 6 patients relapsed after 180 days, we did not report in the results, but rather added them to supplemental materials (Supplementary Table 1). Sensitivity analysis showed at these 2 timepoints, the HR showed no significant change in magnitude or direction.
There are several limitations to be considered in this study. To best avoid the bias caused by confounders, we included only those patients who had no history of hepatitis B, which limits the generalizability of our results to individuals with hepatitis B infection. We also restricted our study population to pregnant woman, which means that our findings are not necessarily applicable to patients who are not pregnant. Additionally, the non-newly identified ITP was not involved in our cohort; therefore, the effect attributed to undergoing second-line treatment was unknown. Finally, because platelet and lymphocyte counts alone may have predictive value, the comparison of performance among PLR, platelet count, and lymphocyte counts should be performed. However, the main purpose of this study was to investigate the association between PLR and risk of recurrence of ITP. Therefore, a comparison of the predictive value of these 3 ways to predict ITP recurrence risk was not reported in this study, but was shown in a subsequent model-driven study.
Conclusions
The present work non-selectively enrolled 233 patients with newly-identified ITP who received steroid treatment with or without IVIG, showing there is a saturation effect in this correlation between PLR and risk of relapse, as we did not observe a corresponding decrease for the risk of relapse after PLR exceeded 9.7. Our findings suggest that PLR has the potential to be used as a predictive marker for ITP recurrence.
Supplementary Data
Supplementary Table 1.
The results of HR using 6 months and 12 months as endpoints.
| Exposure | Fully adjusted model (HR, 95% CI) 6 month | Fully adjusted model (HR, 95% CI, P) 12 month |
|---|---|---|
| PLR | 0.96 (0.93, 0.99) | 0.93 (0.90, 0.99) |
| PLR (quartile) | ||
| Q1 | Reference | Reference |
| Q2 | 0.51 (0.25, 1.02) | 0.44 (0.23, 0.85) |
| Q3 | 0.39 (0.19, 0.82) | 0.35 (0.17, 0.71) |
| Q4 | 0.39 (0.18, 0.85) | 0.35 (0.17, 0.72) |
| P for trend | 0.02 | 0.006 |
Fully adjusted model: we adjusted for age, sex, weight, height, smoking status, alcoholic consumption, HP infection, diabetes history, hyperuricemia, cardiovascular diseases, mean platelet volume, bleeding in skin, bleeding in mucosa, bleeding in organ, treatment protocol (high-dose dexamethasone, oral prednisone, IVIG), MPD, and duration of prednisone use. HR – hazard ratio; CI – confidence interval.
Acknowledgments
The authors thank Shou-Xin Zhang (a professional editor) for critical revision of the manuscript.
Footnotes
Source of support: This work was supported by grants from the Guizhou Science and Technology Fund Project ([2013] NO 2183)
Conflict of interest
None.
References
- 1.Li J, Ma S, Shao L, et al. Inflammation-related gene polymorphisms associated with primary immune thrombocytopenia. Front Immunol. 2017;8:744. doi: 10.3389/fimmu.2017.00744. [DOI] [PMC free article] [PubMed] [Google Scholar]
- 2.Thrombosis and Hemostasis Group, Hematology Society, Chinese Medical Association. [Consensus of Chinese experts on diagnosis and treatment of adult primary immune thrombocytopenia (version 2016)]. Zhonghua Xue Ye Xue Za Zhi. 2016;37(2):89–93. doi: 10.3760/cma.j.issn.0253-2727.2016.02.001. [in Chinese] [DOI] [PMC free article] [PubMed] [Google Scholar]
- 3.Zhou H, Xu M, Qin P, et al. A multicenter randomized open-label study of rituximab plus rhTPO vs. rituximab in corticosteroid-resistant or relapsed ITP. Blood. 2015;125(10):1541–47. doi: 10.1182/blood-2014-06-581868. [DOI] [PMC free article] [PubMed] [Google Scholar]
- 4.Su L, Zhang M, Zhang W, et al. Pretreatment hematologic markers as prognostic factors in patients with nasopharyngeal carcinoma: A systematic review and meta-analysis. Medicine (Baltimore) 2017;96(11):e6364. doi: 10.1097/MD.0000000000006364. [DOI] [PMC free article] [PubMed] [Google Scholar]
- 5.Song W, Tian C, Wang K, et al. Preoperative platelet lymphocyte ratio as independent predictors of prognosis in pancreatic cancer: A systematic review and meta-analysis. PLoS One. 2017;12(6):e178762. doi: 10.1371/journal.pone.0178762. [DOI] [PMC free article] [PubMed] [Google Scholar]
- 6.Li B, Zhou P, Liu Y, et al. Platelet-to-lymphocyte ratio in advanced cancer: Review and meta-analysis. Clin Chim Acta. 2018;483:48–56. doi: 10.1016/j.cca.2018.04.023. [DOI] [PubMed] [Google Scholar]
- 7.Zhao Z, Zhao X, Lu J, et al. Prognostic roles of neutrophil-to-lymphocyte ratio and platelet-to-lymphocyte ratio in ovarian cancer: A meta-analysis of retrospective studies. Arch Gynecol Obstet. 2018;297(4):849–57. doi: 10.1007/s00404-018-4678-8. [DOI] [PubMed] [Google Scholar]
- 8.Cao Z, Li Z, Xiang H, et al. Prognostic role of haematological indices in sudden sensorineural hearing loss: Review and meta-analysis. Clin Chim Acta. 2018;483:104–11. doi: 10.1016/j.cca.2018.04.025. [DOI] [PubMed] [Google Scholar]
- 9.Mazza MG, Lucchi S, Tringali A, et al. Neutrophil/lymphocyte ratio and platelet/lymphocyte ratio in mood disorders: A meta-analysis. Prog Neuropsychopharmacol Biol Psychiatry. 2018;84(Pt A):229–36. doi: 10.1016/j.pnpbp.2018.03.012. [DOI] [PubMed] [Google Scholar]
- 10.Balta S, Ozturk C. The platelet-lymphocyte ratio: A simple, inexpensive and rapid prognostic marker for cardiovascular events. Platelets. 2015;26(7):680–81. doi: 10.3109/09537104.2014.979340. [DOI] [PubMed] [Google Scholar]
- 11.Moulis G, Germain J, Comont T, et al. Newly diagnosed immune thrombocytopenia adults: Clinical epidemiology, exposure to treatments, and evolution. Results of the CARMEN multicenter prospective cohort. Am J Hematol. 2017;92(6):493–500. doi: 10.1002/ajh.24702. [DOI] [PubMed] [Google Scholar]
- 12.Akbayram S, Karaman K, Dogan M, et al. Initial lymphocyte count as prognostic indicator for childhood immune thrombocytopenia. Indian J Hematol Blood Transfus. 2017;33(1):93–96. doi: 10.1007/s12288-016-0664-0. [DOI] [PMC free article] [PubMed] [Google Scholar]
- 13.Bahoush G, Motamedi D, Vossough P. Initial lymphocyte count in patients with acute immune thrombocytopenic purpura: Can it predict persistence of the disease? Minerva Pediatr. 2014 [Epub ahead of print] [PubMed] [Google Scholar]
- 14.Thrombosis and Hemostasis group, Hematology Society, Chinese Medical Association. [Consensus of Chinese experts on diagnosis and treatment of adult primary immune thrombocytopenia (version 2012)]. Zhonghua Xue Ye Xue Za Zhi. 2012;33(11):975–77. [in Chinese] [PubMed] [Google Scholar]
- 15.Ahn YS. Triple play of H pylori in ITP. Blood. 2010;115(21):4155–56. doi: 10.1182/blood-2010-02-269720. [DOI] [PubMed] [Google Scholar]
- 16.Hudzik B, Szkodzinski J, Gorol J, et al. Platelet-to-lymphocyte ratio is a marker of poor prognosis in patients with diabetes mellitus and ST-elevation myocardial infarction. Biomark Med. 2015;9(3):199–207. doi: 10.2217/bmm.14.100. [DOI] [PubMed] [Google Scholar]
- 17.Solari D, Rossetti AO, Carteron L, et al. Early prediction of coma recovery after cardiac arrest with blinded pupillometry. Ann Neurol. 2017;81(6):804–10. doi: 10.1002/ana.24943. [DOI] [PubMed] [Google Scholar]
- 18.Li H, Zhou Y, Ma Y, et al. The prognostic value of the platelet-to-lymphocyte ratio in acute coronary syndrome: A systematic review and meta-analysis. Kardiol Pol. 2017;75(7):666–73. doi: 10.5603/KP.a2017.0068. [DOI] [PubMed] [Google Scholar]
- 19.Li W, Liu Q, Tang Y. Platelet to lymphocyte ratio in the prediction of adverse outcomes after acute coronary syndrome: A meta-analysis. Sci Rep. 2017;7:40426. doi: 10.1038/srep40426. [DOI] [PMC free article] [PubMed] [Google Scholar]
- 20.Chen C, Song J, Wang Q, et al. Mean platelet volume at baseline and immune thrombocytopenia relapse in Chinese newly-diagnosed patients: A retrospective cohort study. Hematology. 2018;23(9):646–52. doi: 10.1080/10245332.2018.1461317. [DOI] [PubMed] [Google Scholar]
- 21.Vandenbroucke JP, von Elm E, Altman DG, et al. Strengthening the Reporting of Observational Studies in Epidemiology (STROBE): Explanation and elaboration. PLoS Med. 2007;4(10):e297. doi: 10.1371/journal.pmed.0040297. [DOI] [PMC free article] [PubMed] [Google Scholar]
- 22.Liu S, Wang X, Lu Y, et al. The effects of intraoperative cryoprecipitate transfusion on acute renal failure following orthotropic liver transplantation. Hepatol Int. 2013;7(3):901–9. doi: 10.1007/s12072-013-9457-9. [DOI] [PMC free article] [PubMed] [Google Scholar]
- 23.Jung JY, OAR, Kim JK, Park M. Clinical course and prognostic factors of childhood immune thrombocytopenia: Single center experience of 10 years. Korean J Pediatr. 2016;59(8):335–40. doi: 10.3345/kjp.2016.59.8.335. [DOI] [PMC free article] [PubMed] [Google Scholar]
- 24.Ahmed I, Rajpurkar M, Thomas R, et al. Initial lymphocyte count and the development of persistent/chronic immune thrombocytopenic purpura. Pediatr Blood Cancer. 2010;55(3):508–11. doi: 10.1002/pbc.22570. [DOI] [PubMed] [Google Scholar]
- 25.Akbayram S, Karaman K, Dogan M, et al. Initial lymphocyte count as prognostic indicator for childhood immune thrombocytopenia. Indian J Hematol Blood Transfus. 2017;33(1):93–96. doi: 10.1007/s12288-016-0664-0. [DOI] [PMC free article] [PubMed] [Google Scholar]
- 26.Grimaldi-Bensouda L, Nordon C, Michel M, et al. Immune thrombocytopenia in adults: A prospective cohort study of clinical features and predictors of outcome. Haematologica. 2016;101(9):1039–45. doi: 10.3324/haematol.2016.146373. [DOI] [PMC free article] [PubMed] [Google Scholar]
- 27.Tsuda H, Tsuji T, Tsuji M, et al. Life-threatening bleeding episodes in primary immune thrombocytopenia: A single-center retrospective study of 169 inpatients. Ann Hematol. 2017;96(11):1915–20. doi: 10.1007/s00277-017-3095-6. [DOI] [PubMed] [Google Scholar]
- 28.von Laer TL, Schwitzgebel VM, von Scheven-Gete A, et al. Diabetes and immune thrombocytopenic purpura: A new association with good response to anti-CD20 therapy. Pediatr Diabetes. 2015;16(2):138–45. doi: 10.1111/pedi.12128. [DOI] [PubMed] [Google Scholar]
- 29.Forest S. Nonlinear regularization operators as derived from the micromorphic approach to gradient elasticity, viscoplasticity and damage. Proc Math Phys Eng Sci. 2016;472(2188):20150755. doi: 10.1098/rspa.2015.0755. [DOI] [PMC free article] [PubMed] [Google Scholar]
Associated Data
This section collects any data citations, data availability statements, or supplementary materials included in this article.
Supplementary Materials
Supplementary Table 1.
The results of HR using 6 months and 12 months as endpoints.
| Exposure | Fully adjusted model (HR, 95% CI) 6 month | Fully adjusted model (HR, 95% CI, P) 12 month |
|---|---|---|
| PLR | 0.96 (0.93, 0.99) | 0.93 (0.90, 0.99) |
| PLR (quartile) | ||
| Q1 | Reference | Reference |
| Q2 | 0.51 (0.25, 1.02) | 0.44 (0.23, 0.85) |
| Q3 | 0.39 (0.19, 0.82) | 0.35 (0.17, 0.71) |
| Q4 | 0.39 (0.18, 0.85) | 0.35 (0.17, 0.72) |
| P for trend | 0.02 | 0.006 |
Fully adjusted model: we adjusted for age, sex, weight, height, smoking status, alcoholic consumption, HP infection, diabetes history, hyperuricemia, cardiovascular diseases, mean platelet volume, bleeding in skin, bleeding in mucosa, bleeding in organ, treatment protocol (high-dose dexamethasone, oral prednisone, IVIG), MPD, and duration of prednisone use. HR – hazard ratio; CI – confidence interval.