Abstract
Arterial spin labeling (ASL) MRI, based on endogenous contrast from blood water, is used in research and diagnosis of cerebral vascular conditions. However, artifacts due to imperfect imaging conditions such as B0-inhomogeneity (ΔB0) could lead to variations in the quantification of relative cerebral blood flow (CBF). In this study, we evaluate a new approach using tagging distance dependent Z-spectrum (TADDZ) data, similar to the ΔB0 corrections in the chemical exchange saturation transfer (CEST) experiments, to remove the imaging plane B0 inhomogeneity induced CBF artifacts in ASL MRI. Our results indicate that imaging-plane B0-inhomogeneity can lead to variations and errors in the relative CBF maps especially under small tagging distances. Along with an acquired B0 map, TADDZ data helps to eliminate B0-inhomogeneity induced artifacts in the resulting relative CBF maps. We demonstrated the effective use of TADDZ data to reduce variation while subjected to systematic changes in ΔB0. In addition, TADDZ corrected ASL MRI, with improved consistency, was shown to outperform conventional ASL MRI by differentiating the subtle CBF difference in Alzheimer's disease (AD) mice brains with different APOE genotypes.
Keywords: Arterial spin labeling (ASL), Cerebral blood flow (CBF), B0 inhomogeneity, Z-spectrum, Alzheimer's disease (AD)
1. Introduction
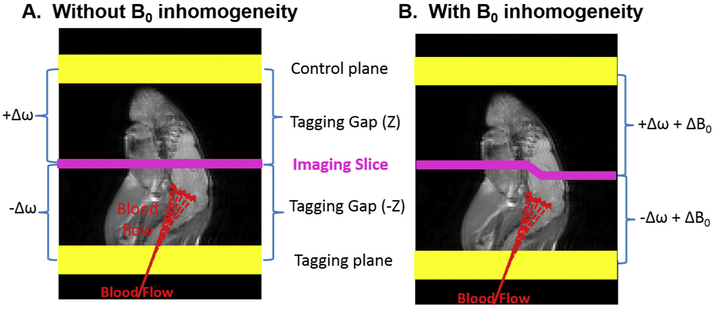
Perfusion, the delivery of oxygen and nutrient rich blood to tissue, is crucial to the health and wellbeing of tissue especially in the brain. Noninvasive perfusion imaging is crucial to research and diagnosis of cerebral vascular conditions, such as stroke, brain cancer, neurodegenerative diseases, and other neurological disorders. Hence, perfusion MRI for the quantification of cerebral blood flow (CBF) maps based on endogenous arterial spin labeling (ASL) contrast has gained popularity in research and clinics [1-3]. ASL contrast relies on the signal difference between images with and without the signal from the blood water inverted or saturated (inverted/saturated). The image with the blood water inverted/saturated, called the tag image, is acquired after inverting/saturating the blood water spins in the arteries prior to entering the imaging plane. A complicating factor is that the RF pulse used for inverting/saturating the blood water spins also reduces the signal from the imaging slice due to direct saturation (DS) and magnetization transfer (MT) effects [4]. A control image is acquired by tagging a plane located with equal distance but distal to the imaging slice in order to compensate the DS and MT effects [4] (Fig. 1A). When the static magnetic field (B0) within the imaging plane is homogeneous, conventional ASL MRI for CBF mapping works as expected.
Fig. 1.
The concept of conventional ASL. A) Conventional ASL contrast relies on the signal difference between images with and without the signal from the blood water inverted/saturated. The image with the blood water inverted/saturated, called the tag image, is acquired after inverting/saturating the blood water spins in the arteries prior to entering the imaging plane. Typically, a control image is acquired by tagging a plane located with equal distance but opposite direction from the imaging slice. The conventional ASL MRI works only when there is no static magnetic field (B0) inhomogeneity. B) Under B0 inhomogeneity, tagging offset frequencies of the control plane is not equivalent to that of the tagging plane, leading to B0-inhomogeneity induced artifacts in the resulting CBF maps.
However, given susceptibility effects, especially in murine brains, at ultra high B0, where the field is typically inhomogeneous (up to 0.5 ppm) within the imaging plane, the DS and MT effects vary disproportionately between the tag and control images (Fig. 1B), creating regional artifacts in the resulting CBF maps. The regional artifacts could diminish the quantification accuracy, potentially leading to wrong diagnosis in clinics. Hence, it is necessary to evaluate imaging plane B0-inhomeogeneity induced artifacts in ASL MRI.
Similarly, in chemical exchange saturation transfer (CEST) MRI, contrast is highly dependent on homogeneity of the in-plane B0 field. CEST molecular imaging of a particular metabolite relies on the difference between the signals with saturation at the exchangeable protons' resonance frequency (i.e., +3.5 ppm for APT [5]) and the control frequency offset on the opposite side of Z spectrum (i.e., −3.5 ppm for APT [5]). In CEST MRI, by acquiring extra data points around the desired frequency offset, B0-correction is done through a linear interpolation of the regional data to calculate the signal at the correct frequency offset according to B0 field variation, producing B0-corrected CEST contrast maps [6,7-9].
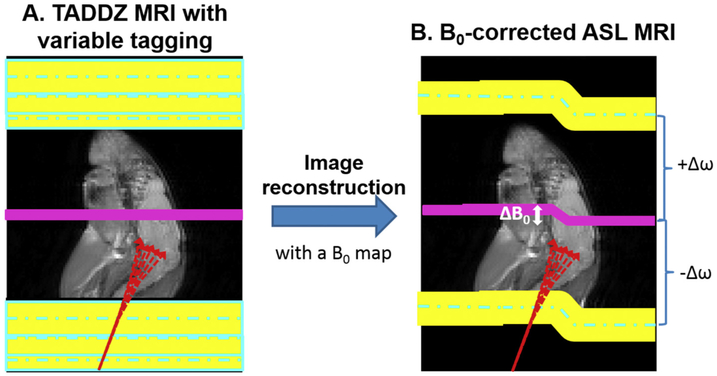
CEST and ASL MRI are similar pulse sequences. In a typical CEST MRI sequence, a frequency selective saturation pulse is played out globally (with no gradient) before signal acquisition. On the other hand, in ASL an inversion or saturation pulse is played out concurrent with an ASL gradient (Gasl), before signal acquisition (Figs. 1-2). With the aid of this gradient and a frequency selective saturation pulse, spatially selective tagging with a desired tagging distance is achieved. By varying the tagging distance, a tagging distance dependent Z-spectrum (TADDZ) can be produced with ASL MRI (Fig. 2-3) similarly to the CEST Z-spectrum.
Fig. 2.
TADDZ corrected ASL MRI corrects B0 inhomogeneity induced artifacts. In TADDZ B0-correction, the tagging distance from the imaging slice or the tagging frequency offset is varied, producing tagging-distance or frequency dependent Z-spectral image dataset (A). Along with a B0 map, TADDZ spectrum can be utilized to eliminate B0-inhomogeneity induced artifacts in the resulting CBF maps (B).
Fig. 3.
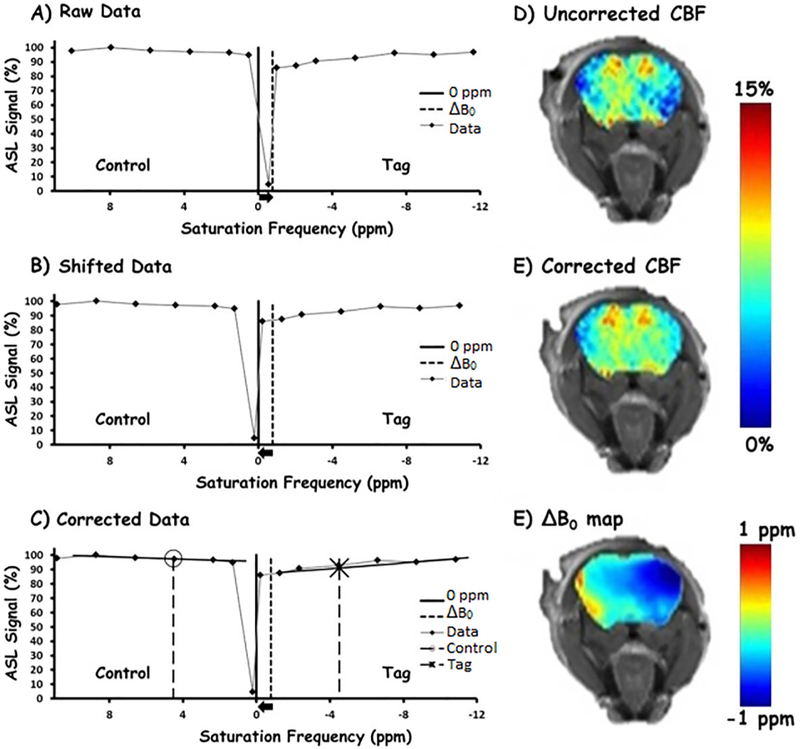
Representative TADDZ signals (A) from a pixel plotted against tagging distances (converted to ppm). A −0.8 ppm B0 inhomogeneity is observed from this pixel. Image reconstruction to obtain B0-corrected signals by unshifting according to the B0 inhomogeneity (B) then interpolating signals at intended tagging distance (C). The O and X markers are the signal that was intended to be acquired. The corrected values are determined using linear interpolation (solid black lines) and interpolation. Sample rCBF maps before correction (D) after correction (E) and the corresponding ΔB0 map (F).
Using this same concept from CEST MRI, we hypothesize that ASL MRI can be corrected for in-plane B0-inhomogeneity induced artifacts with TADDZ spectral data and a B0 map (Fig. 2A, B). In this study, we will evaluate the B0-induced artifacts in ASL imaging and validate our hypothesis of B0-corrected ASL with TADDZ spectrum data.
To test our novel technique, we measured CBF in Alzheimer's disease (AD) mice that express either APOE3 or APOE4 gene (EFAD mice) [11]. APOE4 is the greatest genetic risk factor for sporadic AD, increasing risk up to 15-fold compared to APOE3 (reviewed in [12]). Although the role of APOE in AD is complex, data support that APOE4 induces cerebrovascular dysfunction in AD patients, including reduced cerebral blood flow [12]. We investigated if B0-corrected ASL with TADDZ spectrum improves the detection of the CBF reduction due to APOE4 in AD.
2. Materials and methods
2.1. MRI acquisition
MRI was performed by acquiring a series of spin echo based Signal Targeting with Alternating Radio frequency (STAR) [13] datasets from a central slice of mouse brain on a 9.4 T small-animal scanner with tagging gap values of 0, 2.5, 5, 10, 15, 20, and 25 mm.
Given a slice thickness (Sthk) of 1 mm and a ASL tagging gradient (Gasl) of 0.4 gauss/cm these tagging gaps can be converted into off resonances (Δω) according to the following Eq. (1), resulting in off-resonances of ± 0.2, ± 1.3, ± 2.3, ± 4.5, ± 6.6, ± 8.7, and ± 10.8 ppm from the center of the slice, where the sign reflects the up-field/down-field nature of the control and tag saturation, respectively. The signal at those different off resonances forms a TADDZ spectrum.
| (1) |
where tagging distance is the sum of the tagging gap and half of the slice thickness, γ is the gyromagnetic ratio.
Tagging RF pulse being used is a standard hyperbolic secant (HS) adiabatic full passage (AFP) pulse with 4 μT amplitude and 10 ms duration. Other imaging parameters include TR/TE = 2000/9.6 ms, post labeling delay = 500 ms, field of view = 25 × 25 mm2, matrix size = 64 × 64, and number of average = 1. The acquisition time for a full single-slice TADDZ spectrum is about 4.2 min.
Field inhomogeneity, or ΔB0 map, was determined using water saturation shift referencing (WASSR) [10] images (from −1 ppm to +1 ppm with increment of 0.1 ppm) collected with a 100 ms saturation pulse of 0.47 μT using a single-shot Fast Low Angle Shot (FLASH) sequence [6,7-9]. The acquisition time for WASSR is about 2 min.
2.2. Image processing
Relative CBF (rCBF) was computed before and after B0 correction according to the following equation,
| (2) |
where Sctr and Stag are the signals with the intended tagging distance of 10 mm distal and proximal to the imaging slice, respectively.
B0 correction was performed pixel wise by shifting the acquired TADDZ spectrum data according to ΔB0 (Fig. 3A, B) using a Thiel-Sen linear interpolation [14] in the range ± 2 to ± 11 ppm to produce signals at the intended tagging distances of ± 10 mm ( ± 4.5 ppm), for control and tag respectively (Fig. 3C).
2.3. Animal studies
All experiments follow the UIC Institutional Animal Care and Use Committee protocols. We performed a study using healthy CD-1 mice (6–8 weeks old, n = 3) in which the original ΔB0 field was systematically changed by adding progressively increased B0 offsets (0.25, 0.5, and 1 ppm) in order to compare rCBF maps of a central brain slice before and after B0-correction with TADDZ. In a separate study, we scanned mice (6–8 weeks old, n = 3) after very fine shimming only over the imaging slice to test if rCBF maps before and after B0-correction are matched under good shimming. In addition, we performed scans right after euthanizing the mice (with cervical dislocation, n = 3) to check if there is any remaining signal in ‘rCBF’ maps when mice are dead.
Finally, we have performed a systematical study to demonstrate the benefit of B0-correction with TADZZ. To assess the CBF differences between the two phenotypically different groups of mice, conventional ASL and TADDZ spectral data were collected from male APOE3 (n = 5, 8 months) and APOE4 (n = 7, 8 months) AD mice and uncorrected and corrected rCBF values were compared to reveal APOE phenotype induced CBF changes in the brain. Breeding and colony maintenance was conducted as described in refs. [11,15]. In this study only male EFAD mice were utilized for the purpose of consistency, as apoE isoform-specific interaction with Aβ are known to be influenced by gender [16]. Regions of interest (ROIs) in hippocampus and whole brain were manually drawn with reference to anatomic images.
2.4. Statistical analysis
In the MRI study of AD mice, unpaired two-tailed Student’s t-test was used to compare the rCBF values from APOE3 and APOE4 mice. The difference was considered to be significant if p < 0.05. Values are reported as Mean ± Standard Deviation (SD).
3. Results
TADDZ spectrum reflects the water signal from the imaging plane under different tagging distances (or frequency offset) as demonstrated in Fig. 3A. TADDZ signal can be affected by a few mechanisms, including direct saturation (or tagging), semi-solid magnetization transfer, and blood flow effects. Under homogeneous B0 conditions, when the tagging gap was < 0 mm, the tagging region overlaps with the imaging plane and the ASL tagging pulse directly interacts with the protons of the imaging slice, resulting in minimal signal, e.g., a sharp dip in the TADDZ spectrum mainly due to the direct saturation effect. Away from the dip in the TADDZ spectrum, the ASL tagging region moves away from the imaging slice. Accordingly, the signal increases due to reduced direct saturation and magnetization transfer effects. However, besides the influence from direct saturation and magnetization transfer effects, ASL contrast from blood flow also contributes to the signal reduction in the proximal or down-field TADDZ spectrum. It is the difference between the up-field and down-field TADDZ spectral signals that provides the ASL contrast that reflects brain CBF, assuming a homogenous imaging plane B0 field, or ΔB0 = 0.
Under homogenous B0 field, the nadir of TADDZ spectrum points to the experimental frequency offset at 0 ppm (tagging distance of < 0 mm). However, when ΔB0 is not 0 ppm, the entire TADDZ spectrum shifts proportionally to ΔB0 as demonstrated in Fig. 3A. Without B0 correction, the conventional ASL contrast computation was contaminated by the asymmetric DS and MT effects. For each voxel, by shifting back the entire TADDZ spectrum with respect to ΔB0 (Fig. 3B) and using linear interpolation of regional data (Fig. 3C), the B0-corrected ASL contrast can be rendered at the intended tagging distance (or frequency offset). As demonstrated in Fig. 3D-F, the conventional rCBF (Fig. 3D) is highly affected by ΔB0 (Fig. 3F) while such influence is minimized in the B0-corrected rCBF map (Fig. 3E).
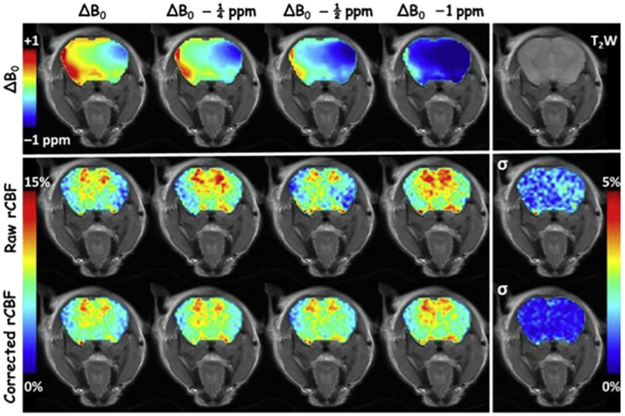
The study in which the original ΔB0 field was systematically changed by adding progressively increased B0 offsets (Fig. 4 top row), TADDZ datasets were collected, and uncorrected rCBF maps (Fig. 4 middle row) and ΔB0 corrected rCBF maps (Fig. 4 bottom row) were produced. Voxel-wise standard deviation (σ) maps of the uncorrected and corrected rCBF maps were presented in the right most column of their respective rows in Fig. 4. Whereas the uncorrected rCBF maps exhibited noticeable variations due to systematic variation of ΔB0, the ΔB0 correction greatly reduced such variation by a factor of 3 as demonstrated in the σ maps.
Fig. 4.
Demonstration of TADDZ corrected ASL MRI that corrects B0 inhomogeneity induced artifacts. Top row shows the ΔB0 maps. Middle row shows the uncorrected CBF maps produced from conventional ASL MRI, whereas the bottom row shows the B0-corrected CBF maps from TADDZ MRI. The columns, from left, depict the experiments by manually shifting ΔB0 by 0, 0.25, 0.5, and 1 ppm, respectively. The last column depicts the voxel-wise standard deviation (σ) of the CBF maps within their row. The upper right image is a T2-weighed (T2W) image showing the brain anatomy.
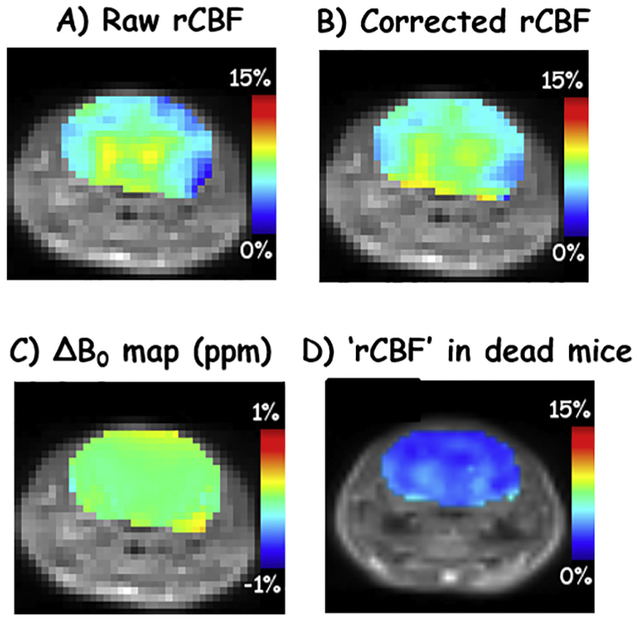
With dedicated shimming over the imaging slice, the raw rCBF map (Fig. 5A, 6.35 ± 1.59% within the brain) appears to be very close to the corrected rCBF (Fig. 5B, 6.65 ± 1.34%) with a very homogenous ΔB0 map (Fig. 5C, 0.013 ± 0.066 ppm), indicating that B0-corrected rCBF maps are accurate. In Figs. 3-5, rCBF are higher in the hippocampus and thalamus regions than the rest of brain. Fig. 5D shows a representative ‘rCBF’ map from dead mice. The signal, 3.11 ± 0.66% within the brain, was greatly dampened across the whole brain.
Fig. 5.
Raw and B0-corrected rCBF maps (A, B) with ΔB0 map (C) after fine shimming over only the imaging slice. A representative ‘rCBF’ map after mice were euthanized is shown in D.
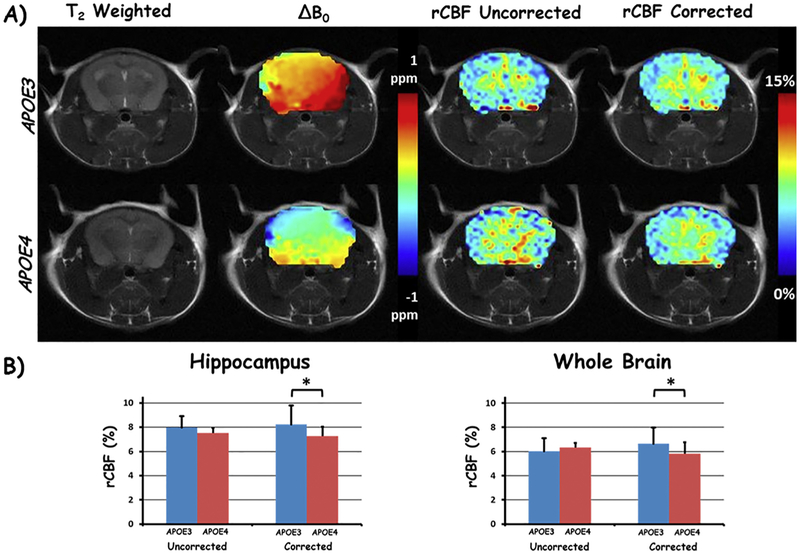
In a pre-clinical translational study, APOE dependent AD mice (5xFAD with APOE3 or APOE4 genotype) were scanned using MRI. Representative rCBF maps before and after B0-correction are shown in Fig. 6A. The difference between the uncorrected rCBF was not significantly different between the APOE3 vs APOE4 within the hippocampus (8.0 ± 0.9% vs 7.5 ± 1.6%, p = 0.31) and whole brain (6.0 ± 1.0% vs 6.3 ± 1.3%, p = 0.35). However, the correction with TADDZ technique improved the differentiation power by showing significantly higher rCBF in the APOE3 vs APOE4 within both the hippocampus (8.2 ± 0.4% vs 7.2 ± 0.8%, p < 0.05) and the whole brain (6.7 ± 0.4% vs 5.8 ± 0.9%, p < 0.05) (Fig. 6B).
Fig. 6.
TADDZ correction produced B0-corrected CBF maps can differentiate the subtle CBF difference between APOE3 and APOE4 genotyped Alzheimer's disease. A) Representative brain images from an APOE3, top row, and an APOE4, bottom row, mouse. Columns from left to right are T2 weighted image, ΔB0, uncorrected (from conventional ASL MRI), and corrected rCBF maps with TADDZ, respectively. B) Bar chart depiction of the rCBF differences between APOE3 and APOE4 mice, uncorrected (conventional ASL MRI, left) and corrected (TADDZ MRI, right) within the hippocampus (left chart) and whole brain (right chart). *p < 0.05.
4. Discussion
Susceptibility variations between the head, neck, and body, make obtaining a homogeneous B0 field in both the imaging and tagging regions challenging, especially at ultra-high magnetic fields. In this study, we investigated imaging plane B0-inhomogeneity induced artifacts in ASL MRI and the B0-correction using TADDZ spectral data. Our results indicate that image-plane B0-inhomogeneity could lead to considerable variations in CBF maps. Along with a B0 map, TADDZ spectrum can be utilized to reduce these B0-inhomogeneity induced artifacts in the resulting CBF maps. We demonstrated the effective use of TADDZ correction to reduce test-retest variations. Initial applications were attempted with AD mouse models and promising outcomes were shown. As we demonstrated, TADDZ based B0-correction improved consistency and differentiated the subtle CBF difference in AD mice with different APOE genotypes. Such differentiation was not achieved using conventional ASL MRI.
Literature search shows that Pekar et al. had previously addressed the intrinsic asymmetric MT effects in ASL imaging [17]. In another related study, Janahian et al. investigated the tagging region's B0-inhomogeneity effect on tagging efficiency [18]. In contrast, for the first time, our study herein emphasizes the correction of ASL artifacts due to imaging-plane B0-inhomogeneity.
B0-correction with TADDZ herein is achieved by varying frequency offset. Tagging distance can also be changed by varying ASL gradient amplitude (Eq. (1)). Variation in tagging frequency offset (Δω) or gradient amplitude (Gasl) both lead to varied tagging distance so that a Z-spectrum can be formed and used for B0-correction with the aid of a B0 map. Currently, we collect large range data covering tagging distance from 0 to 25 mm mainly for the demonstration of the concept by presenting the whole spectrum. Although a wide range data is collected, only a small range of data accounting for the actual B0 variation is effective. Linear interpretation can still be performed with small range of data for correcting pixel-wise B0 heterogeneity. For instance, correction for B0 variation for up to 0.5 ppm only utilizes data within 1.2 mm range from the desired tagging position under the current settings (gradient = 0.4 gauss/cm, 9.4 T). Within the small offset from the desired tagging distance, the differences in the labeling efficiency (vessel orientation), RF fields, and transit time from label plane to imaging slice should be negligible.
It is interesting to note that B0 maps may be produced directly from the TADDZ spectrum itself as the nadir of TADDZ locates water resonance and hence the ΔB0. However, for this purpose, more data around the dip may need to be acquired for the precise determination of B0 offset. This concept is the same as B0-mapping based on WASSR [10], where Z-spectrum acquired with low saturation power and short duration were used to produce B0 maps.
TADDZ spectrum is affected by a few mechanisms, including direct saturation (or tagging), semi-solid magnetization transfer, and blood flow effects. Up-field Nuclear Overhauser Enhancement (NOE) and down-field CEST effects may also contribute to the signal [8]. However, the NOE or CEST effects' contribution is only appreciable under a strong and prolonged (up to seconds) tagging or saturation pulse. In this study, we expect such contributions are negligible because the tagging pulse (10 ms) is very short in duration. A typical CEST/NOE experiment utilizes saturation pulses in seconds long. In addition, TADDZ cannot correct the intrinsic MT asymmetric effect in the current form. TADDZ method may be improved to correct for intrinsic MT asymmetry by fitting and removing MT spectrum from the TADDZ spectrum similarly to previous CEST studies [19].
With good shimming over the imaging slice, rCBF maps are matched before and after B0-correction with TADDZ, indicating that B0-corrected CBF maps are accurate in this study. Hippocampus and thalamus showed higher CBF than other parts of the brain, confirming these key brain regions are more perfused than other regions. Such spatial distribution has been confirmed by previous publications [20,21]. When animals were dead, ‘rCBF’ signal was greatly dampened across the whole brain. The remaining signal may due to intrinsic MTR asymmetry or other unknown factors.
TADDZ corrected ASL MRI was performed to study CBF differences in mice with AD that express APOE3 or APOE4 genotype. It is reported that sporadic AD accounts for > 95% of all cases and APOE4 is the greatest genetic risk factor, increasing risk up to 15-fold compared to APOE3 [22-24] and affecting the age of AD onset [25,26]. CBF changes may serve as an imaging biomarker for metabolic changes due to APOE4. B0-corrected ASL MRI with imaging plane B0-corrected rCBF improved the consistency, enhancing the statistical power to differentiate APOE phenotype dependent brain perfusion. APOE4 mice were found to have reduced CBF compared to APOE3 mice, consistent to literatures [27]. Compared to APOE3 mice, in male APOE4 mice there is evidence of higher cerebrovascular leakiness which indicates capillary breakdown, and the deposition of Aβ in larger vessels (likely arterioles) as cerebral amyloid angiopathy (CAA) [28]. Thus, both capillary and arteriole dysfunction may underlie the observed reduced CBF in male E4FAD mice.
There are a few limitations of this study. Firstly, in this study, we investigated the CBF variation due to B0 inhomogeneity using STAR based ASL MRI as an example. Although we believe, this concept should be translational to other ASL technique, such as continuous ASL (CASL), pseudo continuous ASL (pCASL), etc., the actual experiments remain to be done. In addition, B0-correction with TADDZ should be applicable to any magnetic field strengths and any other organs besides brain.
Secondly, we only computed the relative CBF maps instead of the quantitative absolute CBF maps. Producing quantitative absolute CBF maps requires a few more parameters (T1 values of blood and tissues, and the tagging efficiency) to be determined [29]. This remains to be performed in the future. This study has the focus on the proof of concept for B0-corrected rCBF using a representative ASL sequence.
Thirdly, TADDZ correction requires the acquisition of more data points with which a linear interpolation is performed. This may prolong the acquisition time compared to conventional ASL imaging. However, in conventional ASL imaging, a number of averages or repeats are typically necessary given that ASL contrast is small (only a few percent or less). The number of averages or repeats may be reduced given that a interpolation algorithm is used in TADDZ based B0-correction with linear fitting, i.e., Theil-Sen [14], that is resilient to noise or outliers. The current acquisition time for TADDZ is < 5 min which is applicable for clinical applications. The acquisition time can be further reduced by acquiring only the data points with tagging frequency offsets that cover ΔB0 variations. The minimal data points to be acquired is two points on each side of TADDZ spectrum (4 data points in total) to allow a linear interpolation. That takes only ~1 min to acquire.
Lastly, linear interpolation of TADDZ data points may not be the optimum but the simplest. Complicated fitting of Z-spectrum using Lorentzian [8,30], super-Lorentzian [31,32], or multi-component (DS, MT, and ASL) fittings [8] may be alternatively used.
In summary, by removing the artifacts due to static B0 field inhomogeneity, TADDZ enhances the robustness of CBF quantification, improves statistical power, and may eventually improve clinical diagnosis.
Acknowledgement
Our sincere thanks are also due to Jing Gao at UIC small animal imaging facility for her technical supports. This work was supported by NIH grants R21EB023516 (Cai), R01AG061114 (Tai), R21AG053876 (Tai), R21AG061715 (Tai) and the University of Illinois at Chicago institutional start-up funds.
Footnotes
The authors disclose no potential conflicts of interest.
References
- [1].Grade M, Hernandez Tamames JA, Pizzini FB, Achten E, Golay X, Smits M. A neuroradiologist’s guide to arterial spin labeling MRI in clinical practice. Neuroradiology 2015;57(12):1181–202. 10.1007/s00234-015-1571-z. [DOI] [PMC free article] [PubMed] [Google Scholar]
- [2].Haller S, Zaharchuk G, Thomas DL, Lovblad K-O, Barkhof F, Golay X. Arterial spin labeling perfusion of the brain: emerging clinical applications. Radiology 2016;281(2):337–56. 10.1148/radiol.2016150789. [DOI] [PubMed] [Google Scholar]
- [3].Telischak NA, Detre JA, Zaharchuk G. Arterial spin labeling MRI: clinical applications in the brain. J Magn Reson Imaging 2015;41(5):1165–80. 10.1002/jmri.24751. [DOI] [PubMed] [Google Scholar]
- [4].Calamante F, Thomas DL, Pell GS, Wiersma J, Turner R. Measuring cerebral blood flow using magnetic resonance imaging techniques. J Cereb Blood Flow Metab 1999;19(7):701–35. [DOI] [PubMed] [Google Scholar]
- [5].Zhou JY, Tryggestad E, Wen ZB, Lal B, Zhou TT, Grossman R, et al. Differentiation between glioma and radiation necrosis using molecular magnetic resonance imaging of endogenous proteins and peptides. Nat Med 2011;17(1):130–308. [PubMed PMID: ISI:000285994000046]. [DOI] [PMC free article] [PubMed] [Google Scholar]
- [6].Cai K, Haris M, Singh A, Kogan F, Greenberg JH, Hariharan H, et al. Magnetic resonance imaging of glutamate. Nat Med 2012;18(2):302–6. 10.1038/nm.2615. [PubMed PMID: 22270722; PMCID: 3274604]. [DOI] [PMC free article] [PubMed] [Google Scholar]
- [7].Singh A, Haris M, Cai K, Kassey VB, Kogan F, Reddy D, et al. Chemical exchange saturation transfer magnetic resonance imaging of human knee cartilage at 3 T and 7 T. Magn Reson Med 2012;68(2):588–94. [PubMed PMID: Medline:22213239]. [DOI] [PMC free article] [PubMed] [Google Scholar]
- [8].Cai K, Singh A, Poptani H, Li W, Yang S, Lu Y, et al. CEST signal at 2ppm (CEST@2ppm) from Z-spectral fitting correlates with creatine distribution in brain tumor. NMR Biomed 2015;28(1):1–8. [PubMed PMID: Medline:25295758]. [DOI] [PMC free article] [PubMed] [Google Scholar]
- [9].Cai K, Xu HN, Singh A, Moon L, Haris M, Reddy R, et al. Breast cancer redox heterogeneity detectable with chemical exchange saturation transfer (CEST) MRI. Mol Imaging Biol 2014;16(5):670–9. [PubMed PMID: Medline:24811957]. [DOI] [PMC free article] [PubMed] [Google Scholar]
- [10].Kim M, Gillen J, Landman BA, Zhou J, van Zijl PCM. Water saturation shift referencing (WASSR) for chemical exchange saturation transfer (CEST) experiments. Magn Reson Med 2009;61(6):1441–50. [PubMed PMID: Medline:19358232]. [DOI] [PMC free article] [PubMed] [Google Scholar]
- [11].Youmans KL, Tai LM, Nwabuisi-Heath E, Jungbauer L, Kanekiyo T, Gan M, et al. APOE4-specific changes in abeta accumulation in a new transgenic mouse model of Alzheimer disease. J Biol Chem 2012;287(50):41774–86. Epub 2012/10/13 10.1074/jbc.M112.407957. [PubMed PMID: 23060451; PMCID: 3516726]. [DOI] [PMC free article] [PubMed] [Google Scholar]
- [12].Liu CC, Kanekiyo T, Xu H, Bu G. Apolipoprotein E and Alzheimer disease: risk, mechanisms and therapy. Nat Rev Neurol 2013;9(2):106–18. Epub 2013/01/09 10.1038/nrneurol.2012.263. [PubMed PMID: 23296339; PMCID: 3726719]. [DOI] [PMC free article] [PubMed] [Google Scholar]
- [13].Edelman RR, Siewert B, Darby DG, Thangaraj V, Nobre AC, Mesulam MM, Warach S. Qualitative mapping of cerebral blood flow and functional localization with echo-planar MR imaging and signal targeting with alternating radio frequency. Radiology. 1994;192(2):513–20. doi: 10.1148/radiology.192.2.8029425. PubMed PMID: [8029425]. [DOI] [PubMed] [Google Scholar]
- [14].Sen PK. Estimates of the regression coefficient based on Kendall’s tau. J Am Stat Assoc 1968;63(324):1379–89. [Google Scholar]
- [15].Thomas R, Zuchowska P, Morris AW, Marottoli FM, Sunny S, Deaton R, et al. Epidermal growth factor prevents APOE4 and amyloid-beta-induced cognitive and cerebrovascular deficits in female mice. Acta Neuropathol Commun 2016;4(1):111 10.1186/s40478-016-0387-3. [PubMed PMID: 27788676; PMCID: 5084423]. [DOI] [PMC free article] [PubMed] [Google Scholar]
- [16].Tai LM, Youmans KL, Jungbauer L, Yu C, Ladu MJ. Introducing human APOE into abeta transgenic mouse models. Int J Alzheimers Dis 2011;2011:810981. [PubMed PMID: Medline:22028984]. [DOI] [PMC free article] [PubMed] [Google Scholar]
- [17].Pekar J, Jezzard P, Roberts DA, Leigh JS Jr., Frank JA, McLaughlin AC. Perfusion imaging with compensation for asymmetric magnetization transfer effects. Magn Reson Med. 1996;35(1):70–9. PubMed PMID: [8771024]. [DOI] [PubMed] [Google Scholar]
- [18].Jahanian H, Noll DC, Hernandez-Garcia L. B0 field inhomogeneity considerations in pseudo-continuous arterial spin labeling (pCASL): effects on tagging efficiency and correction strategy. NMR Biomed 2011;24(10):1202–9. [PubMed PMID: Medline:21387447]. [DOI] [PubMed] [Google Scholar]
- [19].Cai K, Singh A, Poptani H, Li W, Yang S, Lu Y, et al. CEST signal at 2ppm (CEST@2ppm) from Z-spectral fitting correlates with creatine distribution in brain tumor. NMR Biomed 2015;28(1):1–8. 10.1002/nbm.3216. [PubMed PMID: 25295758; PMCID: PMC4257884]. [DOI] [PMC free article] [PubMed] [Google Scholar]
- [20].Guo Y, Li X, Zhang M, Chen N, Wu S, Lei J, et al. Age and brain regionassociated alterations of cerebral blood flow in early Alzheimer’s disease assessed in AbetaPPSWE/PS1DeltaE9 transgenic mice using arterial spin labeling. Mol Med Rep 2019;19(4):3045–52. 10.3892/mmr.2019.9950. [PubMed PMID: 30816468; PMCID: PMC6423566]. [DOI] [PMC free article] [PubMed] [Google Scholar]
- [21].Foley LM, Iqbal O’Meara AM, Wisniewski SR, Hitchens TK, Melick JA, Ho C, et al. MRI assessment of cerebral blood flow after experimental traumatic brain injury combined with hemorrhagic shock in mice. J Cereb Blood Flow Metab 2013;33(1):129–36. 10.1038/jcbfm.2012.145. [PubMed PMID: 23072750; PMCID: PMC3597358]. [DOI] [PMC free article] [PubMed] [Google Scholar]
- [22].Reitz C, Mayeux R. Use of genetic variation as biomarkers for mild cognitive impairment and progression of mild cognitive impairment to dementia. J Alzheimers Dis 2010;19(1):229–51. [PubMed PMID: Medline:20061642]. [DOI] [PMC free article] [PubMed] [Google Scholar]
- [23].Leoni V. The effect of apolipoprotein E (ApoE) genotype on biomarkers of amyloidogenesis, tau pathology and neurodegeneration in Alzheimer’s disease. Clin Chem Lab Med 2011;49(3):375–83. [PubMed PMID: Medline:21388338]. [DOI] [PubMed] [Google Scholar]
- [24].Thal DR, Papassotiropoulos A, Saido TC, Griffin WST, Mrak RE, Kolsch H, et al. Capillary cerebral amyloid angiopathy identifies a distinct APOE epsilon4-associated subtype of sporadic Alzheimer’s disease. Acta Neuropathol 2010;120(2):169–83. [PubMed PMID: Medline:20535486]. [DOI] [PubMed] [Google Scholar]
- [25].Corder EH, Saunders AM, Strittmatter WJ, Schmechel DE, Gaskell PC, Small GW, et al. Gene dose of apolipoprotein E type 4 allele and the risk of Alzheimer’s disease in late onset families. Science 1993;261(5123):921–3. [PubMed PMID: Medline:8346443]. [DOI] [PubMed] [Google Scholar]
- [26].Ghebremedhin E, Schultz C, Thal DR, Rub U, Ohm TG, Braak E, et al. Gender and age modify the association between APOE and AD-related neuropathology. Neurology 2001;56(12):1696–701. [PubMed PMID: Medline:11425936]. [DOI] [PubMed] [Google Scholar]
- [27].Zerbi V, Wiesmann M, Emmerzaal TL, Jansen D, Van Beek M, Mutsaers MP, Beckmann CF, Heerschap A, Kiliaan AJ. Resting-state functional connectivity changes in aging apoE4 and apoE-KO mice. J Neurosci. 2014;34(42):13963–75. doi: 10.1523/JNEUROSCI.0684-14.2014. PubMed PMID: [25319693]. [DOI] [PMC free article] [PubMed] [Google Scholar]
- [28].Tai LM, Balu D, Avila-Munoz E, Abdullah L, Thomas R, Collins N, et al. EFAD transgenic mice as a human APOE relevant preclinical model of Alzheimer’s disease. J Lipid Res 2017. 10.1194/jlr.R076315. [DOI] [PMC free article] [PubMed] [Google Scholar]
- [29].Calamante F, Thomas DL, Pell GS, Wiersma J, Turner R. Measuring cerebral blood flow using magnetic resonance imaging techniques. J Cereb Blood Flow Metab. 1999;19(7):701–35. PubMed PMID: Medline:10413026. [DOI] [PubMed] [Google Scholar]
- [30].Zaiss M, Schmitt B, Bachert P. Quantitative separation of CEST effect from magnetization transfer and spillover effects by Lorentzian-line-fit analysis of z-spectra. J Magn Reson 2011;211(2):149–55. 10.1016/j.jmr.2011.05.001. [PubMed PMID: 21641247]. [DOI] [PubMed] [Google Scholar]
- [31].Morrison C, Stanisz G, Henkelman RM. Modeling magnetization transfer for biological-like systems using a semi-solid pool with a super-Lorentzian lineshape and dipolar reservoir. J Magn Reson B. 1995;108(2):103–13. PubMed PMID: [7648009]. [DOI] [PubMed] [Google Scholar]
- [32].Li AX, Hudson RH, Barrett JW, Jones CK, Pasternak SH, Bartha R. Four-pool modeling of proton exchange processes in biological systems in the presence of MRI-paramagnetic chemical exchange saturation transfer (PARACEST) agents. Magn Reson Med 2008;60(5):1197–206. 10.1002/mrm.21752. [PubMed PMID: 18958857]. [DOI] [PubMed] [Google Scholar]


