Abstract
Objective:
In this paper, we propose a robust, efficient, and automatic reconnection algorithm for bridging interrupted curvilinear skeletons in ophthalmologic images.
Methods:
This method employs the contour completion process, i.e., mathematical modeling of the direction process in the roto-translation group to achieve line propagation/completion. The completion process can be used to reconstruct interrupted curves by considering their local consistency. An explicit scheme with finite-difference approximation is used to construct the three-dimensional (3-D) completion kernel, where we choose the Gamma distribution for time integration. To process structures in SE(2), the orientation score framework is exploited to lift the 2-D curvilinear segments into the 3-D space. The propagation and reconnection of interrupted segments are achieved by convolving the completion kernel with orientation scores via iterative group convolutions. To overcome the problem of incorrect skeletonization of 2-D structures at junctions, a 3-D segment-wise thinning technique is proposed to process each segment separately in orientation scores.
Results:
Validations on 4 datasets with different image modalities show that our method achieves an average success rate of 95.24% in reconnecting 40 457 gaps of sizes from 7 × 7 to 39 × 39, including challenging junction structures.
Conclusion:
The reconnection approach can be a useful and reliable technique for bridging complex curvilinear interruptions.
Significance:
The presented method is a critical work to obtain more complete curvilinear structures in ophthalmologic images. It provides better topological and geometric connectivities for further analysis.
Keywords: Vessel segmentation, line completion, orientation score (OS), retinal images, ophthalmologic images
I. Introduction
A. Clinical Importance of Curvilinear Structures in Ophthalmologic Images
OPHTHALMOLOGIC images like retinal and corneal nerve fiber images are widely used in clinical assessment for a variety of diseases [1]–[4], as strong links exist between different pathologies and geometrical properties of the blood vessels and nerves. For example, retina-related diseases such as diabetic retinopathy (DR) and retinopathy of prematurity (ROP) usually cause variations in the blood vessels like neovascularization and tortuosity changes [1], [2]. Consequently, retinal fundus images are increasingly used for measuring clinical biomarkers such as vessel calibers, artery/vein ratio and fractal dimension for the early diagnosis of systemic diseases, e.g. hypertension and arteriosclerosis [1]. In corneal nerve images, significant changes in nerve fiber length, fiber density, branch density and connecting points are presented as the clinical signs of type-II diabetes [3]. The tortuosity changes of nerve fibers have a close correlation with diabetic neuropathy [4].
The rapid development of retinal fundus cameras and corneal confocal microscopes have facilitated the studies between image structures and diseases in a noninvasive way. However, the full visual inspection by specialists slows down the clinical assessment speed for decision making and treatment planning. In particular, the prevalence of ophthalmologic diseases requires early computer-aided diagnosis (CAD) to assist large-screening programs efficiently. Due to the clinical importance of analyzing the curvilinear structures in different image modalities, automatic segmentation methods are needed.
B. Curvilinear Network Extraction Methods and Challenges
1). Method Overview:
A variety of previous studies for identifying the retinal vascular network [5]–[11] and for extracting the corneal nerve fibers [12], [13] have been proposed. They can generally be classified into two categories: tracking-based approaches [6], [14]–[16] and segmentation-based approaches [5], [9], [17]. These methods provide a binary segmentation or centerline map of curvilinear/elongated structures. Segmentation-based approaches exploit different profile models or filters to highlight curvilinear structures, or integrate them with a supervised learning procedure to predict the pixel probabilities of being a curvilinear structure. Tracking-based approaches start from predefined seed points and iteratively track the optimal path until a stopping criterion is satisfied.
2). Challenging Interruptions:
In general, many segmentation tasks emphasize the extraction of as many elongated segments as possible, but they ignore to consider the importance of structure connectivity. However, challenging cases like non-uniform illumination or contrast changes, low intensities or low signal to noise ratios especially in tiny structures, strong central arterial reflex, vessel narrowing and complete occlusions often cause interruptions along vessels, or missing crossings/bifurcations as shown in Fig. 1. Segmentation-based approaches are sensitive to these difficult cases because they mainly take into account the local pixel appearances for classification. Many tracking based approaches rely on an initial segmentation of the curvilinear network, from which they begin to trace the skeleton of the binary segmentation. This dependency will produce incomplete graph representations when imperfect segmentation results and skeletons are used to guide the tracking. Other challenges are missing junctions between tiny and large structures, interruptions at bifurcations/crossings with small angles and complex junctions that are very close to each other. More discussions on the topological and geometrical connectivities of curvilinear network can be found in [14], [18]–[22].
Fig. 1.
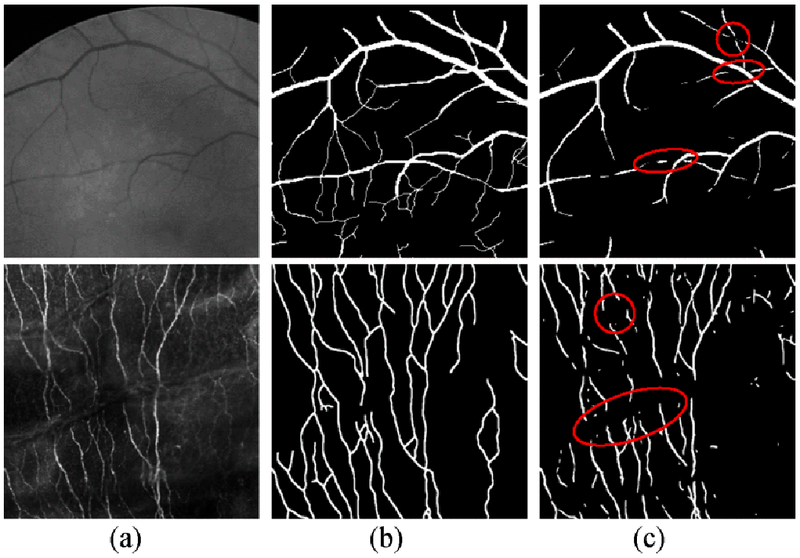
Segmentation in retinal images (Row 1) and corneal nerve liber images (Row 2) with the presence of interruptions, (a) The original patch, (b) the ground truth and (c) the segmentation results in row 1 and 2 were obtained from the methods by Soares et al. [23] and Zhang et al. [9], respectively.
3). Motivation for the Reconnection of Interruptions:
Since the interrupted curvilinear segments are not able to fully represent the geometric network, quantitative biomarker measurements from the extracted structures become less reliable in practice. For example, the statistical analysis of vessel tortuosity, segment length, vessel calibers, bifurcation/crossing angles, corneal never fiber tortuosity and density may produce wrong indications to the computer-aided diagnosis. To give a better description of geometric features, a reconnection method for interrupted segments is strongly needed to repair the missing skeleton gaps in many state-of-the-art segmentations.
C. Related-Works for the Reconnection
Currently, the limited studies available mainly focus on connectivity analysis of separated curvilinear segments, i.e. finding their connection relations and grouping them together. Favali et al. [24] analyze the vessel connectivity relations based on spectral clustering on a large local affinity matrix, which is obtained from the stochastic model of the cortical connectivity. This method effectively identifies matching vessel segments, however, does not provide means for closing the gap between them. Only a few papers address the development of fully automatic methods for the reconnection of interrupted structures. Joshi et al. [25] presented a method for automatic identification and reconnection of interrupted gaps in retinal vessel segmentations. This method firstly extracts the end points of a vessel segment which needs to be reconnected back to the main structure, and then uses a graph search method with several constraints for segment reconnection.
A general approach for reconnecting the interrupted curvilinear structures with extensive evaluations and applications is still missing in literature. Moreover, the above mentioned methods are primarily interested in filling the gaps located within vascular segments, but some small structures like crossings/bifurcations as well as small vessels are ignored, as shown in Fig. 1 (Row 1. The complex linkages at junctions are challenging cases for these methods. The clinical practice requires a method that works both efficiently and accurately.
D. The Proposed Pipeline and its Contributions
In this paper, we propose an automatic method for closing the broken gaps in the binarized skeleton of curvilinear segmentations. The proposed method is based on the stochastic processes for contour completion, i.e., mathematical modeling of the propagation of lines and contours [26]–[30]. The stochastic contour completion process as proposed by Mumford [26], also called the direction process, corresponds to the Gestalt law of good continuation [31], [32]. As shown in Fig. 2, disconnected segments in an image are perceived as the components of a continuous line after perceptual grouping by our visual system. Parent and Zucker [33] demonstrated in both theory and practice that it is feasible to reconstruct curves by considering the consistency relationships between interrupted structures.
Fig. 2.
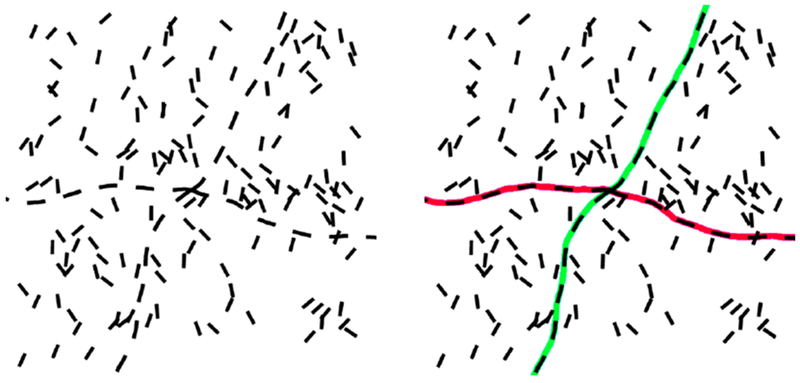
Example of grouping line segments in human’s perceptual system, which is in accordance with the Gestalt law of good continuation.
In our previous work [30], extensive comparisons among different numerical approaches and the exact solution of the Fokker-Planck equations for contour completion modeling are studied. The contour completion (direction) process has been modeled by many numerical schemes [34]–[37] on the rotation and translation group , i.e. the coupled space of positions and orientations. We aim to bridge the continuation of interrupted curves by using the line propagation property of the numerical completion kernel. The explicit scheme with finite difference (FD) approximation [30] is used to model the direction process, since it is a time-dependent process which allows adaption of the kernel evolution. It turns out that the FD completion kernel on SE(2) can excellently promote line propagation for gap fillings in segments, crossings and bifurcations. To specifically process curvilinear structures in SE(2), we rely on the formal group-theoretical framework of orientation scores [38] to lift the 2D curvilinear structures into the 3D space of positions and orientations , where we have the important property that 2D elongated structures are disentangled into different orientation planes according to their local orientations, see Fig. 3. Afterwards, we apply iterative group convolutions between the completion kernel and orientation scores to achieve line propagation and gap fillings.
Fig. 3.

A 2D image with interrupted curves is lifted to the 3D orientation scores with separation of crossings. Rotation-invariant operators Φ in the score domain strongly relate to operators ϒ in the image domain. The last figure shows the disentangled elongated structures and the rotating frame {}.
Our contributions can be summarized as follows:
This paper presents a novel approach for bridging interruptions in skeletons in order to form a complete network. The proposed explicit completion kernel is achieved via integration with a new probabilistic Gamma-distribution, which is proved to be able to avoid singularities at the origin of the completion kernel.
In addition to the theoretical ideas, we show that in practice this newly proposed time integration in contour completion provides better propagation for filling interrupted curvilinear structures.
A new orientation score based segment-wise thinning (SWT) technique is proposed to avoid imperfect thinning at junction structures by standard 2D methods.
To the best of our knowledge, this is not only the first time of full evaluation of a gap filling method on large datasets with different image modalities, but also a full benchmarking of curvilinear structure reconnection via left-invariant geometric diffusions of the contour completion framework.
The remainder of this paper is organized as follows. We explain the geometrical tools for setting up the completion framework in Section II. Afterwards, we present the detailed methodologies of the line completion process in Section III. The proposed method is then validated on the manual annotations and artificial gaps of four datasets in Section IV. Finally, we discuss and conclude this work in Section V.
II. Geometrical Tools
Physiological findings in the visual system show that neurons with aligned receptive field sites excite each other for the captured visual input. The receptive fields not only cope with local position and orientation information, but also account for context and alignment [39]. These physiological facts motivate the developments of different group-theoretical models for image processing tasks [19], [28]–[30], [37], [40]. In this work, we use the rotation and translation group SE(2) for orientation score processing [6], [29], [38]. In this section, we first give explanations to the Lie group domain in which we model the direction process. Then we briefly show how we can lift a 2D image to the 3D space () of positions and orientations using the orientation score transform.
A. The Roto-Translation Group
The roto-translation group SE(2) defines the Lie-group domain of positions and orientations , where the group element is given by g = (x, θ) with and the group product is defined as
where a counter-clockwise rotation over angle θ is given by Note that the roto-translation group SE(2) has non-commutative group structure, i.e. rotations and translations do not commute, This is because a rotation Rθ pops up in the translation part, which is expressed by the semi–direct product “×” between and S1. Fig. 4 gives an example of lifting a 2D curve to the space of SE(2).
Fig. 4.
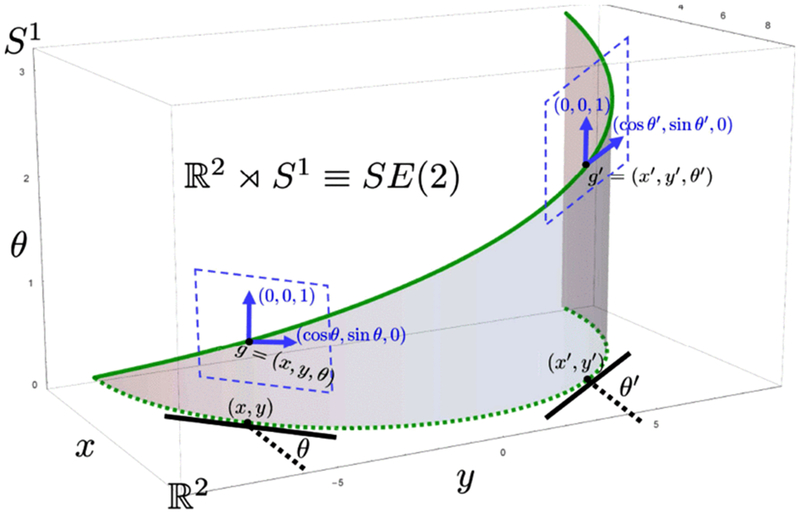
A 3D curve (solid green curve) is obtained by lifting a 2D curve (dashed green curve) into the roto-translation group SE(2). The dashed blue contours represent the tangent plane at the group elements g and g′.
B. Orientation Scores
An orientation score is obtained by lifting a 2D image f into a 3D Lie-group domain via correlation with an anisotropic kernel . This orientation score is defined as a function and obtained by
| (1) |
where represents the wavelet-type transform, and we choose cake wavelets [6] for ψ. The advantage of using cake wavelets ψ is that they uniformly cover the whole Fourier domain such that no data-evidence is lost. The quadrature property of cake wavelets ensures that the real part contains information of the locally symmetric structures, e.g., ridges/lines, and the imaginary part represents the antisymmetric structures, e.g., edges. Fig. 3 gives an example of the orientation score transform. Since in this work we are primarily interested in connecting the centerline segments, we only use the real part of the orientation score. Crossing curvilinear structures are separated from each other and lifted to different orientation score planes. We make use of this property, and propose a new segment-wise thinning approach in the orientation score domain, instead of using 2D morphological thinning in the image domain, to be used in our reconnection pipeline, which will be explained in Section III-C (see Fig. 9(d)–(e)).
Fig. 9.

The pipeline of applying the proposed segment-wise thinning (SWT) approach on an image patch with crossings, and its comparison with the classical 2D thinning method. (a) and (b) Show the original image and its orientation scores, respectively. (c) Shows thinning on the separated components/segments in orientation scores. (d) Shows the well-preserved thinning results based on the proposed SWT approach, and compared with the classical 2D thinning in (d).
C. Left-Invariant Derivative Frames
The planar translation operation on an image f is defined as and the rotation operation is given by As such, the unitary representation of the roto-translation group SE(2) can be written as where for all g, h ∈ SE(2), we define and The left-regular1 group representation on images is given by In Fig. 3, Φ is defined as an operator acting on orientation scores. Its left-invariant property is satisfied if Φ meets the following commutative requirement, i.e.,
| (2) |
with the left-regular group representations given by on orientation scores (SE(2)). Consequently it is straightforward to show (using (1)) that
| (3) |
Thus, if Φ is a left-invariant operator, the operator on the 2D image domain is Euclidean-invariant (invariant to translations and rotations of image f), i.e.,
| (4) |
The tangent vector Xe ∈ Te(SE(2)) of a curve at the origin e = (0,0,0) ∈ SE(2) is spanned by the basis {ex, ey, eθ}. The push-forward operation (translation and rotation) of the left-multiplication of the curve γ by g ∈ SE(2) assigns each Xe a corresponding tangent vector Xg = (Lg)*Xe ∈ Tg (SE(2)), which is spanned by left-invariant basis vectors and can be conveniently written as:
| (5) |
where the push-forward of left-multiplication Lgh = gh is denoted by (Lg)*. The planar tangent space T() is spanned by the basis2 {∂x, ∂y}. Thus, we define the notation for the left-invariant vector fields on SE(2) (see also Fig. 3) as
| (6) |
III. Method
We aim to bridge gaps through a specific directional diffusion process in the orientation score domain. In Section III-A1, we first give the basic representation of the left-invariant PDE-evolutions of the convection-diffusion process (7) expressed in the left-invariant basis (6) in SE(2). The solution of the left-invariant evolution will provide us with the time-dependent line completion kernel. To solve (7), we use the explicit numerical scheme to approximate the convection-diffusion process as shown in (9) in Section III-A2. To achieve the most exact approximation, we construct the time-independent completion kernel by integrating the time-dependent convection-diffusion process over the Gamma-distributed traveling life time in Section III-A3. Based on the obtained completion kernel, we intend to reconnect all the interrupted skeletons via iterative group convolutions. In Section III-B, we give the detailed routine of applying iterative group convolutions on orientation scores to bridge gaps. Additionally, a segment-wise thinning (SWT) technique in orientation scores is proposed in Section III-C to solve the imperfect skeletonization problem at junctions when using the classical morphological thinning.
A. Explicit Convection-Diffusion for Contour Completion
1). Convection-Diffusion Process:
The left-invariant derivatives defined in the previous section can be used to design the diffusion and convection processes on SE(2) [30]. The diffusion process takes care of the de-noising of elongated structures and the preservation of junctions, while the convection process is responsible for filling the gap of interrupted curvilinear structures. The left-invariant evolution of the Fokker-Planck equation is given by
| (7) |
where U0 is the initial condition, and is usually given by the orientation score and W(·,t) provides the solution of the evolution at time t. The quadratic form of the convection-diffusion generator is defined as
| (8) |
where the first order part represents the convection, and the second order part determines the diffusion. Fig. 5(b) shows the stochastic process for contour completion approximation and Fig. 5(c) gives the exact contour completion kernel.
Fig. 5.
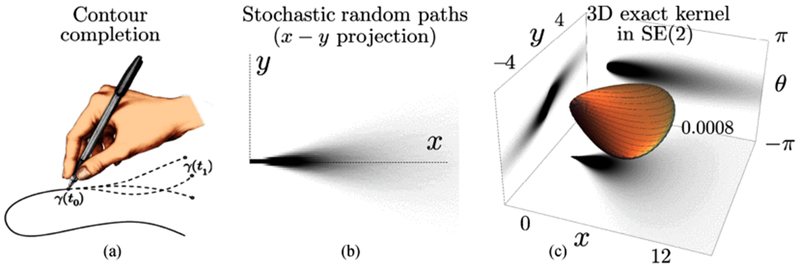
Example of the modelings of the stochastic completion kernel and the exact completion kernel, (a) Completion process models drawing in one direction to connect the given boundary conditions. (b) The x-y projection of the Monte Carlo simulation of the stochastic random process for contour completion (50000 paths). (c) The 3D completion kernel generated from the exact solution of the Fokker-Planck equation and its projection on different planes.
2). Explicit Scheme for Convection-Diffusion Process:
The explicit approximation of the completion process can be achieved by using the convection-diffusion generator in a general representation, i.e. with a = (1,0,0) for convection and D = diag{0,0, D33} with constant D33 > 0 for diffusion. Here, the backward finite difference scheme is employed to approximate the convection term according to the upwind principle, and the centered 2nd order finite difference scheme with B-spline interpolation is used to approximate the 2nd order diffusion term . The reason for using the finite difference approximation is not only because the numerical implementation is simple, but also the boundary conditions can be specified and modified conveniently. The explicit convection-diffusion process is simulated by the following forward Euler scheme for time discretization:
| (9) |
where the time step is given by Δt with sufficiently small bound Δt ≤ 0.16 to ensure the stability of the diffusion process [30]. To prevent the additional blurring because of interpolation, the step size of the convection process is typically set as the spatial grid size (Δt = Δx). The numerical evolution is approximated by splitting the convection and diffusion processes alternatively, i.e., 1/2 of the diffusion steps before 1 convection step, and 1/2 diffusions afterwards. The kernel evolution process starts with a spatially Gaussian blurred 3D spike for reducing numerical errors. The d–dimensional Gaussian kernel is given by and where σs and σ0 give the 2D-spatial scale and 1D-angular scale .
3). Time-Integrated Contour Completion Kernel:
The completion process is achieved by integrating the convection-diffusion process over the traveling time t [30]. The probability of allowing a particle to move with the life time T is given by P(T = t). The time-integration via Gamma-distributions, instead of using the regular exponential decay, is better at reducing the singularities and controlling the infilling property of the left-invariant PDE’s. Hence, we propose to use the Gamma-distributions to weight each time evolution step. The Gamma distributed time T is written as
| (10) |
(where α is the rate parameter for controlling the scale of the distribution, k indicates the number of linearly independent negatively exponential distributions P(Ti = t) = αe−αt for i = 1,…, k to construct a Gamma-distribution, i.e., T = T1 + … + Tk. In other words, k could also be interpreted as the number of concatenated stochastic processes for contour completion (Fig. 5(a)), where one process starts at the position where the previous one ended [30]. Here we choose k ≥ 3 to ensure the singularity removal and better propagation of ‘ink’ towards the gap areas. See Fig. 6. Note that increasing k will produce more propagation to fill the gaps. The expected life time E(T) is set as E(T) = k/α for better approximation. We set k = 3 in our experiments. The time-integrated forward completion kernel can be written as
| (11) |
Since a particle can either go forward or backward with identical probability distribution in the direction of the curvilinear structures, here we consider both the forward and backward propagation for constructing the contour completion kernel. By setting the convection term as a = (−1,0,0), the backward kernel that moves in the opposite direction is generated as
| (12) |
The final double-sided completion kernel is obtained by combing the forward and backward processes, i.e.,
| (13) |
In Fig. 7, we show the 3D volume of the explicit completion kernel and its projections on different planes.
Fig. 6.
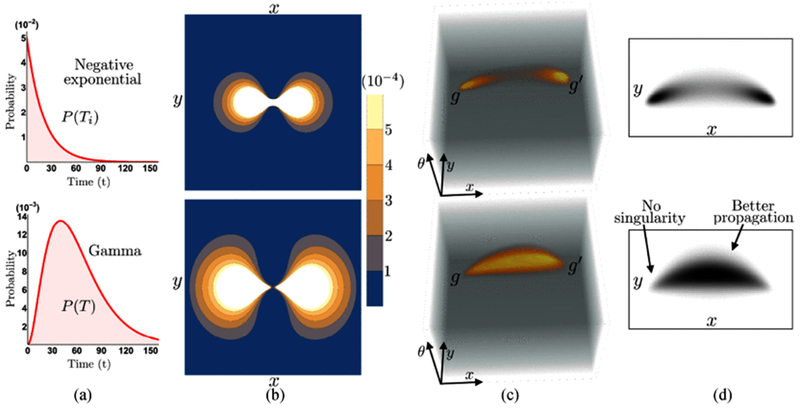
Examples of the completion process in SE(2) via time integration with negative exponential distribution (Row 1) and Gamma distribution (Row 2). Column (a) presents the negative exponential distribution with α = 0.05 and Gamma distribution with α = 0.05 and k = 3, Column (b) shows the contour plots of the 2D projection of the explicit completion kernel. Column (c) gives the 3D “ink propagation” for filling the gaps between two group elements and , where the Gamma distribution gives better propagation and avoids singularities at the origin as shown in (d).
Fig. 7.
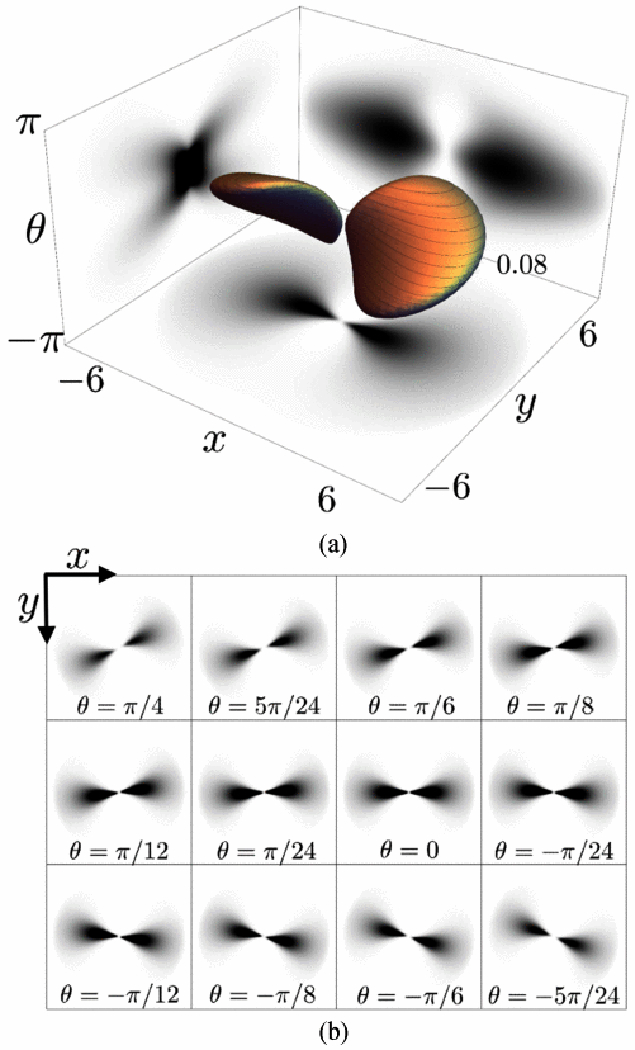
(a) Example of a 3D completion kernel; (b) Some of the orientation layers of the completion kernel.
B. Iterative Connections via Group Convolutions in SE(2)
To efficiently propagate and reconnect the interrupted curvilinear structures, we propose a routine of convolving the completion kernel with orientation scores Uf via SE(2) group convolutions. This convolution should follow the SE(2) group properties to preserve translation and rotation invariance, i.e., left-invariance. The SE(2)-convolution is defined by
| (14) |
where represents the double-sided completion kernel obtained from Section III-A3. Fig. 8(b) and (c) show the group convolution between orientation scores and the 3D completion kernel. After the SE(2) group convolution, the convolved orientation scores are thresholded with respect to a value Th, and thereby we obtain the binarized orientation scores Ubf(x, y, θ). The proposed routine for iteratively reconnecting interrupted curvilinear structures based on the completion process is given in Algorithm 1. Fig. 8 shows the pipeline of reconnecting the interrupted skeletons based on the kernel convolution process in SE(2) group. In Fig. 8(c), line propagation is achieved via the group convolution with the completion kernel, and thus all the gaps are very well connected based on their context and alignments after completion.
Fig. 8.

The proposed pipeline (Algorithm 1) for bridging the interrupted curvilinear gaps via completion process in SE(2). (a) Original skeleton, (b) Data representation and kernel in SE(2). (c) SE(2) group convolution, (d) Segment-wise thinning.
Algorithm 1:
Reconnecting interrupted curvilinear structures via group convolutions with the completion kernel in SE(2).
| Input: the number of iterations NI, the threshold value Th for binarizing the convolved orientation scores. |
| Output: curvilinear skeleton with reconnected gaps. |
| 1: for i = 1 to NI do |
| 2: lift the disconnected skeleton map f (x, y) to the 3D orientation scores Uf using (1), where we choose the number of orientations N0 = 32 with 2π-periodicity. |
| 3: obtain the time-integrated completion kernel R(x, y, θ) using (13). |
| 4: apply SE(2) group convolutions between Uf(x, y, θ) and R(x, y, θ) using (14), and we set Uf(x, y, θ) ← R(x, y, θ) *SE(2) Uf(x, y, θ) to obtain the propagated curvilinear network. |
| 5: |
| 6: apply segment-wise thinning (Algorithm 2) on the binarized orientation scores Ubf(x, y, θ) and obtain a new binarized skeleton map Sf(x, y). Then we set f ← Sf(x, y). |
| 7: end for |
C. Segment-Wise Thinning (SWT) in Orientation Scores
We aim to reconnect all the interrupted skeletons via the iterative group convolution procedure. The convection-diffusion process provides structure enhancement and information propagation for filling gaps, but also has a blurring effect. It is thus useful to impose a morphological thinning operation to sharpen the result after each evolution. However, the classical morphological thinning technique in the 2D image domain often causes wrongly connected skeletons at junctions, see Fig. 9(e). These incorrect connections are passed through the whole evolution and give imperfect curvilinear networks. To solve this issue, we propose the SWT approach by taking the advantage of orientation scores, where elongated crossing/bifurcation structures are disentangled into different orientation planes with respect to their local directions. First, the 3D morphological components Umc(x, y, θ) are obtained from the binarized orientation scores Ubf (x, y, θ). Then, we select each binarized component by following
| (15) |
where i ∈ {1,…, Nmc} represents the label of Nmc components. Afterwards, we apply maximum intensity projection on each 3D component to obtain its corresponding 2D binary map which can be written as
| (16) |
The 2D map fi(x, y) of each component is separately thinned and added to the thinning map S(x, y). A final map Sf(x, y) is obtained by removing the tiny branches from S(x, y) via morphological pruning operation. The detailed SWT process is given by Algorithm 2. We apply a thinning operation on each separated line structure. As such, curvilinear crossing segments belonging to different groups are thinned without interfering each other. An intuitive comparison between classical thinning in 2D and segment-wise thinning in orientation scores is presented in Fig. 9.
Algorithm 2:
Segment-wise thinning in orientation scores.
| Input: the binarized orientation scores Ubf(x, y, θ). |
| Output: the 2D skeleton map Sf(x, y). |
| Initialization: for each point (x, y) ∈ f, set S(x, y) = 0. |
| 1: for i = 1 to Nmc do |
| 2: extract the binarized morphological component with label i using (15). |
| 3: calculate the 2D map fi(x, y) of each component via (16). |
| 4: use morphological thinning operation on fi(x, y) and obtain the thinned component Si(x, y). |
| 5: update the thinning map S(x, y) ← S(x, y) + Si(x, y). |
| 6: end for |
| 7: obtain the final thinning map Sf(x, y) by applying morphological pruning on S(x, y) to remove tiny branches. |
IV. Validation and Experimental Results
A. Material
In order to obtain an extensive validation-set we artificially create gaps in ground truth centerline data, and thereby follow a similar procedure in the validation as in the work by Jiang etal. [41] and Forkert et al. [42]. Jiang etal. [41] proposed a method for vascular image analysis where the reconnection method is applied on 3D microCT images from a mouse coronary arterial dataset with 100 artificial gaps with 2–20 voxel widths. Forkert et al. [42] developed a method for solving gap filling problems in 3D microvascular segmentations. There, evaluations are performed on the manually segmented Time-of-Flight magnetic resonance angiography images, in which also 100 gaps are artificially created to validate the connectivity reconstruction.
For the evaluation of the proposed pipeline for bridging the interrupted gaps in curvilinear structures, we use two types of ophthalmologic images: retinal fundus images and corneal nerve fiber images, as shown in Figs. 10,12–14. The experiments are performed on the retinal vessel centerline maps and the corneal nerve fiber maps.
Fig. 10.
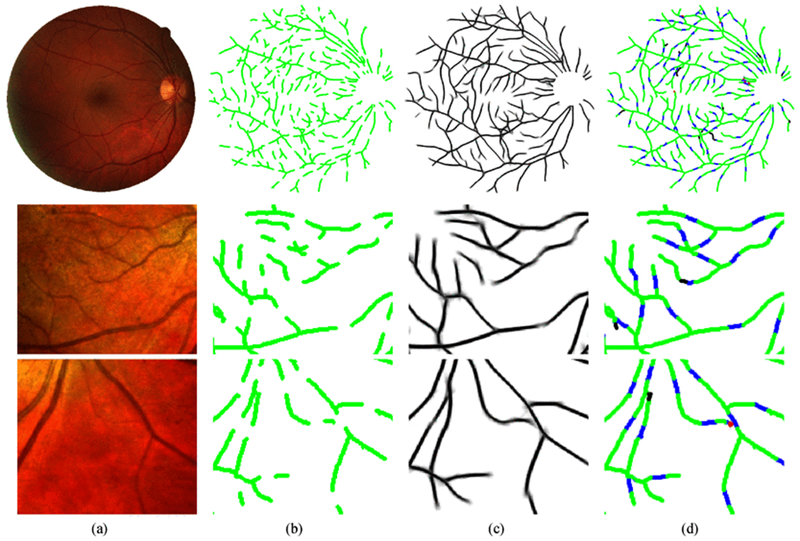
Examples of applying our method on interrupted retinal vessels. Row 1–3: a DRIVE image (565 × 584) and two IOSTAR image patches (170 × 150). (a) original images; (b) skeletons with gap size 15 × 15; (c) 2D projections after reconnection in orientation scores; (d) performance maps, where green represents the original structures, blue indicates the correctly recovered gaps, red means the false positives and black represents the missing connections.
Fig. 12.
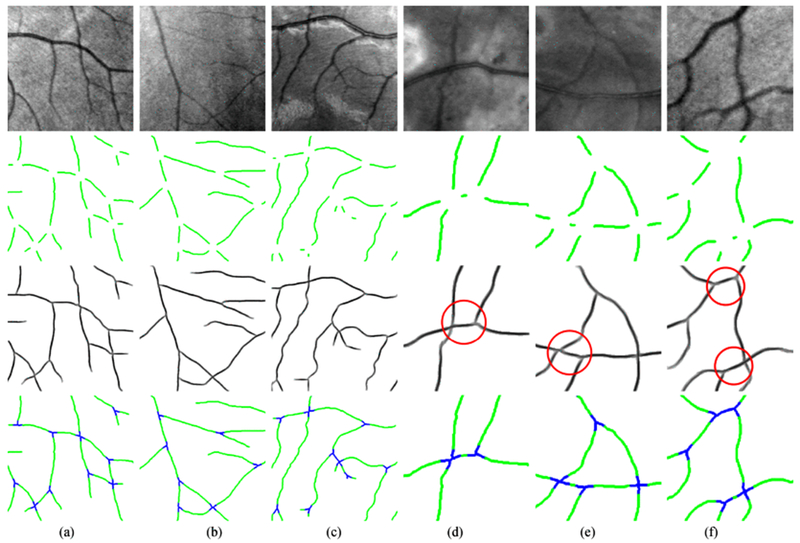
Examples of applying the proposed reconnection method on interrupted retinal vessel junctions. (a)–(c) The reconnection process on 3 HRF-Patch images (400 × 400). (d)–(f) 3 zoomed image patches (200 × 200) for better visualization. Row 1: the original images from the HRF-Patch dataset; Row 2: the junctions with gap size λ = 31 × 31; (c) the 2D projection after applying the proposed reconnection method; (d) the reconnection performance maps, where green represents the original structures, blue indicates the correctly recovered junctions. The red circles emphasize the challenging junctions.
Fig. 14.
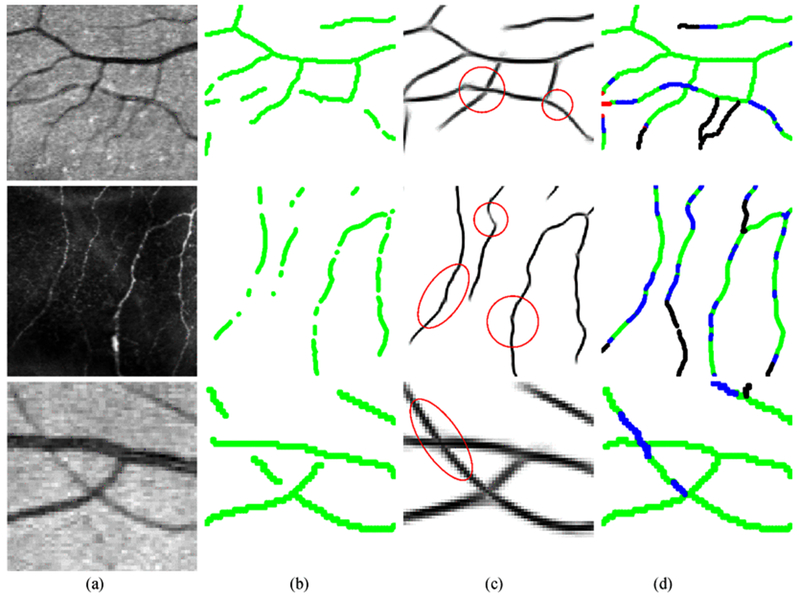
Examples of applying the proposed reconnection method on the vessel/fiber segmentation results from automatic approaches. Row 1: validation on a segmented retinal image patch (115 × 125) obtained by Soares at al.’s method [23]; Row 2: validation on an extracted corneal never fiber image patch (260 × 260) obtained by Zhang et al.’s LADOS method [9]; Row 3: validation on a segmented retinal image patch (81 × 81) obtained by Sureshjani et al.’s BIMSO method [47]. (a) The original images; (b) Binarized skeletons of segmentations; (c) the 2D projections after reconnection; (d) the performance maps, where green represents the original structures, blue indicates the ture positives, red means the false positives and black gives the missing connections.
For retinal images, here we choose the publicly available DRIVE [43] and IOSTAR [44] datasets for the evaluation of broken segments, and use the HRF [45] for the evaluation of missing junctions. The DRIVE dataset contains 40 images with a resolution of 565 × 584 pixels. The vessels in all the DRIVE images are manually annotated by human observers. The IOSTAR dataset includes 24 images with a resolution of 512 × 512 pixels. All the vessels are annotated by a group of experts working in the field of retinal image analysis. The HRF dataset [45] has 45 images and manual annotations with a resolution of 3504 × 2336 pixels. We selected 50 typical crossing and bifurcation patches (HRF-Patch) with the size of 400 × 400 pixels to validate the missing junctions. We also manually annotated all the junction points. The annotations of bifurcations and crossings for all the DRIVE and IOSTAR images are available in [46]. For corneal nerve fiber images, we use the dataset provided by the Maastricht Eye Hospital, the Netherlands. This dataset contains 30 images with a resolution of 1536 × 1536 pixels. In each of the 30 images the nerve fibers were manually annotated.
For an extensive and quantitative evaluation of the proposed method, interrupted gaps on curvilinear segments and junctions were artificially created in the provided annotations. The basic routine is as follows: we removed all the junction points based on the junction annotations. Then, we add several gaps to each separated segment, where the number of gaps is determined by the length of each segment. The total number of gaps for each dataset is shown in Table I. The gap size λ = d × d basically means that a gap is created using a binary mask of size d × d whose elements are 1 in a disk-shaped region of diameter d, and are otherwise 0. Hence, regardless of the direction of a structure, the d × d mask can always create a gap of length d along its orientation.
TABLE I.
Quantitative Measurements of the Proposed Method for Automatic Reconnection of Gaps on the 4 Validation Datasets
| Datasets | Gap sizes | Iterations | NBP | NAP | SR | Sensitivity |
Specificity |
DC |
MCC |
||||
|---|---|---|---|---|---|---|---|---|---|---|---|---|---|
| BP | AP | BP | AP | BP | AP | BP | AP | ||||||
| DRIVE | λ = 7 × 7 | 1 | 4393 | 68 | 98.5% | 0.9348 | 0.9959 | 1 | 0.9998 | 0.9663 | 0.9956 | 0.9656 | 0.9955 |
| λ = 11 × 11 | 2 | 4395 | 171 | 96.0% | 0.8786 | 0.9894 | 1 | 0.9994 | 0.9353 | 0.9874 | 0.9351 | 0.9869 | |
| λ = 15 × 15 | 2 | 4161 | 335 | 92.0% | 0.8219 | 0.9763 | 1 | 0.9990 | 0.9020 | 0.9756 | 0.9034 | 0.9747 | |
| IOSTAR | λ = 7 × 7 | 1 | 1932 | 14 | 99.4% | 0.9393 | 0.9981 | 1 | 0.9997 | 0.9687 | 0.9942 | 0.9683 | 0.9940 |
| λ = 11 × 11 | 2 | 2006 | 30 | 98.5% | 0.8859 | 0.9966 | 1 | 0.9997 | 0.9394 | 0.9936 | 0.9396 | 0.9934 | |
| λ = 15 × 15 | 2 | 1845 | 88 | 95.3% | 0.8354 | 0.9906 | 1 | 0.9996 | 0.9102 | 0.9878 | 0.9118 | 0.9874 | |
| HRF-Patch | λ = 15 × 15 | 1 | 410 | 9 | 98.0% | 0.9123 | 0.9991 | 1 | 0.9999 | 0.9541 | 0.9973 | 0.9546 | 0.9972 |
| λ = 23 × 23 | 2 | 410 | 16 | 96.5% | 0.8575 | 0.9936 | 1 | 0.9999 | 0.9231 | 0.9940 | 0.9252 | 0.9939 | |
| λ = 31 × 31 | 2 | 410 | 32 | 92.8% | 0.8061 | 0.9862 | 1 | 0.9998 | 0.8924 | 0.9897 | 0.8967 | 0.9896 | |
| λ = 39 × 39 | 3 | 410 | 44 | 89.7% | 0.7533 | 0.9552 | 1 | 0.9997 | 0.8588 | 0.9643 | 0.8665 | 0.9639 | |
| Corneal Nerve Fiber | λ = 13 × 13 | 1 | 5278 | 23 | 99.6% | 0.8962 | 0.9929 | 1 | 0.9998 | 0.9453 | 0.9895 | 0.9459 | 0.9894 |
| λ = 19 × 19 | 2 | 5278 | 113 | 98.0% | 0.8383 | 0.9800 | 1 | 0.9992 | 0.9120 | 0.9647 | 0.9144 | 0.9643 | |
| λ = 25 × 25 | 2 | 5278 | 316 | 94.0% | 0.7838 | 0.9743 | 1 | 0.9991 | 0.8788 | 0.9594 | 0.8839 | 0.9589 | |
| λ = 31 × 31 | 2 | 4251 | 674 | 85.0% | 0.7820 | 0.9665 | 1 | 0.9991 | 0.8776 | 0.9529 | 0.8828 | 0.9522 | |
BP: Before processing; AP: After processing; NBP: Number of gaps before processing; NAP: Number of gaps after processing; SR; Success rate; DC: Dice coefficient; MCC: Matthews correlation coefficient
B. Performance Measurements
To quantitatively evaluate the reconnection of the curvilinear structures, we need to define performance measurements to compare the results before and after applying our method. To obtain the number of successfully connected gaps, a success rate (SR) metric is defined by SR = (NBP – NAP)/NBP, where NBP and NAP represent the number of gaps before and after reconnection, respectively. To precisely confirm that gaps are correctly connected, we check each gap position based on the following ground truth masking criterion:
For each gap, we extract its missing part from the skeleton ground truth. Then we create a mask for each gap by dilating the extracted missing skeleton with 2 pixels.
Then we check the number of morphological components NB under this mask before reconnection and the number NA after reconnection.
If NB = 2 (two endpoints of a gap) and NA = 1 (connected endpoints), we label this gap as “correctly connected”. Otherwise, we label it as “wrongly connected” and update NAP ← NAP + 1.
The false positive cases mainly locate at the wrongly grown segments outside the gap regions and the vessel/fiber endings. Hence, they can be more conveniently evaluated in a pixel-based manner. To evaluate the improvement to the whole curvilinear network, we also compare the binarized skeletons before and after processing with the ground truth separately. We calculate the performance metrics; Sensitivity (Se), Specificity (Sp), Dice coefficient (DC) and Matthews correlation coefficient (MCC) in the comparison.
C. Settings
For the low resolution DRIVE and IOSTAR dataset, we choose the completion kernel size as 32 × 51 × 51, the diffusion parameters D = diag{0,0, D33} with small angular diffusion D33 = 0.01, and the threshold value Th = 0.23. For the high resolution HRF and corneal nerve fiber images with relatively larger gaps, we use the kernel size 32 × 101 × 101 and the threshold value Th = 0.1 to allow much faster propagation. Hence, in our experiments we use 2 iterations to reconnect the gap size of 15 × 15 for the DRIVE and IOSTAR datasets, while we use only 1 iteration for the HRF dataset (see Table I). For the other settings, the convection parameter is set to |a| = (1, 0, 0) with Δt = Δx to ensure the time steps equal to the spatial grid size. The step size for the diffusion process is set to 0.05 to keep the stability. The kernel evolution is initialized by a spatially Gaussian blurred spike (recall Section III-A2) with σs = σ0 = 0.7. The parameters for the Gamma-distribution are fixed as α = 0.2 and k = 3 for a fast propagation, and tmax = 50 defines the end time for the time-integration.
D. Validations on the Interrupted Retinal Vessel Segments
The proposed gap reconnection approach is evaluated on the DRIVE and IOSTAR datasets with interrupted vessel segments. The gap sizes of 7 × 7, 11 × 11 and 15 × 15 are respectively created for the DRIVE images, yielding three gap datasets for validation. In total, 4393, 4395 and 4161 gaps are respectively created for the three gap datasets. Using the proposed method in Algorithm 1, an iterative reconnection process is applied on the three test sets. We use 1 iteration for bridging the gaps of 7×7, and 2 iterations for the gaps 11 × 11 and 15 × 15, as shown in Table I. We can see that high SR values are achieved on all the three sets. This means that most of the gaps are successfully filled after our processing steps. The proposed method also obtains high values on performance metrics such as sensitivity (Se), specificity (Sp), MCC and DC, among which the DC and MCC both consider true and false positives and negatives in a balanced way. In Table I, the Sp values before processing are 1 for all the datasets. This is because the original gap datasets are artificially created based on the ground truth images which have zero false positive before processing. Table I also shows similar performance measures obtained from the IOSTAR dataset, with respectively 1932, 2006 and 1845 gaps for three different gap sizes. The proposed method obtains high SR values on all the three cases. In Fig. 10, we give examples of the processed images with reconstructed connections.
E. Validations on the Interrupted Retinal Vessel Junctions
Interrupted junctions are challenging cases for the reconnection task and obviously overlooked in the literature. One major reason is that the missing junctions have more candidate ending points with several connection possibilities. Here we validate the proposed method on the HRF-Patch dataset with interrupted junctions of different sizes. Due to the complex connections among the ending points, automatic examination of correctly connected junctions is often unreliable. An interrupted junction structure generally has 3 disconnected ending points (for bifurcations) or 4 ending points (for crossings). For example, the crossing example shown in the first row of Fig. 11(c) will be wrongly judged as a correct case since it has NB = 4 (four ending points of a gap before reconnection) and NA = 1 (connected ending points) based on a similar ground truth masking criterion as proposed in Section IV-B. However, this kind of junction cases can be very easily validated by human experts. In this work, we validate the junction reconnection based on the visual judgment of two human experts. Only if both of the two experts agree that a reconnection is successful, we consider it a correct judgment. Otherwise, we say the reconnection is unsuccessful. The criteria for correct and wrong cases of the crossings/bifurcations reconnection are defined in Fig. 11.
Fig. 11.
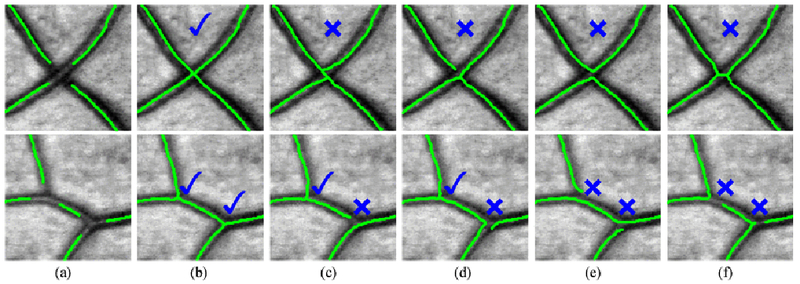
Criterion lor determining a correctly/wrongly connected crossing/bifurcation. Green color represents the curvilinear skeletons, (a) Original gaps. (b) Example 1. (c) Example 2. (d) Example 3. (e) Example 4. (f) Example 5.
Table I shows the validation results of the proposed method on gap sizes of λ = 15 × 15, 23 × 23, 31 × 31 and 39 × 39 for the HRF-Patch dataset. We can observe that among 410 missing junctions with gap size 15 × 15, 401 of them are successfully connected. The Se, Sp DC and MCC are also computed and compared to show the high performance of our method. Intuitive examples of the recovered junctions are shown in Fig. 12, where the correct reconnections of several challenging interruptions are highlighted with red circles.
F. Validations on the Interrupted Corneal Nerve Fibers
Corneal nerve fibers (see Fig. 13) are complex curvilinear structures with varying contrasts, and therefore interruptions appear very often in the segmented fibers. In this validation dataset, different gap sizes of λ = 13 × 13, 19 × 19, 25 × 25 and 31 × 31 are created by considering the general gap sizes in the automatic corneal nerve fiber segmentation results [9]. See Table I, 5278, 5278, 5278 and 4251 gaps are respectively obtained for the four cases, among which 5255 (99.6%), 5165 (98%), 4962 (94%) and 3577 (85%) are respectively connected after applying our line completion approach.
Fig. 13.
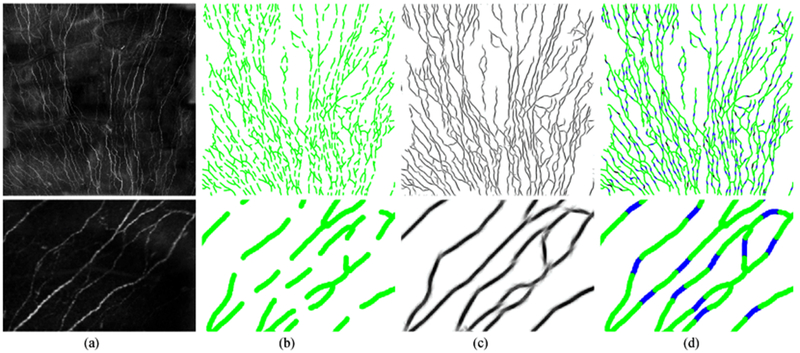
Examples of applying the proposed reconnection method on the interrupted corneal nerve fiber skeletons (1536 × 1536). (a) Row 1: the original images with clipped empty boundaries, and Row 2: a zoomed patch (220 × 320) for better visualization; (b) the broken vessel skeleton map with gap size λ = 31 × 31; (c) the 2D projection after applying the proposed reconnection method in orientation scores; (d) the reconnection performance maps, where green represents the original structures, blue indicates the correctly recovered gaps, red means the false positives and black gives the missing connections.
G. Validations on the Automatic Segmentation Results
In the previous sections, we evaluate the proposed method on artificially created gaps in different image modalities. To demonstrate the reconnection ability of our method on realistic cases, we give more specific evaluations of our method on interrupted segments from established automatic segmentation results. In Table II, the automatic retinal vessel segmentations obtained by Soares et al.’s supervised method [23] on the DRIVE dataset, the fiber extraction results obtained by Zhang et al.’s LADOS method [9] on the corneal nerve fiber dataset and the retinal vessel segmentations obtained by Sureshjani et al.’s BIMSO method [47] on a DRIVE&IOSTAR patch dataset are used to evaluate the performance of our proposed algorithm. Those realistic gaps generally range from 5 × 5 to 13 × 13 in Soares’ vessel segmentation results, from 4 × 4 to 36 × 36 in LADOS’ fiber segmentation results and from 3 × 3 to 14 × 14 in BIMSO’s vessel segmentations. To better evaluate the success rate (SR) of our method on realistic cases, we particularly set up the above DRIVE&IOSTAR patch dataset by selecting 80 image patches of size 81 × 81 with gaps from the BIMSO segmentation results on the DRIVE and IOSTAR datasets. This patch dataset mainly includes the relatively large gaps (above 3 × 3) and specific junction cases as shown in Fig. 14 for the evaluation, and excludes those small gaps (below 3 × 3) since they can be easily recovered by applying the proposed method. Among 199 gaps of all the patches, our method successfully bridges 182 of them with two iterations. In Fig. 14, we show the qualitative evaluations of different cases from the automatic segmentation results.
TABLE II.
Quantitative Measurements of the Proposed Reconnection Method on Gaps From the Automatic Segmentation Results
| Datasets | Methods | Gap sizes | Iterations | Sensitivity |
Specificity |
DC |
MCC |
||||
|---|---|---|---|---|---|---|---|---|---|---|---|
| BP | AP | BP | AP | BP | AP | BP | AP | ||||
| DRIVE | Soares [23] | 5 × 5 ≤ λ ≤ 13 × 13 | 2 | 0.7097 | 0.7311 | 0.9994 | 0.9988 | 0.8194 | 0.8273 | 0.8261 | 0.8310 |
| Corneal Nerve Fiber | LADOS [9] | 4 × 4 ≤ λ ≤ 36 × 36 | 2 | 0.7261 | 0.7887 | 0.9974 | 0.9953 | 0.7486 | 0.7520 | 0.7550 | 0.7565 |
| DRIVE & IOSTAR Patches | BIMSO [47] | 3 × 3 ≤ λ ≤ 14 × 14 | 2 | 0.8660 | 0.9038 | 0.9998 | 0.9990 | 0.9221 | 0.9364 | 0.9235 | 0.9357 |
BP: Before processing; AP: After processing; SR: Success rate; DC: Dice coefficient; MCC: Matthews correlation coefficient.
V. Discussion
In Table I, three different gap sizes for the DRIVE images are used to evaluate the proposed reconnection method. The high success rates (SR) of respectively 98.5%, 96% and 92% for the three sets show that most of the gaps are successfully reconnected after applying our method. Significant increases of 0.0611, 0.1108, 0.1544 on the Se values can be respectively observed on the three gap sizes after processing. The similar performance is also explained in the measurements of DC and MCC. The Sp values in both Tables I and II show slight decreases because of the small amount of propagation at vessel/fiber endings. In the first row of Fig. 10, the DRIVE images have gaps in more crowded curvilinear structures (with an average of 104 gaps per image) and are thus more challenging to recover all the gaps. Nevertheless, the proposed method is still able to bridge most of the gaps between segments (Fig. 10(c) and (d)) effectively without disturbing their neighbors. The blue color in Fig. 10(d) presents the correct connections, and the black color shows the missing connections. We can see that the false negatives (black color) are mainly located at the place where the segments are very small or close to junctions, such that the big gaps cannot provide sufficient context information for the reconnection. This is also the reason why the obtained SR value is 92% for the gap size 15 × 15 compared with the SR of 96% for 11 × 11.
The validation results of the IOSTAR dataset in Table I shows higher SR values than those of the DRIVE dataset. This is because the IOSTAR dataset has relatively less small vessels and interruptions (with an average of 76 gaps per image). Even for the largest gap size 15 × 15, significantly higher measurements of Se: 0.9906, Sp: 0.9996, DC: 0.9878 and MCC: 0.9874 are obtained after being processed by our reconnection method, compared with the values of Se: 0.8354, Sp: 1, DC: 0.9102 and MCC: 0.9118 before the processing. The second row in Fig. 10 give the reconnection results from the IOSTAR dataset. One practical advantage of the proposed method is that, with the efficient group convolution a large number of curvilinear gaps can be easily recovered without a predetection of the broken segments.
In Fig. 11, the criteria for correct and wrong connections of missing crossings and bifurcations under different conditions are provided. According to that, the human experts are able to distinguish a correct/wrong gap completion result easily, as explained in Section IV-E. In Table I, all the performance metrics give remarkable improvements after applying the proposed reconnection approach on the HRF-Patch dataset. Even for the gap size of 39 × 39, the Se value increases from 0.7533 before the processing to 0.9552 after the processing. In Fig. 12, reconnection results of crossings and bifurcations are given to show the good performance of our method. Complex junction structures are very well connected according to their local contexts and alignments. This is a quite difficult task due to the amount of candidates (endpoints) for reconnection, which is generally larger than for a broken segment. In Fig. 12(a)–(c), reconnection on the original patches (400 × 400) is given to show the capability of recovering interrupted junction structures. In Fig. 12(d)–(f), examples of zoomed image patches (200 × 200) are given to demonstrate the good performance of our method on challenging junction cases (under the red circles), where poor context information is provided for the reconnection of missing junctions due to the big gaps. Nevertheless, our method is still able to bridge those interruptions and achieves a perfect junction-preservation, as emphasized in blue color in Fig. 12(d)–(f).
In this work, we also proposed a orientation score based segment-wise thinning (SWT) technique (in Section III-C) to deal with the imperfect 2D morphological thinning. This SWT technique is particularly useful in producing correct curvilinear skeletons at large crossings. In Fig. 12, the SWT technique is applied to thin each complete crossing segment separately after the reconnection in orientation scores.
Table I provides the performance measurements on a more complex image modality, i.e. the corneal nerve fibers, where the distribution of curvilinear structures is more complicated due to the high density and diverse connections. Thus, the reconnection task on corneal nerve fibers is more difficult compared to retinal vessels. See examples in Fig. 13. For gap sizes of 13 × 13, 19 × 19 and 25 × 25 with 5278 gaps, our method recovers respectively 99.6%, 98% and 94% connections. The global performance on the whole dataset with gap size 25 × 25 is able to reach high values of Se: 0.9743, Sp: 0.9991, DC: 0.9594 and MCC: 0.9589 after the reconnection, in comparison with the values of 0.7838, 0.8788 and 0.8839 before the processing. For even larger size of 31 × 31 with 4251 gaps, our method can still successfully connect 85% of the total gaps and keep high measurements of Se: 0.9665, Sp: 0.9991, DC: 0.9529 and MCC: 0.9522. In the top row of Fig. 13, we give an example of gap fillings on the corneal nerve fibers. We also show a zoomed image patch with size 350 × 450 in the last row for better visualization of the reconnection results. We can observe that although the gaps in nerve fiber images are close to each other due to the high structure density, our method is still capable of bridging those gaps without affecting their neighborhoods.
Table II and Fig. 14 respectively show the qualitative and quantitative evaluations of the proposed reconnection algorithms on realistic segmentation cases. Note that the amount of gaps in realistic segmentations are much less compared with the large number of artificially created gaps. However, we can still observe remarkable improvement of the Se level from 0.7097 to 0.7311 on Soares’ segmentation results, from 0.7261 to 0.7887 on LADOS’ segmentations and from 0.8660 to 0.9038 on BIMSO’s segmentations. The DC and MCC metrics also give higher performance values after applying our reconnection method. Our method can successfully fill 182 of 199 gaps (SR: 91.5%) on the DRIVE&IOSTAR patch dataset with only two iterations. The performance evaluations on those realistic gap datasets show that our method can deal with gaps of different size distributions simultaneously.
In principle, we need more iterations to fill the large gaps, but we also want to reduce the amount of iterations to avoid the propagation at vessel/fiber endings. Hence, a reasonable number of iterations should be set to achieve the balance between the Se and Sp. The gap filling process of our method is mainly determined by both the diffusion constant and the number of iterations. For a certain application, we need to first make a rough estimation about the average gap size. By considering the average gap size and the image resolution, the best practice is that we choose a reasonable diffusion constant D33 such that the average gap size is filled after 1 or 2 iterations. Then, we can simply set the number of iterations as 3 to make sure the large gaps are also connected. The proposed approach can still preserve the geometrical properties of curvilinear structures with one or more iterations. We also show the convergence of our method by repeating experiments on the DRIVE gap dataset (in Table I) using different numbers of reconnection iterations. In Fig. 15, the corresponding Matthews correlation coefficient (MCC) performance curve is obtained by evaluating the proposed method with different numbers of iterations. We can see that after 1 or 2 iterations, the MCC performance remains stable. By increasing the number of iterations to 3 or 4, our method still maintains high performance. Therefore, we can always make a proper choice of the number of iterations for different image modalities to satisfy the practical requirement of the reconnection performance.
Fig. 15.
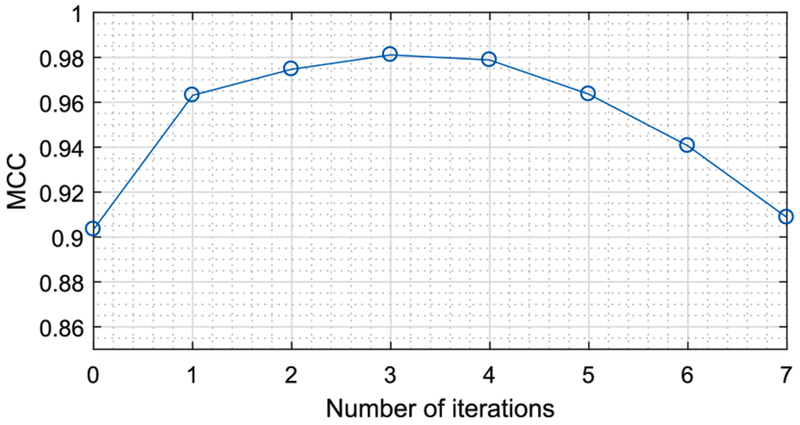
The Matthews correlation coefficient (MCC) performance curve obtained by evaluating the proposed method on the DRIVE gap dataset (with the gap size 15 × 15) using different numbers of reconnection iterations.
The proposed method leads to an efficient gap filling process. The line completion kernel can be generated and stored locally in the computer. Hence, the main computational cost of our method depends on the selected numbers of orientations in the reconnection process. We have evaluated the running time of the reconnection pipeline using Mathematica 11.1 with a computer of 3.4 GHz CPU. The time requirement for processing a full retinal image in the DRIVE/IOSTAR dataset is about 3.9 seconds for 1 iteration and 7.6 seconds for 2 iterations, which are sufficient to reconnect the gaps in our experiments. The computational efficiency can be further improved by optimizing the implementation of our method.
VI. Conclusion
In this paper, we have proposed an effective and automatic reconnection algorithm for bridging the interrupted curvilinear skeletons in ophthalmologic images. This method employs the contour completion process in the roto-translation group to achieve line and contour propagation/completion. Experiments are performed on 4 datasets with different image modalities, and the validation results show that the proposed method works robustly for the reconnection of complex curvilinear interruptions.
Acknowledgment
The authors would like to thank the valuable suggestions and comments from the anonymous reviewers.
This work was supported in part by the NWO-Hé Programme of Innovation Cooperation 2013 under Grant 629.001.003 and in part by the European Foundation for the Study of Diabetes/Chinese Diabetes Society/Lilly project.
Footnotes
Here left-regular basically means that the group multiplication takes place on the left side.
As the vector fields can also be considered as differential operators on smooth and locally defined functions, we use {∂x, ∂y} to represent the basis vectors instead of using a traditional notation {ex, ey} with ex = (1, 0) and ey = (0, 1).
Contributor Information
Jiong Zhang, Department of Biomedical Engineering, Eindhoven University of Technology, Eindhoven 5600MB, The Netherlands.
Erik Bekkers, Department of Biomedical Engineering, Eindhoven University of Technology.
Da Chen, University Paris Dauphine, PSL Research University, CNRS, UMR 7534, CEREMADE, Paris 75016, France.
Tos T. J. M. Berendschot, University Eye Clinic Maastricht
Jan Schouten, University Eye Clinic Maastricht.
Josien P. W. Pluim, Department of Biomedical Engineering, Eindhoven University of Technology
Yonggang Shi, Laboratory of Neuro Imaging, USC Stevens Neuroimaging and Informatics Institute, Keck School of Medicine, University of Southern California.
Behdad Dashtbozorg, Department of Biomedical Engineering, Eindhoven University of Technology.
Bart M. ter Haar Romeny, Department of Biomedical and Information Engineering, Northeastern University, and also with the Department of Biomedical Engineering, Eindhoven University of Technology
References
- [1].Abràmoff MD et al. , “Retinal imaging and image analysis,” IEEE Rev. Biomed. Eng, vol. 3, pp. 169–208, 2010. [DOI] [PMC free article] [PubMed] [Google Scholar]
- [2].Patton N et al. , “Retinal image analysis: Concepts, applications and potential,” Progress Retinal Eye Res, vol. 25, no. 1, pp. 99–127, 2006. [DOI] [PubMed] [Google Scholar]
- [3].Ziegler D et al. , “Early detection of nerve fiber loss by corneal confocal microscopy and skin biopsy in recently diagnosed type 2 diabetes,” Diabetes, vol. 63, pp. 2454–2463, 2014. [DOI] [PubMed] [Google Scholar]
- [4].Edwards K et al. , “Standardizing corneal nerve fibre length for nerve tortuosity increases its association with measures of diabetic neuropathy,” Diabet. Med, vol. 31, no. 10, pp. 1205–1209, 2014. [DOI] [PubMed] [Google Scholar]
- [5].Fraz M et al. , “An ensemble classification-based approach applied to retinal blood vessel segmentation,” IEEE Trans. Biomed. Eng, vol. 59, no. 9, pp. 2538–2548, September 2012. [DOI] [PubMed] [Google Scholar]
- [6].Bekkers E et al. , “A multi-orientation analysis approach to retinal vessel tracking,” J. Math. Imag. Vis, vol. 49, no. 3, pp. 583–610, 2014. [Google Scholar]
- [7].Azzopardi G et al. , “Trainable COSFIRE filters for vessel delineation with application to retinal images,” Med. Image Anal, vol. 19, no. 1, pp. 46–57, 2015. [DOI] [PubMed] [Google Scholar]
- [8].Zhao Y et al. , “Automated vessel segmentation using infinite perimeter active contour model with hybrid region information with application to retinal images,” IEEE Trans. Med. Imag, vol. 34, no. 9, pp. 1797–1807, September 2015. [DOI] [PubMed] [Google Scholar]
- [9].Zhang J et al. , “Robust retinal vessel segmentation via locally adaptive derivative frames in orientation scores,” IEEE Trans. Med. Imag, vol. 35, no. 12, pp. 2631–2644, December 2016. [DOI] [PubMed] [Google Scholar]
- [10].Roychowdhury S et al. , “Iterative vessel segmentation of fundus images,” IEEE Trans. Biomed. Eng, vol. 62, no. 7, pp. 1738–1749, July 2015. [DOI] [PubMed] [Google Scholar]
- [11].Orlando J et al. , “A discriminatively trained fully connected conditional random field model for blood vessel segmentation in fundus images,” IEEE Trans. Biomed. Eng, vol. 64, no. 1, pp. 16–27, January 2017. [DOI] [PubMed] [Google Scholar]
- [12].Ferreira A et al. , “A method for corneal nerves automatic segmentation and morphometric analysis,” Comput. Methods Programs Biomed, vol. 107, no. 1, pp. 53–60,2012. [DOI] [PubMed] [Google Scholar]
- [13].Annunziata R et al. , “A fully automated tortuosity quantification system with application to corneal nerve fibres in confocal microscopy images,” Med. Image Anal, vol. 32, pp. 216–232, 2016. [DOI] [PubMed] [Google Scholar]
- [14].De J et al. , “A graph-theoretical approach for tracing filamentary structures in neuronal and retinal images,” IEEE Trans. Med. Imag, vol. 35, no. 1, pp. 257–272, January 2016. [DOI] [PubMed] [Google Scholar]
- [15].Chen D et al. , “Global minimum for a finsler elastica minimal path approach,” Int. J. Comput. Vis, vol. 122, no. 3, pp. 458–483, 2017. [Google Scholar]
- [16].Chen Y et al. , “Curve-like structure extraction using minimal path propagation with backtracking,” IEEE Trans. Imag. Process, vol. 25, no. 2, pp. 988–1003, February 2016. [DOI] [PubMed] [Google Scholar]
- [17].Zhang J et al. , “Retinal vessel delineation using a brain-inspired wavelet transform and random forest,” Pattern Recognit, vol. 69, pp. 107–123, 2017. [Google Scholar]
- [18].Al-Diri B et al. , “Automated analysis of retinal vascular network connectivity,” Comput. Med. Imag. Graph, vol. 34, no. 6, pp. 462–470,2010. [DOI] [PubMed] [Google Scholar]
- [19].Sanguinetti G et al. , “A model of natural image edge co-occurrence in the rototranslation group,” J. Vis, vol. 10, no. 14, pp. 37–37, 2010. [DOI] [PubMed] [Google Scholar]
- [20].Türetken E et al. , “Automated reconstruction of dendritic and axonal trees by global optimization with geometric priors,” Neuminformatics, vol. 9, no. 2/3, pp. 279–302, 2011. [DOI] [PubMed] [Google Scholar]
- [21].Joshi VS et al. , “Automated method for the identification and analysis of vascular tree structures in retinal vessel network,” in Proc. SPIE Med. Imag., Comput.-Aided Diagnosis, vol. 7963, 2011, Paper 79630I. [Google Scholar]
- [22].Hu Q et al. , “Automated construction of arterial and venous trees in retinal images,” J. Med. Imag, vol. 2, no. 4, pp. 044 001-1-044 001-16, 2015. [DOI] [PMC free article] [PubMed] [Google Scholar]
- [23].Soares J et al. , “Retinal vessel segmentation using the 2-D Gabor wavelet and supervised classification,” IEEE Trans. Med. Imag, vol. 25, no. 9, pp. 1214–1222, September 2006. [DOI] [PubMed] [Google Scholar]
- [24].Favali M et al. , “Analysis of vessel connectivities in retinal images by cartically inspired spectral clustering,” J. Math. Imag. Vis, vol. 56, no. 1, pp. 158–172,2016. [Google Scholar]
- [25].Joshi VS et al. , “Identification and reconnection of interrupted vessels in retinal vessel segmentation,” in Proc. IEEE Int. Symp. Biomed. Imag, 2011, pp. 1416–1420. [Google Scholar]
- [26].Mumford D, “Elastica and computer vision,” inAlgebraic Geometry and Its Applications. New York, NY, USA: Springer-Verlag, 1994, pp. 491–506. [Google Scholar]
- [27].Williams LR and Jacobs DW, “Stochastic completion fields: A neural model of illusory contour shape and salience,” Neural Comput, vol. 9, no. 4, pp. 837–858,1997. [DOI] [PubMed] [Google Scholar]
- [28].Citti G. and Sarti A, “A cortical based model of perceptual completion in the roto-translation space,” J. Math. Imag. Vis, vol. 24, no. 3, pp. 307–326, 2006. [Google Scholar]
- [29].Duits R and Van Almsick M, “The explicit solutions of linear left-invariant second order stochastic evolution equations on the 2D Euclidean motion group,” Quert. Appl. Math, vol. 66, pp. 27–67, 2008. [Google Scholar]
- [30].Zhang J et al. , “Numerical approaches for linear left-invariant diffusions on SE(2), their comparison to exact solutions, and their applications in retinal imaging,” Numer. Math. Theor. Methods Appl, vol. 9, no. 1, pp. 1–50, 2016. [Google Scholar]
- [31].Koffka K, Principles of Gestalt Psychology. Abingdon, U.K.: Routledge & Kegan Paul, 1935. [Google Scholar]
- [32].Wertheimer M, “Laws of organization in perceptual forms,” pp. 71–88, 1938. [Google Scholar]
- [33].Parent P and Zucker SW, “Trace inference, curvature consistency, and curve detection,” IEEE Trans. Pattern Anal. Mach. Intell, vol. 11, no. 8, pp. 823–839, August 1989. [Google Scholar]
- [34].August J and Zucker SW, “Sketches with curvature: The curve indicator random field and Markov processes,” IEEE Trans. Pattern Anal. Mach. Intell, vol. 25, no. 4, pp. 387–400, April 2003. [Google Scholar]
- [35].Petitot J, Neurogeometrie de la Vision: Modeles Mathematiques et Physiques des Architectures Fonctionnelles. Palaiseau, France: Ecole Polytechnique, 2008. [Google Scholar]
- [36].Ben-Yosef G and Ben-Shahar O, “A tangent bundle theory for visual curve completion,” IEEE Trans. Pattern Anal. Mach. Intell, vol. 34, no. 7, pp. 1263–1280, July 2012. [DOI] [PubMed] [Google Scholar]
- [37].Barbieri D et al. , “A cortical-inspired geometry for contour perception and motion integration,” J. Math. Imag. Vis, vol. 49, no. 3, pp. 511–529, 2014. [Google Scholar]
- [38].Duits R et al. , “Image analysis and reconstruction using a wavelet transform constructed from a reducible representation of the Euclidean motion group,” Int. J. Comput. Vis, vol. 72, no. 1, pp. 79–102, 2007. [Google Scholar]
- [39].Bosking WH et al. , “Orientation selectivity and the arrangement of horizontal connections in tree shrew striate cortex,” J. Neurosci, vol. 17, no. 6,pp. 2112–2127,1997. [DOI] [PMC free article] [PubMed] [Google Scholar]
- [40].Boscain U et al. , “Hypoelliptic diffusion and human vision: A semidiscrete new twist on the Petitot theory,” SIAM J. Imag. Sci, vol. 7, no. 2, pp. 669–695,2014. [Google Scholar]
- [41].Jiang etal Y., “Vessel connectivity using Murray’s hypothesis,” in Proc. Int. Conf. Med. Image Comput. Comput.-Assisted Intervention, 2011, pp. 528–536. [DOI] [PMC free article] [PubMed] [Google Scholar]
- [42].Forkert N et al. , “Automatic correction of gaps in cerebrovascular seg-mentations extracted from 3D time-of-flight MRA datasets,” Methods Inf. Med, vol. 51, no. 5, pp. 415–422,2012. [DOI] [PubMed] [Google Scholar]
- [43].Staal J et al. , “Ridge-based vessel segmentation in color images of the retina,” IEEE Trans. Med Imag, vol. 23, no. 4, pp. 501–509, April 2004. [DOI] [PubMed] [Google Scholar]
- [44].“IOSTAR dataset,” 2015. [Online]. Available: www.retinacheck.org
- [45].Odstrcilik J et al. , “Retinal vessel segmentation by improved matched filtering: Evaluation on a new high-resolution fundus image database,” IET Image Process., vol. 7, no. 4, pp. 373–383, June 2013. [Google Scholar]
- [46].Abbasi-Sureshjani S et al. , “Automatic detection of vascular bifurcations and crossings in retinal images using orientation scores,” in Proc. 2016 IEEE 13th Int. Symp. Biomed. Imag, 2016, pp. 189–192. [Google Scholar]
- [47].Abbasi-Sureshjani etal S., “Biologically-inspired supervised vasculature segmentation in SLO retinal fundus images,” in Proc. Int. Conf. Image Anal. Recognit, 2015, pp. 325–334. [Google Scholar]


