Abstract
PSMD10Gankyrin, a proteasome assembly chaperone, is a widely known oncoprotein which aspects many hall mark properties of cancer. However, except proteasome assembly chaperon function its role in normal cell function remains unknown. To address this issue, we induced PSMD10Gankyrin overexpression in HEK293 cells and the resultant large-scale changes in gene expression profile were analyzed. We constituted networks from microarray data of these differentially expressed genes and carried out extensive topological analyses. The overrecurring yet consistent theme that appeared throughout analysis using varied network metrics is that all genes and interactions identified as important would be involved in neurogenesis and neuronal development. Intrigued we tested the possibility that PSMD10Gankyrin may be strongly associated with cell fate decisions that commit neural stem cells to differentiate into neurons. Overexpression of PSMD10Gankyrin in human neural progenitor cells facilitated neuronal differentiation via β-catenin Ngn1 pathway. Here for the first time we provide preliminary and yet compelling experimental evidence for the involvement of a potential oncoprotein – PSMD10Gankyrin, in neuronal differentiation.
Keywords: Gankyrin, Human neural progenitor cells, Microarray, Neurogenesis, Proteasome, PSMD10
Introduction
PSMD10, also called Gankyrin (PSMD10Gankyrin), is a well-established proteasome assembly chaperone and an oncoprotein. Initially identified as p28 component (Nas6/ PSMD10) of 19S regulatory subunit of the 26S proteasome (1), PSMD10 later gained importance for its tumorigenic potential in many cancers by regulating multiple signaling pathways (2, 3). From a structural perspective PSMD10Gankyrin belongs to ankyrin repeat family proteins, well-known for their role as mediators of protein-protein interactions that regulate numerous physiological processes (4, 5). Most importantly PSMD10Gankyrin acts as a dual-negative regulator of both pRb and P53 tumor suppressor pathways, by modulating their ubiquitin mediated proteasomal degradation via specific protein-protein interactions (6, 7).
The well-established association of PSMD10Gankyrin with various cancers overshadows its role in normal cells. As a 19S assembly chaperone, PSMD10Gankyrin is central to the building of the base complex and aids in its association with the 20S core particles (8). Ability of PSMD10Gankyrin to retain NF-κ B in the cytoplasm (9) and regulate its transcriptional activity at the basal level, may be a critical checkpoint in normal cells. PSMD10Gankyrin enhances the transcriptional activity of β-catenin/TCF3 complex (10) that drives Wnt signaling, a major player in cellular differentiation process. Our recent study reported number of proteins that interact with endogenous PSMD10Gankyrin in mammalian cells (11). PSMD10Gankyrin interactions with Hsp70 and Hsp90 chaperones that help in the turnover of proteins may be critical during heat shock response or ER stress. These limited and yet important interactions bring forth the role of PSMD10Gankyrin in cellular homeostasis.
To obtain deeper insights on the biological role of PSMD10Gankyrin, we generated microarray gene expression profiles by overexpressing PSMD10Gankyrin in HEK293 cells used as a model system in our previous studies. The data were analyzed using a combination of topological investigation of networks, gene-set enrichment and pathway analysis. This strategy led us to a remarkable prediction, namely – the potential involvement of PSMD10Gankyrin in the biogenesis of neurons and neuronal functions. Although such networks can have wider biological implications, this analysis focused our attention on a human neural progenitor cells (hNPCs) model system for differentiation. Here we provide preliminary and yet compelling evidence for the role of PSMD10Gankyrin in neurogenesis. We show that both the mRNA and protein levels of PSMD10Gankyrin increase in differentiated cells compared to the hNPCs. This increase in PSMD10Gankyrin parallel the time-dependent increase in β-tubulin, a marker of the differentiated neurons. Overexpression of PSMD10Gankyrin in hNPCs cell line induces the expression of Ngn1 and alters the ratio of neurons to astrocytes favoring the process of neurogenesis.
Materials and Methods
Plasmids and cloning
PSMD10Gankyrin gene was cloned in pCMV10-3XFlag vector to generate stable cell-line in HEK293 cells. PSMD10Gankyrin with N-term 3XFlag tag was cloned into AgeI and EcoRI sites of pTRIPZ vector under minimal CMV promotor with a KOZAC sequence (CGCCACCATG) replacing the RFP gene from the vector. PAX2 and pMD2G packaging vectors were used for virus production.
Cell culture, generation of stable cells and transduction
HEK293 and HEK293-FT cells were grown in DMEM with 10%FBS supplement, 5% CO2 at 37°C. Stable cells for PSMD10Gankyrin overexpression were generated by transfecting HEK293 cells with pCMV10-3XFlag- PSMD10Gankyrin construct and selected with (800 μg/mL) G418 (Sigma). For PSMD10Gankyrin silencing HEK293 cells were transfected with siRNA using Lipofectamine RNAiMax (Invitrogen) and incubated for 48 hrs. Human Neural progenitor cells (ReNcell VM, purchased from Millipore) were grown on laminin (10 μg/mL: Sigma) coated plates or cover slips in Neural Stem Cells maintenance media (Millipore) supplemented with EGF and FGF (20 ng/mL each: Sigma). hNPCs grow rapidly as a monolayer on laminin with a doubling time of 20~30 hours (Supplementary Fig. S1). For differentiation studies cells were differentiated into astrocytes, oligodendrocytes and neurons (Supplementary Fig. S1B~E) in 10~14 days of incubation period by withdrawing EGF and FGF as per the manufacturers protocol (Millipore). hNPCs were transduced with high titer lentiviral particles along with polybrene for 3XFlag-PSMD10Gankyrin overexpression (More details in Supplementary Methods).
Microarray and data analysis
RNA was isolated from ~1×10⁶ HEK293 stable clone cells overexpressing PSMD10Gankyrin and the Vector Control HEK293 clone by the TRiZol (Invitrogen) method following manufacturers protocol. The isolated RNA was outsourced to Genotypic Technology (Bangalore, India). After their quality control report, cDNA was prepared inhouse and was later analyzed by microarray using the the Agilent platform. The data were analyzed using Agilent expression reference guide. Network reconstruction and extensive topological analysis of networks were carried out using various bioinformatics tools (More details in Supplementary Methods).
Semi quantitative and real-time PCR
mRNA from PSMD10Gankyrin stable cells, control HEK293 cells, hNPCs (UD) and Differentiated (DF) cells were isolated by TRiZol (Invitrogen) reagent and cDNA were prepared using Reverse transcriptase (Invitrogen) PCR. Semi-Q PCR and Real time PCR were carried out for target genes using different PCR primers (Supplementary information).
Western blot and antibodies
PSMD10Gankyrin stable cells, control HEK293 cells, hNPCs (UD) and Differentiated (DF) cell lysates were prepared with NP-40 lysis buffer (50 mM Tris pH7.4, 150 mM NaCl, 1% NP-40, 1 mM DTT and 1× protease inhibitors) and immunoblotting was performed with different antibodies (Suplementary Materials).
Luciferase assay
PSMD10Gankyrin stable cells, control HEK293 cells were transfected with TopFlash and Renilla constructs at a ratio of 10 : 1 respectively using Fugene-HD (Promega). Cells were incubated for 48 hrs post transfection followed by cell lysis using 1× luciferase passive lysis buffer (Dual luciferase reporter assay, Promega). Firefly and renilla luciferase activity were measured using a plate reader (Cytation 5).
Immunofluoroscence
The UD or DF cells were fixed with 4% PFA for 20 min at RT, permeabilized with 0.3% Triton-X100 containing 5% BSA in 1× PBS for 2 h at RT. Primary antibodies and secondary antibodies were duluted with the blocking solution and incubated for 1 h at RT or ON at 4°C. For nuclear staining cells were treated with 1 μg/mL of DAPI for 60 sec. Images were taken by Laser confocal microscope (Zeiss LSM meta 510).
Densitometric and statistical analysis
Densitometric quantification of scanned western blot images was performed using Mac BioPhotonics ImageJ. Statistical analysis was performed using Graph Pad Prism 5. To evaluate the significance of values obtained, unpaired Student’s t test was performed. p < 0.05 and p > 0.05 are considered as significant and non-significant data respectively. ***represents p-value<0.001 and **represents p-value < 0.01.
Results and Discussion
Network and pathway analysis of microarray genes predicted probable role of PSMD10Gankyrin in neuronal differentiation
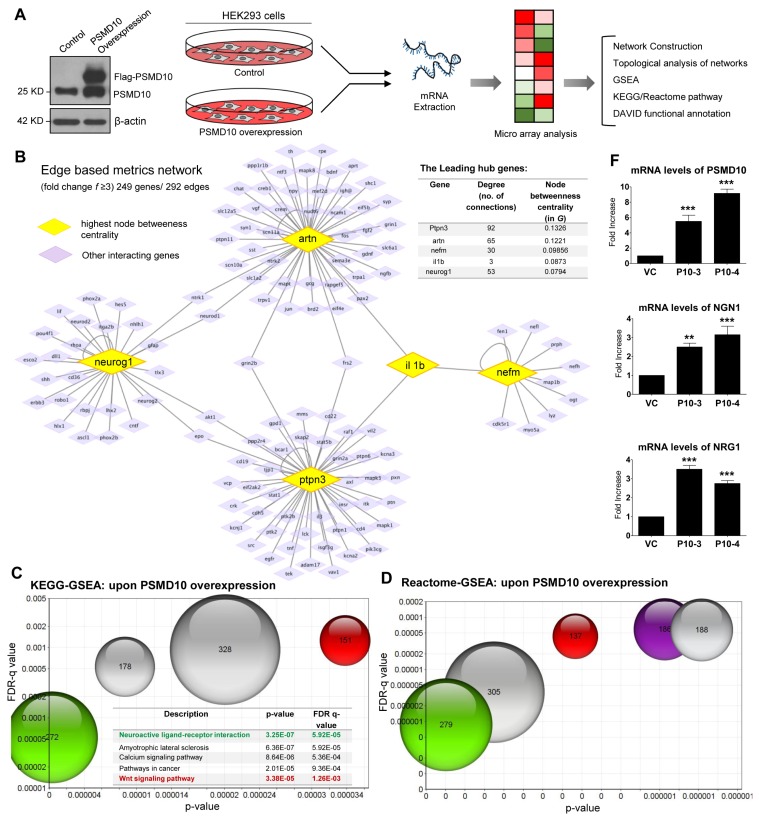
In order to characterize the impact of PSMD10Gankyrin on global gene expression, we carried out a microarray analysis of the total RNA isolated from PSMD10Gankyrin overexpressing HEK293 stable-cells (Fig. 1A) and identified the differentially expressed genes compared to vector control cells. Following an extensive and stringent network reconstruction (Supplementary Methods) we identified 249 genes, 292 edges and 7 hub genes, or the genes whose degree is much higher than the average degree of our network, G (Fig. 1B). The leading genes in G with respective degree mentioned in parenthesis, are: ptpn3 (92), artn (65), neurog1 (53), nefm (30), cebpa (19), galc (9) and tnxb (8). Genes with the highest node betweenness centrality in G are ptpn3 (0.1326), artn (0.1221), nefm (0.09856), il1b (0.0873), neurog1 (0.0794), mapk1 (0.05973), lif (0.0212), akt1 (0.0199) etc. Genes with the highest node closeness centrality in G are: artn (0.2326), il1b (0.2058), bdnf (0.2058), neurog1 (0.1898), ngfb (0.1690). We next turned our attention to edge-based metrics in networks. Edges with the highest values of edge betweenness are (nefm - il1b), (il1b - artn), (mapk1 - nefm), (ptpn3 - mapk1), (lif - artn), (neurog1 - lif) etc. Edges with the highest values of edge proximity (12) consistently have artn, neurog1 and nefm at one of their ends. To extract the biological information from these edges, we used Uniprot to annotate the nodes. This annotation led us to the following biological intuition: the genes and interactions identified as important by various network metrics seem to be involved in neuronal differentiation (Fig. 1B) and therefore we speculated PSMD10Gankyrin could regulate cell fate decisions.
Fig. 1.
Microarray and Network analysis of HEK293 cells upon PSMD10Gankyrin overexpression. (A) Workflow for Microarray and bioinformatics analysis upon PSMD10Gankyrin overexpression in HEK293 cells. The anti-PSMD10Gankyrin WB image shows the expression of Flag-PSMD10Gankyrin and endogenous PSMD10Gankyrin from the lysates of control and overexpressed PSMD10Gankyrin HEK293 cells. (B) Network depicts the role of the top five genes possessing the highest node betweenness centrality (yellow diamond), for overexpressed PSMD10Gankyrin in HEK293 cells. Only interactions of the "other" genes (purple diamond) with these five most "between" genes is shown. Mutual interactions among these "other" genes is excluded. Interestingly, this network shows few "other" genes interacting simultaneously with two "between" genes. Further, none of the "other" genes interacts simultaneously with three of the most "between" genes. The insert table shows the value of degree and Node betweenness centrality for the top five genes. (C) The GSEA set of genes were analyzed in KEGG pathway analysis. The bubble chart depicting the topmost pathways (with highest p-values and FDR q-values) altered upon overexpressed PSMD10Gankyrin. Each bubble represents a pathway with gene number involved and had appeared in the GSEA gene set. In the table the above pathways are represented in the same color as the bubble colors along with the p-value and FDR q-value. (D) The overrepresented genes were queried against the Reactome pathway within GSEA and are depicted in the bubble chart. Five bubbles (starting from “Genes involved in Neuronal System” in the table) depict the pathways with highest p-values and FDR q-values altered upon overexpressed PSMD10Gankyrin. Each bubble represents a pathway with number genes as appeared in the GSEA gene set. The table represents the top 8 pathways with corresponding p-value and FDR q-value highlighting the neuronal pathways in the same color as the bubble color. (E) Table shows the list of top neuron specific genes which are significantly upregulated upon PSMD10Gankyrin overexpression in HEK293 cells as determined by microarray. Overexpression of PSMD10Gankyrin in stable clone as compared to the vector control cells is included as a reference. (F) Bar graphs shows validation of microarray data by real time PCR for Ngn1 and Nrg1 genes. PSMD10Gankyrin levels in stable clone as measured by real time PCR is also shown. Data represents the average fold increase of mRNA levels (normalized with GAPDH) from three independent experiments. The bubble chats were prepared by online tool https://www.onlinecharttool.com.
In an independent approach, the cohort of upregulated genes (1.2 log 2 fold changes and above) were analyzed using various web-based bioinformatics tools: GSEA and DAVID functional annotation (13–15). KEGG and Reactome biological pathway analysis sought out statistically significant top hits (with high p-value & FDR q-value) included developmental process, compartmentalization, signaling and functions involving the neurons (Fig. 1C, 1D, Supplementary Table S1, S2). Although less significant by FDR measures but with a p-value of 0.057, one of the hits annotated within DAVID functional analysis was neurogenesis (Supplementary Table S3, S4). Representative genes with the expression values (fold change ≥3) and having involvement in neuronal biology are included in Fig. 1E. By Real-time PCR we confirmed mRNA levels of Ngn1 (Neurogenin1), Nrg1 (Neuregulin1) along with PSMD10Gankyrin are higher in PSMD10Gankyrin clones than that of vector control cells (Fig. 1F).
PSMD10Gankyrin levels increase during differentiation of hNPCs
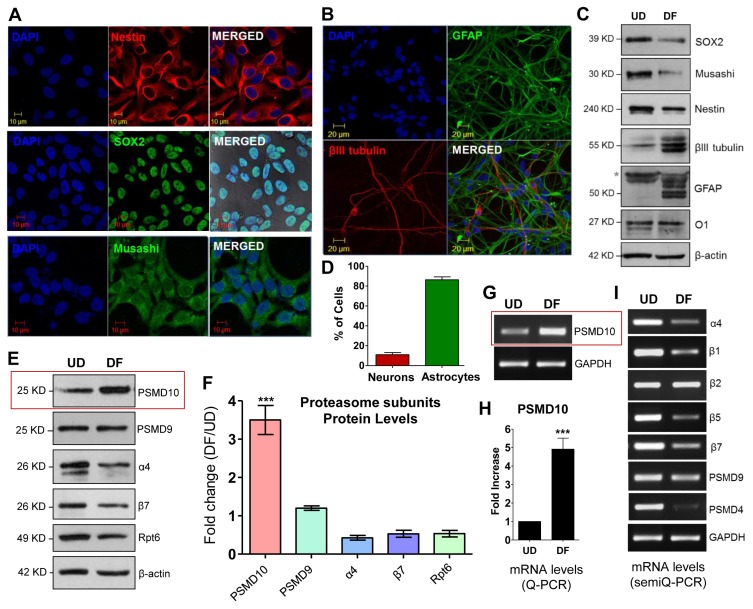
With the above network analyses in place, we infer on the potential role of PSMD10Gankyrin and tested the role of PSMD10 in the differentiation of human neural progenitor cells (hNPCs). First, we checked the differentiating potential of the hNPCs in a monolayer culture (Fig. 2A~C and Supplementary Fig. S2). After 14 days of incubation in media without growth factors (EGF and FGF) the hNPCs differentiated largely to astrocytic cells (~80 to 90%), a small fraction to neurons (~10 to 15%) (Fig. 2D), and the oligodendrocyte cells were sparingly populated (Supplementary Fig. S1A).
Fig. 2.
Differentiated human neural progenitor cells (hNPCs) shows higher expression of PSMD10Gankyrin. (A) Progenitor cells were cultured on laminin coated glass coverslips to ~80% confluence. Immunofluorescence was performed following the protocol described in materials and methods. Cells stained positive for Nestin (in red) Sox2 (in green), Musashi (in green) and DAPI (nuclear stain; in blue). Images were acquired in a Laser confocal microscope (Zeiss LSM meta-510). (B) Progenitor cells were grown as described and differentiated using differentiation media. Media was changed every alternative day. Cultures were processed for further experiments on the 12th day of differentiation. Immunofluorescence was performed following the protocol described in materials and methods. Cells stained for β-III tubulin (in red), and GFAP (in green) indicating the formation of neurons and astrocytes respectively. (C) Cell lysates of hNPCs and differentiated cells were subjected to WB. Image shows the expression of stem cell and differentiation markers in the progenitor cells (UD) and differentiated cells (DF) respectively. (D) The bar graph represents the percentage of neurons and astrocytes differentiated from above experiments (Fig. 2B). Data represents average of the percentage of cells from three independent experiments, each counted from 12 different fields (12×3=36 microscopic fields). (E) WB images of cell lysates of hNPCs and differentiated cells show expression of PSMD10Gankyrin and other proteasomal subunits in the progenitor cells (UD) and differentiated cells (DF). (F) The bar graph represents the quantification of proteasomal subunits protein level expression counted from above experiments (Fig. 2B) in fold change (from three independent experiments with ± SEM) in DF cells compared to UD cells after normalizing with β-actin. (G) Semi-Q PCR gel image shows the mRNA levels of PSMD10Gankyrin in the progenitor cells (UD) and differentiated cells (DF). (H) Graph represents mRNA levels of PSMD10Gankyrin in the progenitor cells (UD) and differentiated cells (DF) measured by the Real-time PCR. Data represents the average fold increase of mRNA levels (normalized with GAPDH) of three independent experiments with ± SEM. (I) Semi-Q PCR gel image shows the mRNA levels of proteasomal subunits in the progenitor cells (UD) and differentiated cells (DF).
We checked PSMD10Gankyrin levels in the undifferentiated progenitor cells (UD) and after 14 days in the terminally differentiated cells (DF). PSMD10Gankyrin protein levels (Fig. 2E, 2F) as well as mRNA levels (Fig. 2G, 2H) are significantly elevated in DF cells as compared to UD cells. In contrast, other proteasome subunits representing each of the sub-complex (α4 and β7 from 20S-CP; Rpt6, an ATPase and PSMD9, a non-ATPase subunit of 19S-RP) either showed a small decrease or remained unaltered in their protein and mRNA levels (Fig. 2E, 2F and 2I). Decreased expression of few proteasome subunits both in protein levels (α4, β7 and Rpt6) and mRNA levels (β1, β5, β7 and PSMD4) may indicate an altered proteasome levels and activity; however, further investigation in the future is needed to understand the significance of these observations.
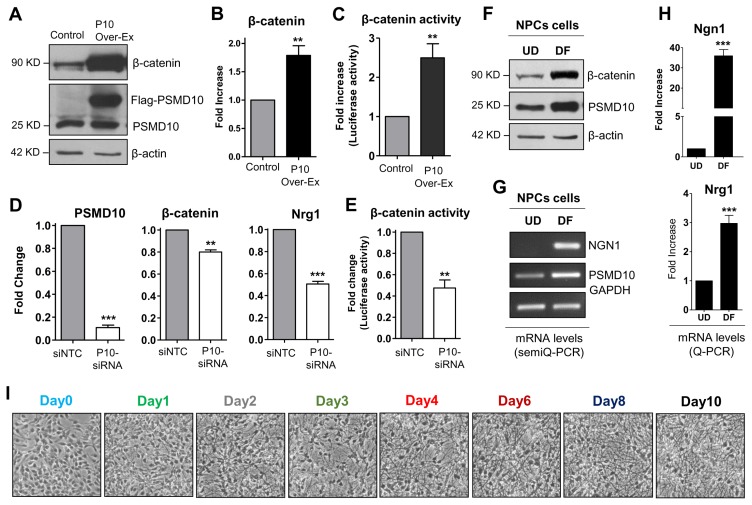
An important outcome of the topological network analyses is that the independent identified nodes are well established for their role in neurogenesis. Among them are Ngn1, a key transcriptional regulator of genes encoding key transcription factors of neurogenesis (16) and β-catenin which directly binds to Ngn1 promotor and regulates its expression during neuronal differentiation of NPC (17). Furthermore, β-catenin and PSMD10Gankyrin mutually regulate expression of each other (10). In support of this, in PSMD10Gankyrin overexpressing HEK293 cells, an increase in β-catenin protein levels (Fig. 3A), mRNA levels (Fig. 3B), and its transcriptional activity (Fig. 3C) were observed. Correspondingly, silencing PSMD10Gankyrin by siRNA reduced the mRNA levels (Fig. 3D) and transcriptional activity (Fig. 3E) of β-catenin. Since hNPCs after differentiation showed higher PSMD10Gankyrin levels, we tested β-catenin levels under undifferentiated (UD) and differentiated conditions (DF). β-catenin protein levels showed a significant increase in the DF cells than in UD cells (Fig. 3F). We also checked the mRNA levels of Ngn1 and Nrg1; both were indeed upregulated in the differentiated populations as compared to undifferentiated hNPCs (Fig. 3G, 3H). Nrg1, one of the upregulated genes in the microarray data, belongs to family of proteins known to induce growth and differentiation of epithelial, glial and neuronal cells (18, 19). Interestingly, Nrg1 was upregulated in PSMD10Gankyrin stable cells (Fig. 1F) and downregulated upon silencing PSMD10Gankyrin in HEK293 cells (Fig. 3D).
Fig. 3.
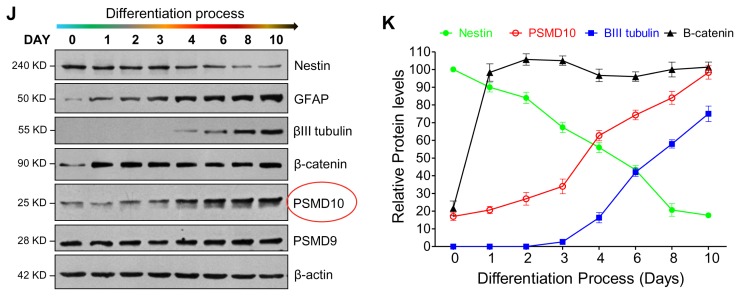
PSMD10Gankyrin expression increases during the hNPCs differentiation process. (A) PSMD10Gankyrin Stable clone (P10 Over-Ex) in HEK293 cells were analyzed for PSMD10Gankyrin and β-catenin protein levels by western blot. (B) The graph shows the real-time PCR analyzed, significant increase in mRNA levels of β-catenin in the PSMD10Gankyrin overexpression clone with the error bar corresponding to the ±SEM of two independent experiments done in duplicates. GAPDH is used as loading control and for normalization. (C) PSMD10Gankyrin Stable clone and control HEK293 cells were transfected with TopFlash and renilla constructs at a ratio of 10 : 1 respectively and were lysed 48 hr post-transfection. Graph shows the average fold increase with ±SEM in β-catenin transcriptional activity normalized with renilla luciferase activity from two independent experiments done in duplicates. (D) HEK293 cells were transfected with PSMD10Gankyrin siRNA/control siRNA and were grown for 48 hr then RNA was isolated. The three graphs show the real-time PCR analyzed significant decrease in mRNA levels of PSMD10Gankyrin, β-catenin and Nrg1 with the error bar corresponding to the ±SEM of duplicate experiments. GAPDH is used as loading control and for normalization. (E) HEK293 cells were transfected with PSMD10Gankyrin siRNA/control siRNA, incubated for 48 hr and then transfected with TopFlash and renilla construct at a ratio of 10 : 1 respectively and were lysed 24 hr post-transfection. Graph shows the average fold change with ±SEM in β-catenin transcriptional activity normalized with renilla luciferase activity from duplicate experiments. (F) Neural Progenitor cells grown on laminin coated plates to ~80% confluence were differentiated as described in Fig. 2 with a minor change; differentiation was stopped at day 10. WB images of cell lysates of hNPCs and differentiated cells show expression of PSMD10Gankyrin and β-catenin in the progenitor cells (UD) and differentiated cells (DF). (G) Semi-Q PCR gel image shows the mRNA levels of PSMD10Gankyrin and Ngn1 in the above mentioned progenitor cells (UD) and differentiated cells (DF). (H) Graphs represents mRNA levels of Ngn1 and Nrg1 in the progenitor cells (UD) and differentiated cells (DF) measured by the Real-time PCR. Data represents the average fold increase of mRNA levels (normalized with GAPDH) of three independent experiments with ±SEM. (I) Phase-contrast images show day wise differentiation status of the hNPCs. (J) Cells at each day of differentiation were collected, lysed and analyzed by western blot using antibodies mentioned in the figure. (K) Line graphs show the expression levels of various proteins from Fig. 3J at each day during the differentiation process. Data represents the average protein levels of two independent (biological repeat) experiments.
To confirm the observed association between PSMD10Gankyrin levels and cell lineage commitment, we monitored PSMD-10Gankyrin expression pattern during the differentiation process. hNPCs were differentiated for 10 days (Fig. 3I) and cell extracts prepared at different days (total of 8 time points) were analyzed by immunoblotting. Nestin levels steadily decreased indicating that hNPCs are now committed to the process of differentiation (20). The differentiation marker GFAP unique to astrocytes detected on the very first day (Day1) of differentiation and continued to increase until the last day (Day10). The neuronal marker β-III tubulin detected at Day-4, increased gradually until Day-10 of the differentiation process (Fig. 3J, 3K). Concurrently, the levels of PSMD10Gankyrin increased linearly until the end of the differentiation process and paralleled the increase in β-III tubulin during the late stage of differentiation. The quantum increase in PSMD10Gankyrin coincident with the quantum increase in βIII-tubulin suggested a profound role for PSMD10Gankyrin in the differentiation of hNPCs to neurons. In addition, the expression of STAT3 and phosphorylation of STAT3 correlate with the expression of PSMD10Gankyrin during the differentiation process until day 6 (Supplementary Fig. S3A, S3B). However, in the terminally differentiated cells the phosphoSTAT3 levels and mRNA levels of STAT3 (Supplementary Fig. S3C, S3D) went down indicating suppression of STAT3 activity. These results together suggest a probable involvement of PSMD10Gankyrin in glial cell lineage during the initial days of differentiation.
PSMD10Gankyrin overexpression enhances neurogenesis in hNPCs
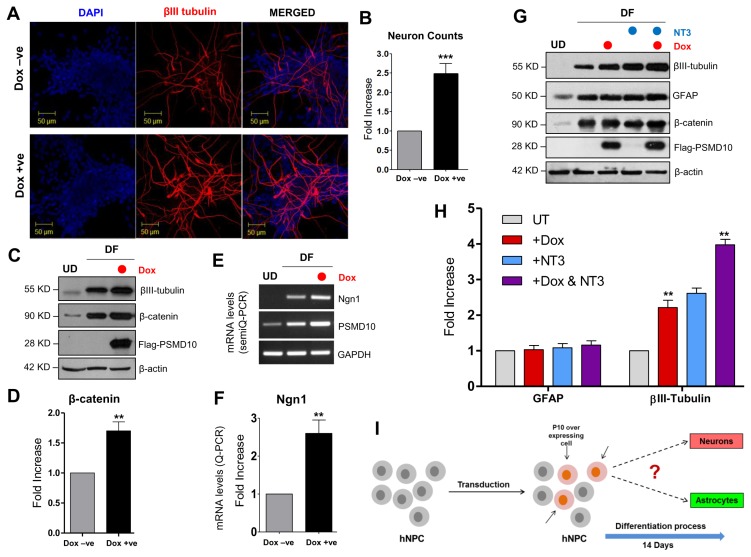
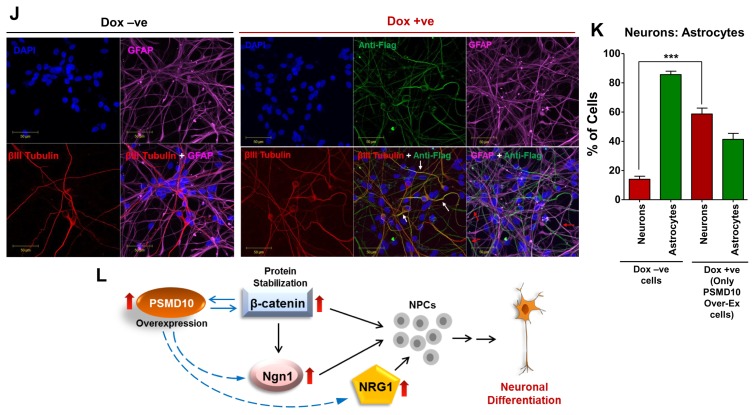
In order to test the aforementioned relationships, we overexpressed doxycycline inducible Flag-PSMD10Gankyrin in hNPCs by viral transduction and checked the induction of β-catenin and Ngn1 and the consequence on cell lineage. Upon Dox-induced PSMD10Gankyrin overexpression in hNPCs and after 12 days differentiation, the neuron count in total differentiated population increased from 10% to ~25% indicating a 2 to 2.5-fold increase in neuronal population (Fig. 4A, 4B). Western blot of the Dox-treated and untreated DF cell lysates showed significant increase in βIII-tubulin (Fig. 4C). Strikingly, both β-catenin and Ngn1 levels increased 2 to 3 fold in the differentiated population when PSMD10Gankyrin was overexpressed (Fig. 4D~F). Furthermore, when PSMD10Gankyrin overexpressing (Dox treated) hNPCs were treated with neurotropin-3 (NT3) they showed higher levels of βIII-tubulin expression than that of the Dox-untreated cells while levels of GFAP remained unaltered (Fig. 4G, 4H). These results are strongly suggestive of the possible functional association between PSMD10Gankyrin and Ngn1 quite likely via β-catenin. PSMD10Gankyrin may be a key player in the network of proteins responsible for neurogenesis.
Fig. 4.
PSMD10Gankyrin overexpression in hNPCs facilitate neuronal differentiation process. hNPCs were grown on laminin coated glass coverslips till they reached ~30% confluency. Then cells were transduced with virus particles carrying pTRIPZ-3XFlag- PSMD10Gankyrin and cells were either treated with doxycycline (1 μg/mL) for 48 hr or left untreated. Once ~80% confluency was reached, media was replaced with fresh differentiation media. Subsequently, differentiation media was replaced every alternate day and contained doxycycline (1 μg/mL) or no doxycycline until the 12th day of differentiation. (A) Cells were immunostained using β-III tubulin antibody (in red) following the protocol described in materials and methods. DAPI (in blue) was used for nuclear staining. (B) The bar graph represents the fold increase in the number of neurons differentiated from hNPCs with/without overexpression of Flag-P10 in the total pool of hNPCs. Data represents average number of cells from two independent experiments (in fold increase) each from 10 different fields (10×2=20 microscopic fields). (C) WB image of the above cells shows levels of β-III tubulin and β-catenin. (D) The bar graph shows the average fold increase with ±SEM in β-catenin protein levels in differentiated hNPCs (DF) treated with/without Doxycycline. β-actin was used as loading control and for normalization. (E) Semi-Q PCR gel image shows the mRNA levels of PSMD10Gankyrin and Ngn1 in the progenitor cells (Dox-ve UD) and differentiated cells (Dox-ve DF & Dox + ve DF). (F) The realtime-PCR bar graph represents the mRNA levels of Ngn1 in the differentiated cells (cont-DF & Flag-P10 DF). Data represents the average fold increase of mRNA levels (normalized with GAPDH) of three independent experiments. (G) hNPCs cells were either treated with Doxycycline and/or 10 ng/mL NT3 or left untreated during the differentiation process (for 10 days) and cell lysates were prepared for WB. Image shows levels of β-III tubulin, β-catenin and FLAG- PSMD10. (H) The bar graph shows the protein level quantification of GFAP and β-III tubulin with average value ±SEM from three different experiments with experimental set-up explained in Panel-I. β-actin was used as loading control and for normalization. (I) Model figure represents the workflow for tracing hNPCs fate after PSMD10Gankyrin overexpression. (J) Immunofluorescence was performed in above cells treated with/without Doxycycline; following the protocol described in materials and methods. In Dox + ve staining, cells (white arrow marked) expressing Flag-PSMD10Gankyrin (green) also stain for β-III tubulin (red). They are GFAP negative (purple). Cells (red arrow marked) expressing Flag-PSMD10Gankyrin (green) also stain for GFAP (purple). (K) Bar graph represents the percentage of neurons and astrocytes differentiated from hNPCs without and with (Dox treatment) overexpression of Flag-PSMD10Gankyrin. For Dox + ve set those cells which expressed Flag-PSMD10Gankyrin were only considered for neuron and astrocyte count. Data represents the average number of cells (in percentage) from three independent experiments, with data collected from 10 fields in each case (10×3=30 microscopic fields). (L) Model figure based on previously reported role of Ngn1 and results from the current study shows the probable role of PSMD10Gankyrin in hNPCs differentiation via β-catenin Ngn1 pathway.
To establish the causal effect of PSMD10Gankyrin in neurogenesis, the hNPCs expressing Flag-PSMD10Gankyrin were analyzed for the composition of the cell types (Fig. 4I). After 12 days of differentiation, immunofluorescence studies indicated that ~60% of Flag-PSMD10Gankyrin expressing cells differentiated into neurons and ~40% Flag-PSMD10Gankyrin expressing cells differentiated into astrocytes (Fig. 4J, 4K). This shift in the ratio of neurons : astrocytes (i.e. from 1 : 9 to 3 : 2) in the untreated cells versus transduced-Dox treated cell population, parallels the overall increase seen in neuron counts upon doxycycline treatment (from 10% to ~25% in Fig. 4A). Significant, but small increase in the overall neuron count may be due to the low transduction efficiency (~20 to 30%, Supplementary Fig. S4). The presence of astrocyte marker in cells that express Flag-PSMD10Gankyrin indicates that PSMD10Gankyrin driven shift in neurogenesis is not absolute which could be due to the following reasons: (1) The current differentiation protocol supports astrocyte formation more than neurons. Therefore, PSMD10Gankyrin overexpression induced signaling events or transcriptional programing may not be enough to execute an exclusive switch to neurogenesis. (2) PSMD10Gankyrin overexpression may trigger “lateral inhibition phenomena” responsible for regulated differentiation of different cell types in a mixed population. (3) PSMD10Gankyrin may favor the formation of both neurons and astrocytes in a spatio-temporal manner. Although less strong than that of βIII-tubulin, correlation between phosphoSTAT3 levels and PSMD10Gankyrin during the early days of differentiation (Supplementary Fig. S3) is suggestive of such a dual role.
The results presented here demonstrate a definite correlation between the levels of PSMD10Gankyrin and the key players such as β-catenin and Ngn1. Microarray analysis of differentially expressed genes induced by PSMD9, a regulator of NF-κB activation (21) did not confer an overwhelming signature for neurogenesis by any of the computational analysis described above (data not shown). In agreement there was no change in the expression of this gene in the course of differentiation of the NPC cells (Fig. 3J). Thus, the gene signature and experimental evidence obtained in the present study is associated specifically with PSMD10Gankyrin. Strengthened by integrated network approach involving topological analysis, gene enrichment and pathway analysis of a microarray data coupled with experimental validation, PSMD10Gankyrin emerges as a new player in cell fate decisions. Here we provide preliminary but compelling evidence for the role of PSMD10Gankyrin in neurogenesis of human neural progenitor cells possibly by stabilizing the β-Catenin and subsequent increase in Ngn1 expression and activity (Fig. 4L).
Supplementary Information
Acknowledgments
ACTREC IRB for initial funding.
Footnotes
Potential Conflict of Interest
The authors have no conflicting financial interest.
Author Contributions
PV, IS and PN conceived and designed the experimental set-up. PN performed initial microarray experiments and stem cell culture. IS and MM designed & performed stem cell differentiation and neurogenesis experiments. SR and PV analyzed microarray data and performed all bioinformatics analysis. SM performed betacatenin activity assays. IS PV and SR wrote the manuscript.
Supplementary Materials
Supplementary data including methods, materials, four tables, and four figures can be found with this article online at http://pdf.medrang.co.kr/paper/pdf/IJSC/IJSC-12-s19007.pdf.
References
- 1.Hori T, Kato S, Saeki M, DeMartino GN, Slaughter CA, Takeuchi J, Toh-e A, Tanaka K. cDNA cloning and functional analysis of p28 (Nas6p) and p40.5 (Nas7p), two novel regulatory subunits of the 26S proteasome. Gene. 1998;216:113–122. doi: 10.1016/S0378-1119(98)00309-6. [DOI] [PubMed] [Google Scholar]
- 2.Wang X, Jiang B, Zhang Y. Gankyrin regulates cell signaling network. Tumour Biol. 2016;37:5675–5682. doi: 10.1007/s13277-016-4854-z. [DOI] [PubMed] [Google Scholar]
- 3.Li H, Zhang J, Zhen C, Yang B, Feng L. Gankyrin as a potential target for tumor therapy: evidence and perspectives. Am J Transl Res. 2018;10:1949–1960. [PMC free article] [PubMed] [Google Scholar]
- 4.Li J, Mahajan A, Tsai MD. Ankyrin repeat: a unique motif mediating protein-protein interactions. Biochemistry. 2006;45:15168–15178. doi: 10.1021/bi062188q. [DOI] [PubMed] [Google Scholar]
- 5.Mosavi LK, Cammett TJ, Desrosiers DC, Peng ZY. The ankyrin repeat as molecular architecture for protein recognition. Protein Sci. 2004;13:1435–1448. doi: 10.1110/ps.03554604. [DOI] [PMC free article] [PubMed] [Google Scholar]
- 6.Dawson S, Higashitsuji H, Wilkinson AJ, Fujita J, Mayer RJ. Gankyrin: a new oncoprotein and regulator of pRb and p53. Trends Cell Biol. 2006;16:229–233. doi: 10.1016/j.tcb.2006.03.001. [DOI] [PubMed] [Google Scholar]
- 7.Higashitsuji H, Liu Y, Mayer RJ, Fujita J. The oncoprotein gankyrin negatively regulates both p53 and RB by enhancing proteasomal degradation. Cell Cycle. 2005;4:1335–1337. doi: 10.4161/cc.4.10.2107. [DOI] [PubMed] [Google Scholar]
- 8.Bedford L, Paine S, Sheppard PW, Mayer RJ, Roelofs J. Assembly, structure, and function of the 26S proteasome. Trends Cell Biol. 2010;20:391–401. doi: 10.1016/j.tcb.2010.03.007. [DOI] [PMC free article] [PubMed] [Google Scholar]
- 9.Chen Y, Li HH, Fu J, Wang XF, Ren YB, Dong LW, Tang SH, Liu SQ, Wu MC, Wang HY. Oncoprotein p28 GANK binds to RelA and retains NF-kappaB in the cytoplasm through nuclear export. Cell Res. 2007;17:1020–1029. doi: 10.1038/cr.2007.99. [DOI] [PubMed] [Google Scholar]
- 10.Dong LW, Yang GZ, Pan YF, Chen Y, Tan YX, Dai RY, Ren YB, Fu J, Wang HY. The oncoprotein p28GANK establishes a positive feedback loop in β-catenin signaling. Cell Res. 2011;21:1248–1261. doi: 10.1038/cr.2011.103. [DOI] [PMC free article] [PubMed] [Google Scholar]
- 11.Nanaware PP, Ramteke MP, Somavarapu AK, Venkatraman P. Discovery of multiple interacting partners of gankyrin, a proteasomal chaperone and an oncoprotein--evidence for a common hot spot site at the interface and its functional relevance. Proteins. 2014;82:1283–1300. doi: 10.1002/prot.24494. [DOI] [PubMed] [Google Scholar]
- 12.Banerjee SJ, Sinha S, Roy S. Slow poisoning and destruction of networks: edge proximity and its implications for biological and infrastructure networks. Phys Rev E Stat Nonlin Soft Matter Phys. 2015;91:022807. doi: 10.1103/PhysRevE.91.022807. [DOI] [PubMed] [Google Scholar]
- 13.Subramanian A, Tamayo P, Mootha VK, Mukherjee S, Ebert BL, Gillette MA, Paulovich A, Pomeroy SL, Golub TR, Lander ES, Mesirov JP. Gene set enrichment analysis: a knowledge-based approach for interpreting genome-wide expression profiles. Proc Natl Acad Sci U S A. 2005;102:15545–15550. doi: 10.1073/pnas.0506580102. [DOI] [PMC free article] [PubMed] [Google Scholar]
- 14.Huang da W, Sherman BT, Lempicki RA. Systematic and integrative analysis of large gene lists using DAVID bioinformatics resources. Nat Protoc. 2009;4:44–57. doi: 10.1038/nprot.2008.211. [DOI] [PubMed] [Google Scholar]
- 15.Huang da W, Sherman BT, Lempicki RA. Bioinformatics enrichment tools: paths toward the comprehensive functional analysis of large gene lists. Nucleic Acids Res. 2009;37:1–13. doi: 10.1093/nar/gkn923. [DOI] [PMC free article] [PubMed] [Google Scholar]
- 16.Sun Y, Nadal-Vicens M, Misono S, Lin MZ, Zubiaga A, Hua X, Fan G, Greenberg ME. Neurogenin promotes neurogenesis and inhibits glial differentiation by independent mechanisms. Cell. 2001;104:365–376. doi: 10.1016/S0092-8674(01)00224-0. [DOI] [PubMed] [Google Scholar]
- 17.Hirabayashi Y, Itoh Y, Tabata H, Nakajima K, Akiyama T, Masuyama N, Gotoh Y. The Wnt/beta-catenin pathway directs neuronal differentiation of cortical neural precursor cells. Development. 2004;131:2791–2801. doi: 10.1242/dev.01165. [DOI] [PubMed] [Google Scholar]
- 18.Sato T, Sato F, Kamezaki A, Sakaguchi K, Tanigome R, Kawakami K, Sehara-Fujisawa A. Neuregulin 1 type II-ErbB signaling promotes cell divisions generating neurons from neural progenitor cells in the developing zebrafish brain. PLoS One. 2015;10:e0127360. doi: 10.1371/journal.pone.0127360. [DOI] [PMC free article] [PubMed] [Google Scholar]
- 19.Gambarotta G, Fregnan F, Gnavi S, Perroteau I. Neuregulin 1 role in Schwann cell regulation and potential applications to promote peripheral nerve regeneration. Int Rev Neurobiol. 2013;108:223–256. doi: 10.1016/B978-0-12-410499-0.00009-5. [DOI] [PubMed] [Google Scholar]
- 20.Mellodew K, Suhr R, Uwanogho DA, Reuter I, Lendahl U, Hodges H, Price J. Nestin expression is lost in a neural stem cell line through a mechanism involving the proteasome and Notch signalling. Brain Res Dev Brain Res. 2004;151:13–23. doi: 10.1016/j.devbrainres.2004.03.018. [DOI] [PubMed] [Google Scholar]
- 21.Sahu I, Sangith N, Ramteke M, Gadre R, Venkatraman P. A novel role for the proteasomal chaperone PSMD9 and hnRNPA1 in enhancing IκBα degradation and NF-κB activation - functional relevance of predicted PDZ domain-motif interaction. FEBS J. 2014;281:2688–2709. doi: 10.1111/febs.12814. [DOI] [PubMed] [Google Scholar]
Associated Data
This section collects any data citations, data availability statements, or supplementary materials included in this article.


