Abstract
To maintain prolonged infection of mammals, African trypanosomes have evolved remarkable surface coats and a system of antigenic variation1. Within these coats are receptors for macromolecular nutrients such as transferrin2,3. These must be accessible to their ligands but must not confer susceptibility to immunoglobulin-mediated attack. Trypanosomes have a wide host range and their receptors must also bind ligands from diverse species. To understand how these requirements are achieved, in the context of transferrin uptake, we determined the structure of a Trypanosoma brucei transferrin receptor in complex with human transferrin, showing how this heterodimeric receptor presents a large asymmetric ligand-binding platform. The trypanosome genome contains a family of around fourteen transferrin receptors4, which has been proposed to allow binding to transferrin from different mammalian hosts5,6. However, we find that a single receptor can bind transferrin from a broad range of mammals, indicating that receptor variation is unlikely to be necessary for promiscuity of host infection. In contrast, polymorphic sites and N-linked glycans are preferentially found in exposed positions on the receptor surface, not contacting transferrin, suggesting that transferrin receptor diversification is driven by a need for antigenic variation in the receptor to prolonged survival in a host.
Iron is essential for numerous cellular processes, including oxygen and electron transport. In mammals, iron is transported within serum and tissue fluids while bound to a transport protein, transferrin7, facilitating iron distribution while preventing toxic effects of free iron ions. Transferrin has two lobes, each binding a single Fe3+ ion8. These lobes adopt ‘open’ iron-free conformations in apo-transferrin9, or ‘closed’ iron-bound conformations in holo-transferrin10. Changes in pH and transferrin receptor binding11,12 each induce changes in transferrin conformation, modulating iron binding and release.
Acquisition of iron by mammalian cells requires a transferrin receptor7,8. The receptor-transferrin complex is endocytosed and trafficked to an endosomal compartment. Here, acidification and receptor binding combine to induce a change in transferrin conformation from holo- to apo-, releasing iron. The receptor-transferrin complex is then recycled to the plasma membrane, where increased pH causes release of apo-transferrin, freeing the receptor for further uptake cycles12,13.
Many pathogens scavenge iron from their mammalian hosts through uptake of transferrin. Bacterial pathogens have the challenge of inducing iron release from transferrin without involvement of an acidic endocytic compartment. In Neisseria, this is mediated by transferrin receptors on the outer membrane that bind holo-transferrin and induce release of iron at neutral pH14,15. In contrast, African trypanosomes, such as Trypanosoma brucei, are eukaryotic pathogens with an active endocytic system. They express transferrin receptors which are endocytosed to carry iron-loaded transferrin into endocytic compartments2,3,16,17. How the receptor binds transferrin and the effect of pH changes in mediating iron and transferrin release are uncertain.
The trypanosome transferrin receptors show no sequence similarity to mammalian transferrin receptors. Instead, they are heterodimers of related proteins ESAG6 and ESAG7, attached to cell membranes by a single glycosylphosphatidyl (GPI) anchor on ESAG6. Both subunits are predicted to share a similar fold with variant surface glycoproteins (VSGs), which coat trypanosome surfaces2,16–18. Transferrin receptors must recognise their ligand in the context of this densely packed VSG coat and be endocytosed in vesicles which bud from the flagellar pocket3. Immunoglobulins access both trypanosome cell surface and flagellar pocket19, raising the question of how transferrin receptors avoid detection.
The Trypanosoma brucei genome contains a family of transferrin receptors, with fourteen identified in the Lister 427 isolate4, although only one is expressed at a time. The receptors vary in sequence and growth in culture containing sera from different species has been shown to select for expression of different receptors5,6. This suggested a model in which variation in receptor sequence was proposed to allow uptake of transferrin from different mammals, thereby enabling host promiscuity5,6,20. Here, we used structural and biophysical analyses to investigate how trypanosome transferrin receptors bind transferrin, to determine their role in facilitating iron release and to investigate how polymorphisms affect species specificity and immune recognition.
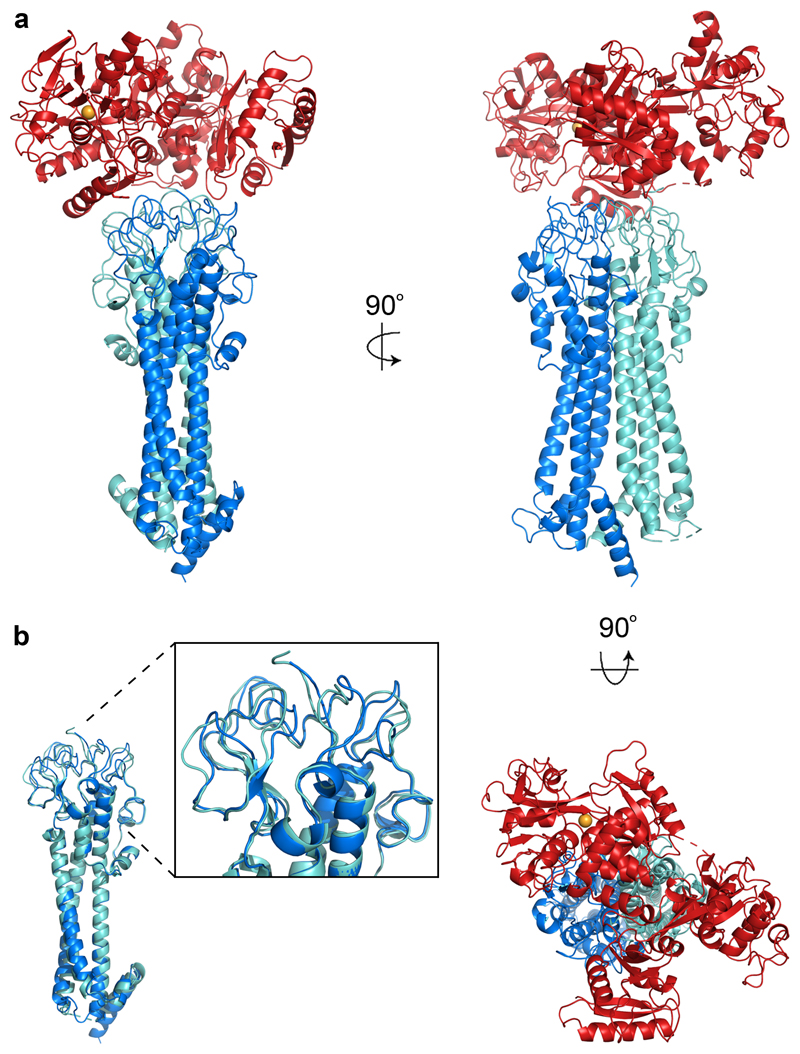
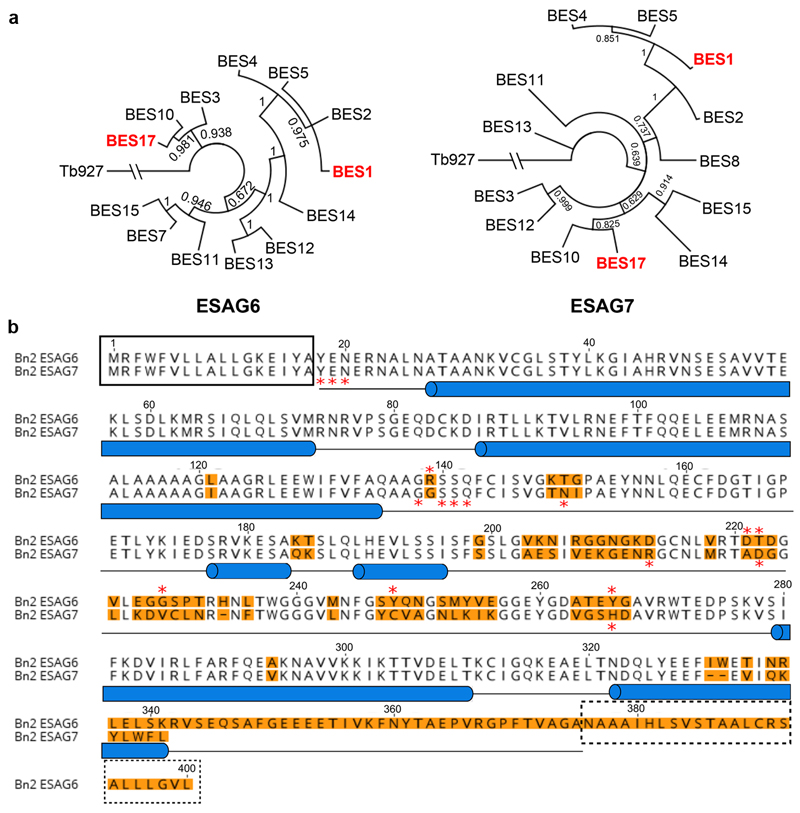
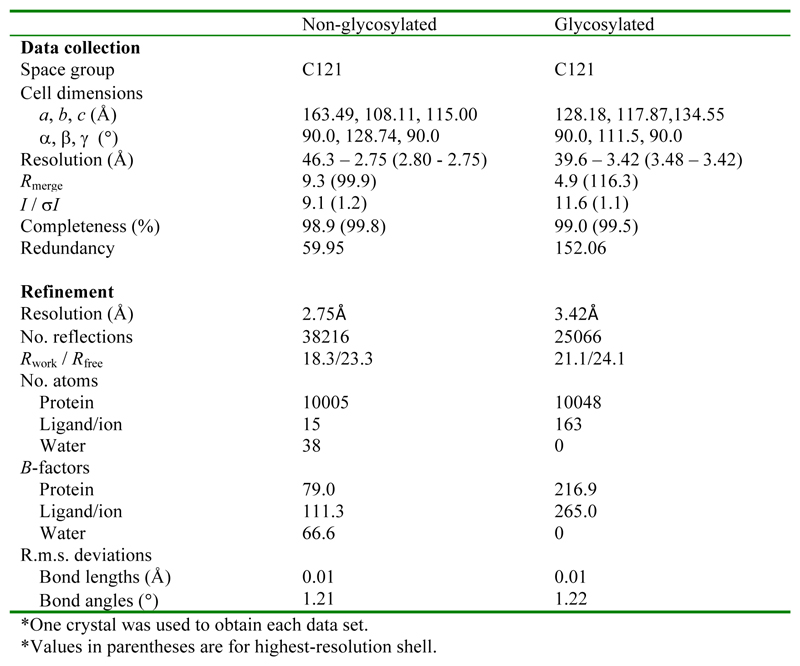
Phylogenetic analysis of ESAG6 and ESAG7 sequences separates the receptors into groups, with BES1 and BES17 distant in the phylogenetic trees (Extended Data Figure 1a). Crystals of BES17 transferrin receptor bound to human transferrin formed and diffracted to 3.42Å resolution. Further crystals were obtained using a variant of BES17 in which the eight N-linked glycosylation sites were mutated. These diffracted to 2.75Å resolution, allowing structure determination by molecular replacement (Figure 1a, Extended Data Figure 1b, Extended Data Figure 2).
Figure 1. The structure of the trypanosome transferrin receptor.
a. The structure of the trypanosome transferrin receptor heterodimer (ESAG6 in dark blue and ESAG7 in light blue) bound to human transferrin (red). The iron ion is shown as an orange sphere. b. An alignment of ESAG and ESAG7 showing the divergence of the membrane-distal loops to create an asymmetric binding site for transferrin.
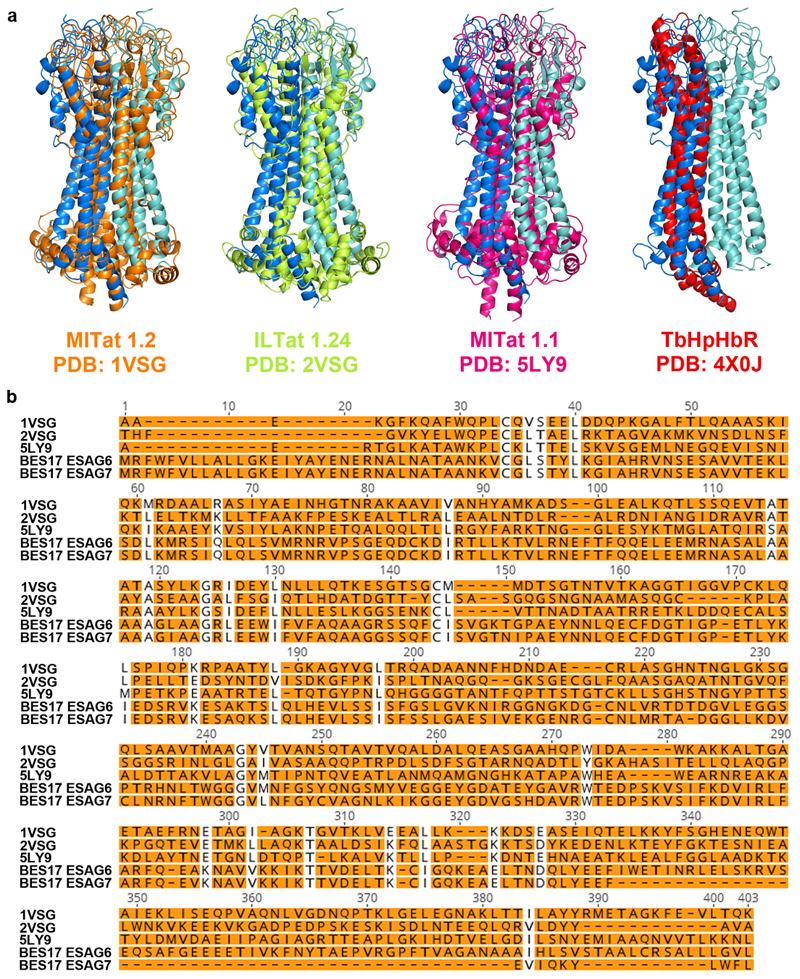
The structure reveals an elongated heterodimer of ESAG6 and ESAG7, each containing three long α-helices (Figure 1). The N-terminal two helices map closely onto the corresponding long helices of the VSGs, while a third helix strengthens the fold (Extended Data Figure 3). At the membrane-proximal side, each subunit contains a short α-helix that forms a wedge between the two subunits of the heterodimer. Thirty residues at the C-terminal end of ESAG6 were not resolved and mostly likely form a flexible polypeptide linking the receptor to the C-terminal GPI-anchor. The membrane-distal surface of each subunit lacks secondary structure and is formed of a complex array of intertwined loops. As ESAG6 and ESAG7 have 80% sequence identity, it is unsurprising that they share similar folds (Figure 1b). However, the membrane distal loops adopt different conformations, allowing both subunits to contribute to an asymmetric binding site for a single transferrin molecule. The extensive dimerization interface between the two subunits is stabilised by a network of hydrogen bonds and subtle differences in loop conformations towards the membrane distal end of each subunit are likely to favour formation of productive heterodimers rather than homodimers.
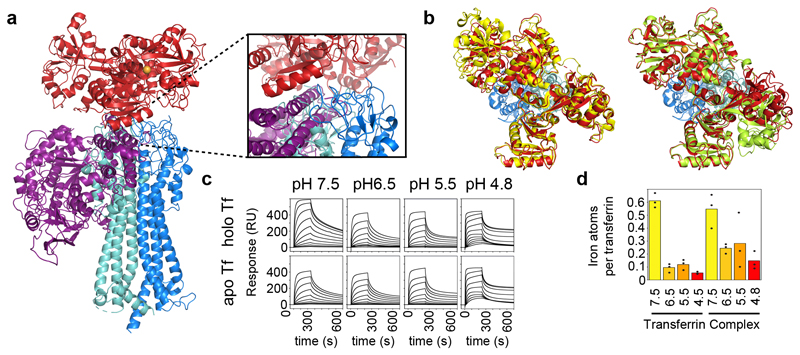
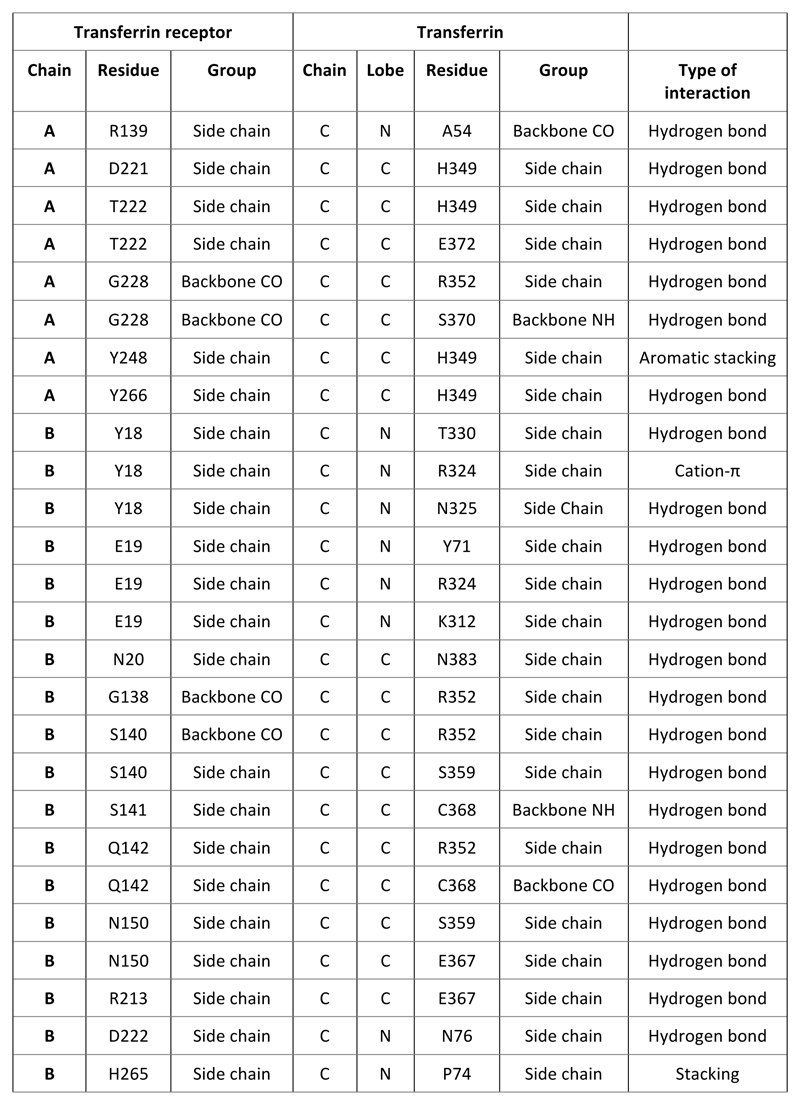
The receptor fits into a cleft in transferrin, making contacts primarily with the N-terminal domain of the N- and C-lobes, with the most extensive interface involving the C-lobe. (Figure 1, Extended Data Figure 4, Extended Data Figure 5). A structural comparison reveals that human12,21 and trypanosome receptors use entirely different structural features to bind a similar surface of transferrin (Figure 2a). This may reduce the likelihood of transferrin escape mutants which prevent uptake into trypanosomes. When bound to the trypanosome receptor, the N-lobe of transferrin is in the open apo-conformation while the C-lobe is in the closed holo-conformation, and electron density likely to be Fe3+ was found only in the C-lobe (Figure 2b). This is in contrast to serum transferrin, in which both lobes are partially occupied by iron10,22.
Figure 2. The role of the trypanosome transferrin receptor in pH-dependent binding and iron release.
a. Structures of complexes of the trypanosome and human transferrin receptors bound to transferrin were aligned on the transferrin component. Transferrin is red, the trypanosome transferrin receptor heterodimer is blue (ESAG6 in dark blue and ESAG7 in light blue) and the human transferrin receptor is purple. b. Alignment of transferrin (red) bound to the trypanosome transferrin receptor (blue) with apo-transferrin (yellow; PDB:2HAV) and holo-transferrin (green; PDB:3V83). This shows that, when bound to the trypanosome transferrin receptor, the N-lobe of transferrin is in the apo conformation while the C-lobe is in the holo, iron-bound conformation. c. Analysis by surface plasmon resonance of binding to human transferrin by the trypanosome transferrin receptor at different pH values. Each concentration series was performed once. d. Analysis by μPIXE of the amount of iron bound to transferrin or transferrin in complex with the trypanosome transferrin receptor at different pH values. Data points represent technical replicates (n=3) while bars represent the mean.
Binding of human transferrin receptor to transferrin varies as they experience pH changes during progression through the endosomal system8. The receptor binds to holo-transferrin at neutral pH, induces iron release as the pH reduces and releases apo-transferrin on its return to neutral pH, recycling both receptor and transferrin8. As the trypanosome receptor binds to a similar site on transferrin, we investigated whether the complex responds to pH changes in a similar way. In particular, we aimed to determine whether the receptor stimulates iron release, as our structure, determined from crystals grown at pH 6.5, showed an empty N-lobe and an iron bound C-lobe (Figure 2b). This led us to ask whether this state is due to a low pH or due to the presence of the receptor. We first determined apo- and holo-transferrin affinities at four different pH values (Figure 2c, Extended Data Figure 6). Binding of apo-transferrin was unaltered by pH change. In contrast, holo-transferrin bound most tightly at pH 7.5, while at pH 6.5, or lower, it had an affinity close to that of apo-transferrin. Compared with human transferrin receptor, binding of trypanosome receptor to transferrin is relatively independent of iron status or pH.
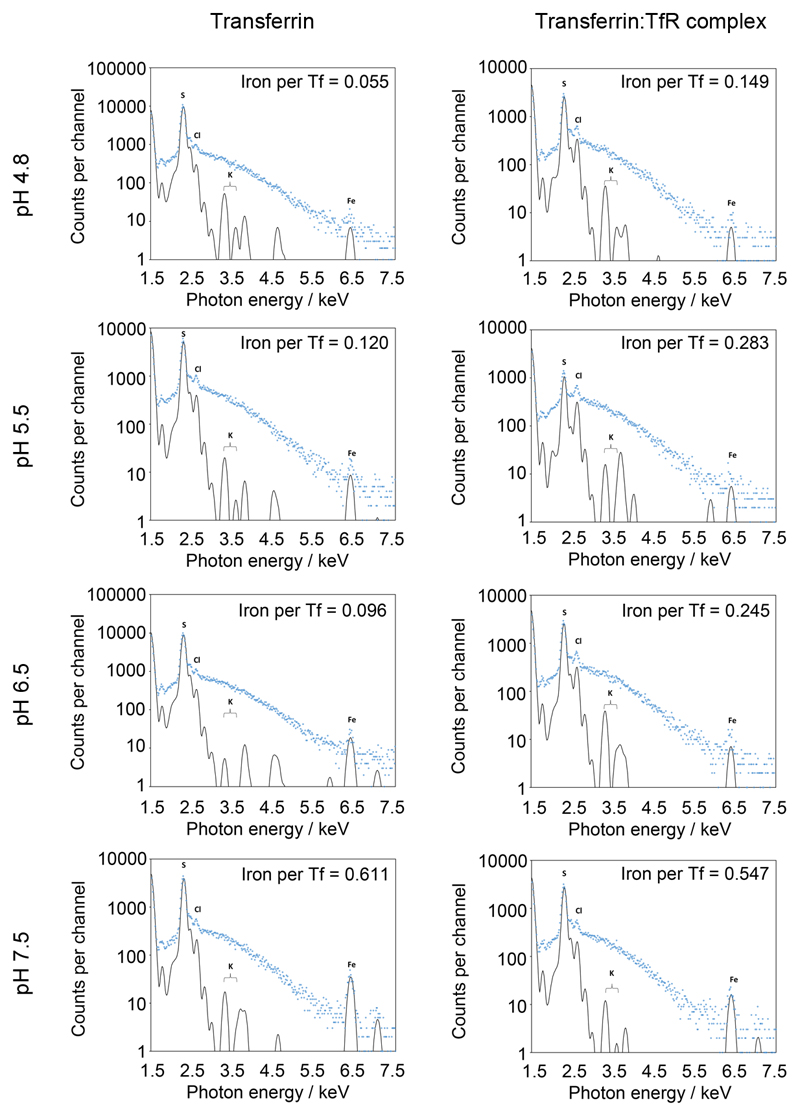
We next used microbeam particle induced x-ray emission (μPIXE) to assess the amount of iron that remains bound to transferrin at four different pH values, either alone or bound to the receptor (Figure 2d, Extended Data Figure 7). Determination of the number of iron atoms relative to the number of sulphur atoms allowed calculation of the amount of iron per transferrin. At pH 7.5, either in the presence or absence of receptor, there were ~0.6 irons per transferrin, consistent with previous analysis of serum transferrin7,22. Free transferrin contained little iron at pH 6.5 or below. In contrast, transferrin in complex with the trypanosome transferrin receptor retained around half of the bound iron at pH 6.5 and 5.5, consistent with the presence of iron in receptor bound transferrin at pH 6.5. This suggests that, rather than inducing iron release on acidification, the trypanosome transferrin receptor reduces release. Coupled with the retention of apo-transferrin binding at neutral pH, this makes it likely that, far from recycling transferrin, the trypanosome receptor maintains binding. Any remaining iron may then be released as a result of transferrin degradation in the lysosome.
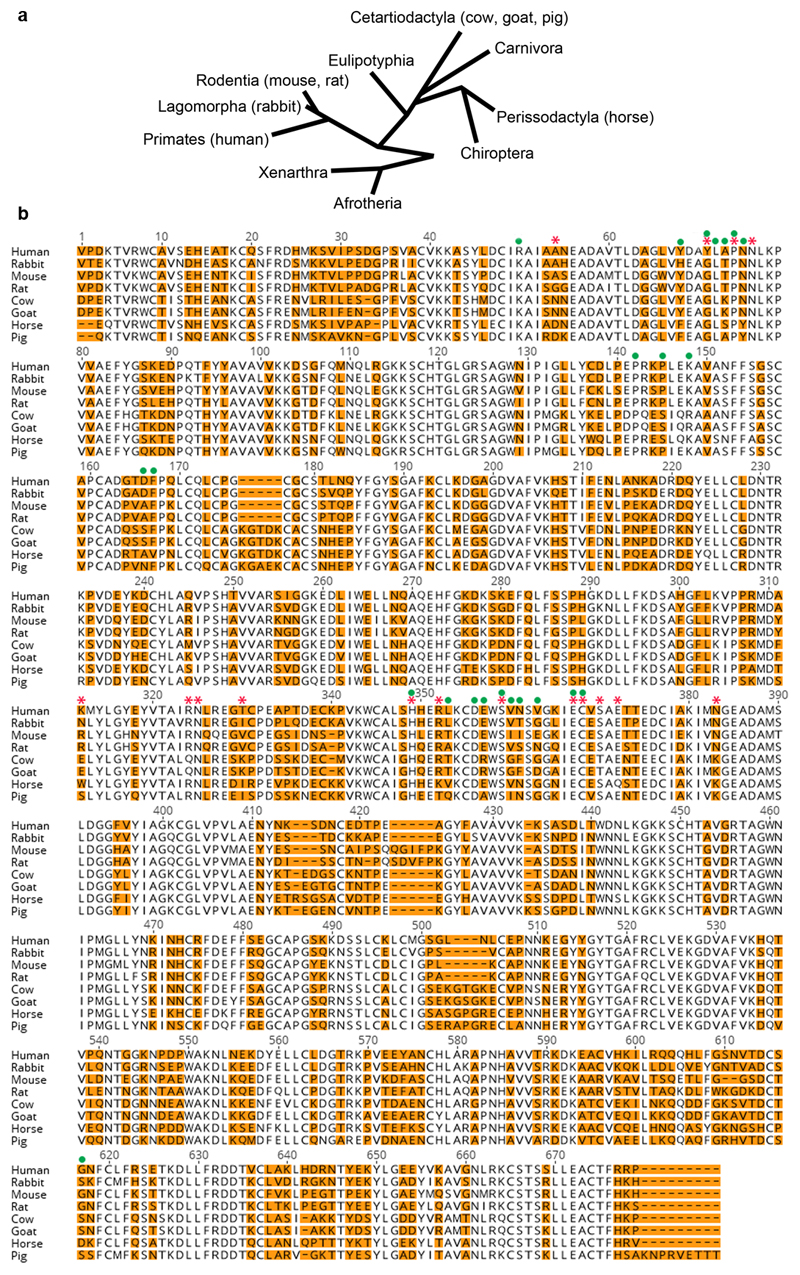
African trypanosomes contain multiple transferrin receptors, with around fourteen in the Lister 427 genome4. This contrasts with other receptors, such as the single copy haptoglobin-haemoglobin receptor23. It has been proposed that diversity in transferrin receptors accommodates differences in transferrin sequences, allowing trypanosomes to infect a wide range of mammals5,6. To test this, we studied binding of BES1 and BES17 receptors (Extended Data Figure 8) to transferrin from eight different mammalian species, representing a spectrum of the mammalian evolutionary tree (Extended Data Figure 4).
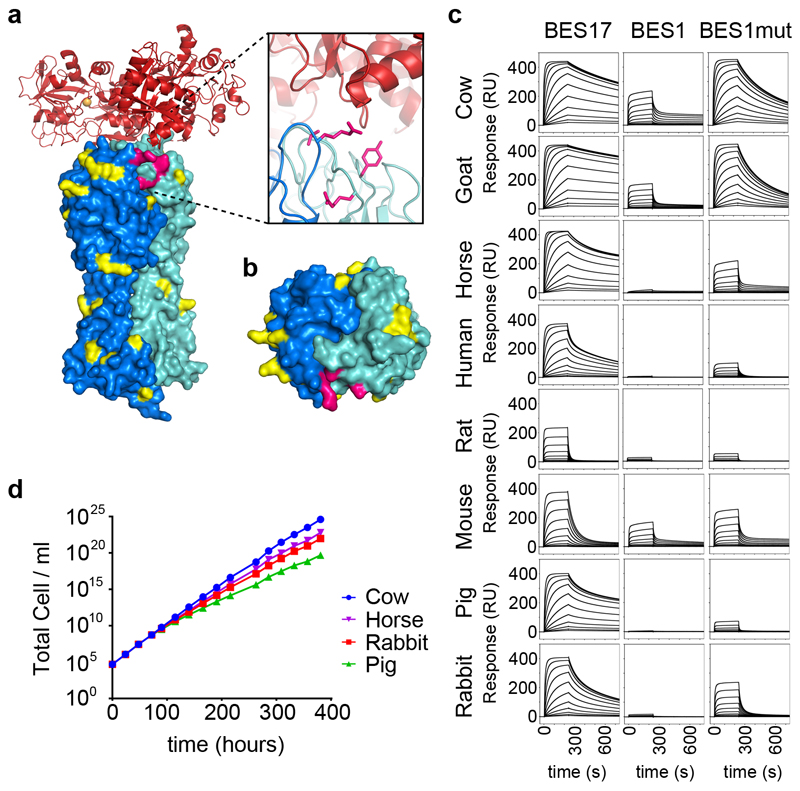
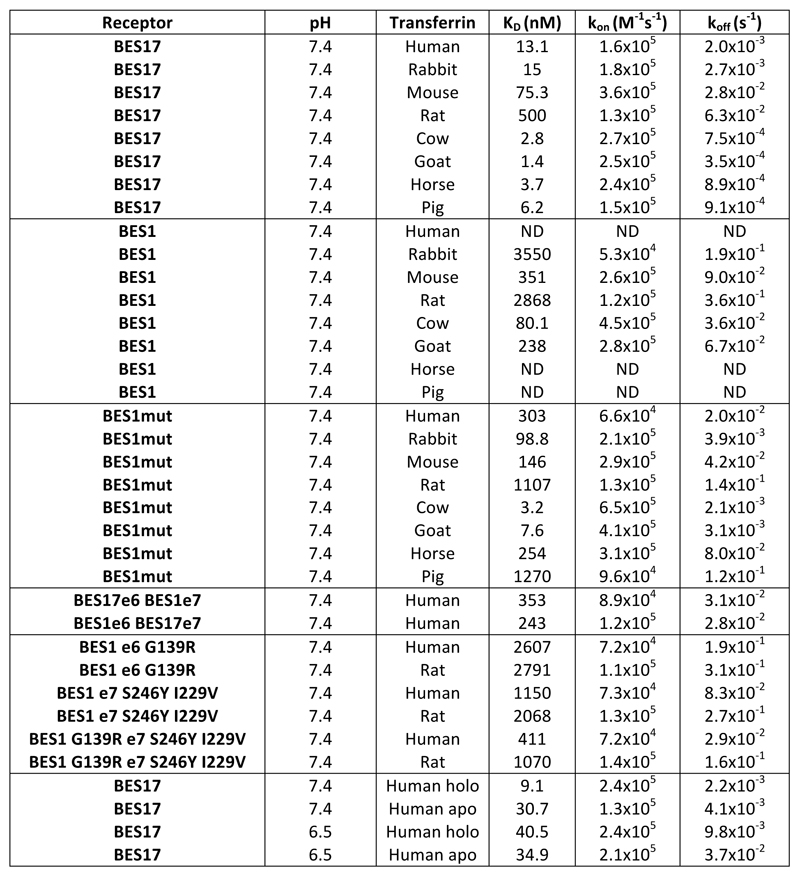
The binding of transferrin variants was measured by surface plasmon resonance (Figure 3c, Extended Data Figure 6). BES17 bound all eight transferrin variants tested, with affinities ranging from 2.8 to 500 nM. As these are all significantly below the transferrin concentration of ~30 μM in serum and ~15 μM in interstitial fluid20, BES17 would be nearly saturated with transferrin in all of these mammals. This will ensure efficient transferrin uptake in physiological conditions. Additionally, receptor saturation will ensure that the most exposed surface of the receptor is covered by transferrin and therefore not available for recognition by immunoglobulins, reducing risk of immune detection and clearance.
Figure 3. Binding of the transferrin receptor to transferrin from different mammalian species.
a. The structure of the trypanosome transferrin receptor heterodimer shown as a surface representation (ESAG6 in dark blue and ESAG7 in light blue) bound to human transferrin as a cartoon (red). Residues highlighted in yellow and pink are those that differ between BES17 and BES1. The residues highlighted in pink are those mutated in BES1mut. b. A view of the transferrin binding surface of the transferrin receptor, coloured as in a. c. Binding of the BES17, BES1 and BES1mut transferrin receptors to transferrin from eight different mammalian species, as determined by surface plasmon resonance. Each concentration series was performed once. d. Assessment of the rate of growth of trypanosomes expressing BES1 transferrin receptor in different sera. Blood stream form trypanosomes were grown in fetal calf serum (cow) for 72 hours to ensure a steady growth rate, and then switched to grow in cow, horse, rabbit or pig sera. Data shown is representative of two independent replicates.
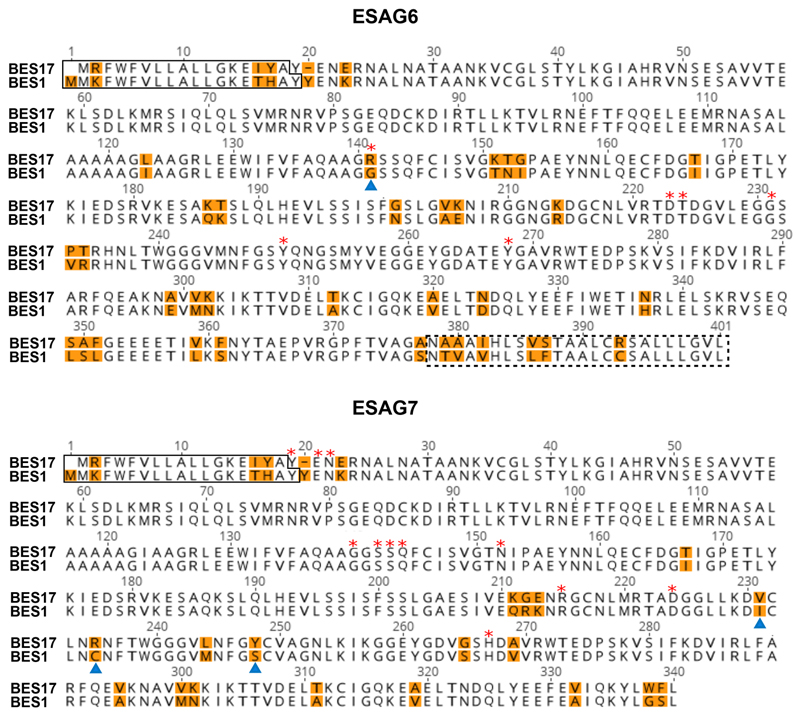
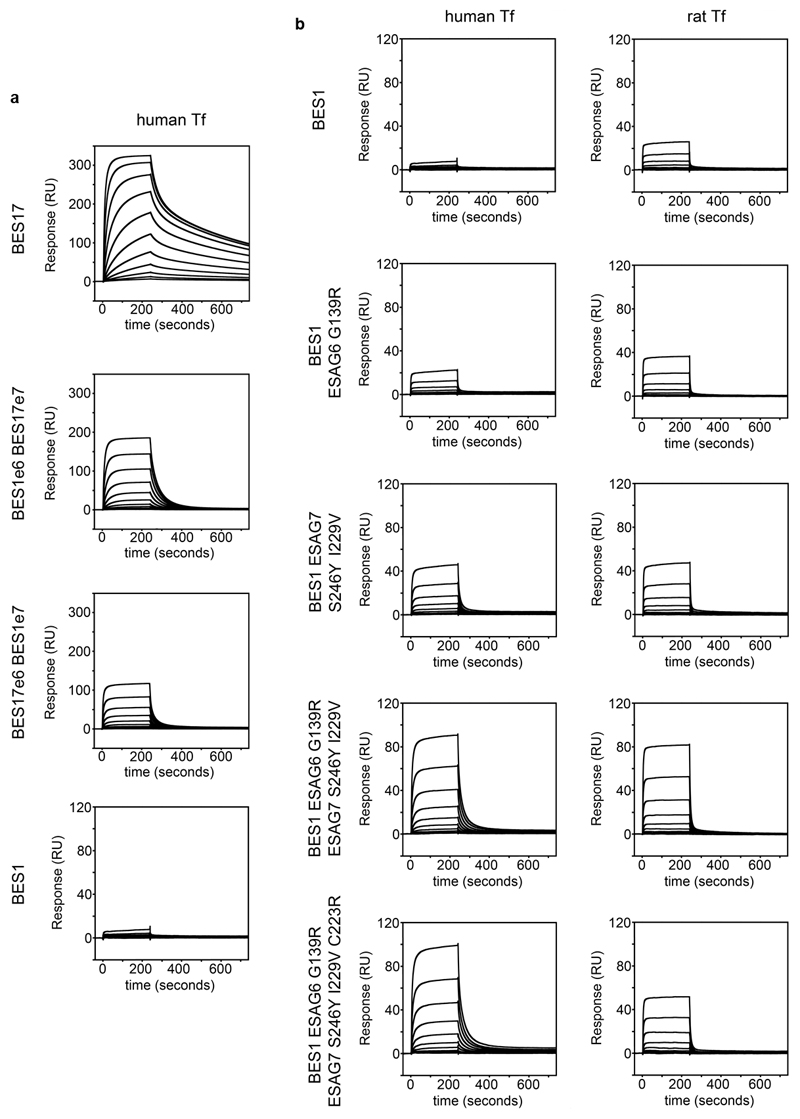
The second receptor, BES1 bound more weakly to all eight transferrin variants, with submicromolar affinity for transferrin from just three species (Extended Data Figure 6), and little or no binding detected to four. In no case was the affinity of any transferrin for BES1 greater than that for BES17. To assess which molecular features of BES1 reduce transferrin binding, we first made chimeric receptors containing ESAG6 from BES1 and ESAG7 from BES17 or vice versa. We assessed binding of these to human transferrin. BES17 binds with an affinity of 13.1nM while BES1 shows negligible binding. However, both chimeras showed an intermediate affinity (243nM and 353nM), revealing that both ESAG6 and ESAG7 contribute to binding (Extended Data Figure 9, Extended Data Figure 6). We next selected four residues close to the transferrin binding site which are polymorphic (ESAG6 residue 139 and ESAG7, residues 246, 229 and 233) (Extended Data Figure 8). Mutation of each of these four sites in BES1 increased its affinity for both rat and human transferrin, with four mutations leading to the greatest increase in affinity (BES1mut) (Extended Data Figure 6, Extended Data Figure 9). This mutant bound all eight transferrin variants with a higher affinity than BES1 receptor (Figure 3, Extended Data Figure 6).
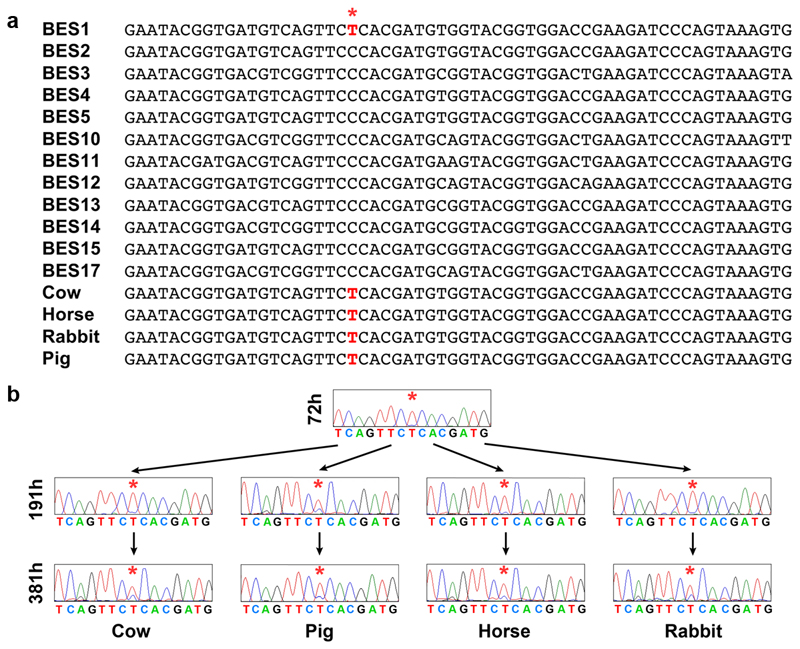
We next tested whether growth of BES1 receptor-expressing Trypanosoma brucei occurs in sera containing transferrin molecules for which this receptor has low affinity. We compared growth of trypanosomes in fetal calf serum (KD=80.1nM) with that in rabbit (KD=3.5 M), pig (weak, KD not determinable) or horse (weak, KD not determinable) sera (Figure 3d). In all four cases, cells were grown for 72 hours in fetal calf serum (cow transferrin), before exchange into media containing 10% of exclusively cow, rabbit, pig or horse transferrin. While growth rates over the next 309 hours were not identical, trypanosomes grew in all four sera. Indeed, transferrin with very different affinities for BES1 receptor supported similar growth rates, with doubling times in cow transferrin of ~5.9 hours similar to those in horse transferrin of ~6.3 hours. We next assessed, by sequencing reverse transcribed mRNA, whether trypanosomes had switched transferrin receptor expression (Extended Data Figure 10). Trypanosomes grown for 72 hours in fetal calf serum expressed BES1. After a further 309 hours in different sera, the predominant receptor remained BES1 in all four cases. However, a small fraction of other receptors were present, showing that the experiment had been conducted for long enough to detect switching. Nevertheless, the fraction of other receptors expressed was no more when trypanosomes were grown in low affinity horse or pig transferrin than in high affinity cow transferrin or moderate affinity rabbit transferrin. Therefore, while these different receptors may have greater affinity for transferrin than the original BES1, they are no more likely to be expressed when cells are grown in transferrin with low BES1 affinity, suggesting a lack of selection to switch away from BES1 based on transferrin affinity.
These findings suggest that BES1 has not evolved to bind more tightly to transferrin from a particular species, as it has reduced affinity for all transferrin variants, most likely due to evolutionary drift in the absence of selection for high affinity transferrin binding. This, together with the discovery that a single transferrin receptor can bind to transferrin from all tested mammals with submicromolar affinity, makes it likely that multiple transferrin receptors are not required for iron acquisition in multiple mammals and that selection for multiplication and divergence of this receptor family is due to an evolutionary pressure other than the need for transferrin uptake in different mammals.
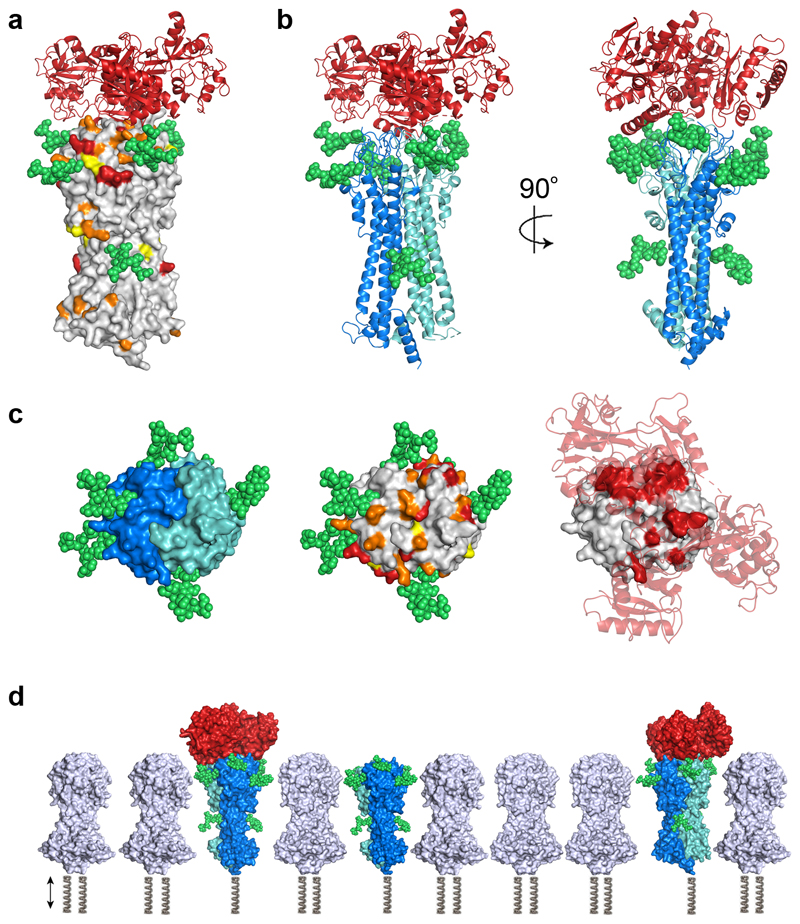
As receptor variation appears unlikely to be required to facilitate a broad host species range, it might instead aid long term avoidance of the host adaptive immune response through serial expression of antigenic variants. Shannon sequence entropies were calculated for each residue of the transferrin receptor to assess their degree of polymorphism and the location of polymorphic residues. If variation is driven by a selection pressure to alter transferrin binding, we would expect residues that directly contact transferrin to be most divergent. However, if diversification is driven by evasion of immune detection, we would expect regions most exposed to the immune system to be most divergent. We found that polymorphic residues were concentrated in the membrane distal third of the receptor, with 68% of the most polymorphic 59 residues (with Shannon entropy greater than 0.5) in this region (Figure 4a, Supplementary Table 1). Of these most polymorphic residues, only five (8.5%) directly contact transferrin (Extended Data Figure 8). Of the sixteen residues that contact transferrin (Extended Data Figure 8), only five (31%) are among the most polymorphic 59 residues. This suggests that a selection pressure to diversify residues that contact transferrin is not the major driving force for diversification of the receptor. Instead, polymorphic residues are concentrated around the top third of the receptor, which is most exposed to the immune system, suggesting that antigenic variation is the major driving force for diversification.
Figure 4. Glycans and sequence diversity concentrate around the membrane distal head of the transferrin receptor.
a. The structure of the transferrin receptor is shown as a grey surface with variable residues coloured in yellow (Shannon sequence entropy 0.3-0.5), orange (0.5-0.8) and red (>0.8). Modelled glycans are shown in green and transferrin as a red cartoon. b. The structure of the trypanosome transferrin receptor heterodimer (ESAG6 in dark blue and ESAG7 in light blue) bound to human transferrin (red) with N-linked glycans modelled in green. c. Views of the membrane distal surface of the transferrin receptor. In the left-hand panel, ESAG6 is shown as a dark blue surface and ESAG7 as a light blue surface. The modelled glycans are in green. The middle panel is coloured as b. In the right-hand panel, the transferrin receptor is shown as a grey surface with residues which directly contact transferrin in red. Human transferrin receptor is shown as a transparent cartoon in red. d. A static comparison of free and transferrin bound transferrin receptors with the N-terminal domains of variant surface glycoproteins in grey. This shows the green glycans to provide sufficient space in the VSG layer to provide access for transferrin. The VSG molecules will also be glycosylated, at positions which differ depending on the VSG variant (not shown). The springs represent that these molecules also have regions not modelled and their relative positions within the dynamic trypanosome surface will vary.
We next assessed the role of N-linked glycans on receptor function by determining the structure of human transferrin in complex with glycosylated BES17 receptor at 3.42 Å resolution (Extended Data Figure 2). Unambiguous electron density was seen for 12 sugars, with one to three sugars resolved on each of the seven predicted glycosylation sites within the ordered part of the receptor. Previous analysis of glycan composition of the receptor by mass spectrometry24 allowed us to expand the sugars observed in our structure to model the authentic glycans (Figure 4).
The seven glycans localise to two main sites. Both ESAG6 and ESAG7 have a single N-linked glycan positioned approximately half way along the longest axis of the receptor, protruding from the location where the receptor is at its narrowest. As previously proposed24, this may prevent receptor crowding by VSG molecules at this narrowest axis, providing space for transferrin binding (Figure 4d). The second group of five glycans, three on ESAG6 and two on ESAG7, form a ring around the top of the receptor, immediately adjacent to the binding site for transferrin. These potentially have two major functions. Again, they will prevent molecular crowding of the receptor by VSG to keep the transferrin binding site accessible. They also cover a large part of the membrane-distal third of the receptor that is not involved in transferrin binding, reducing the likelihood of immunoglobulin binding. Indeed, comparison of the locations of glycans and the polymorphic residues support this view, with patches of polymorphic residues filling the space around the top of the receptor which is not obscured by glycosylation (Figure 4c).
These studies reveal how a VSG-like receptor can function on the trypanosome surface. They show how heterodimerisation of the receptor creates a broad asymmetric binding platform for a large ligand and confirm that glycans, which reduce molecular crowding, can help to keep this site clear for ligand binding. They also highlight how different the transferrin receptor is from the only other trypanosome surface receptor studied in such molecular detail; that for haptoglobin-haemoglobin, which is a slim three helical bundle, with a kink to reduce molecular crowding and a binding site on the side of the bundle25. These examples illustrate how trypanosomes have evolved, from the starting point of a three-helical bundle architecture, two very different receptors to facilitate uptake of two very different ligands.
These studies also provide insight into the reasons why trypanosomes have evolved a panel of transferrin receptors. One hypothesis was a proposed requirement for different transferrin receptors to allow trypanosomes to grow in mammalian species with different transferrin sequences5,6. However, we find that a single transferrin receptor can mediate binding to a broad range of mammalian transferrin variants, all with submicromolar affinities that will ensure saturation of the receptor at physiological transferrin concentrations. This suggests that trypanosomes only require a single transferrin receptor to interact efficiently with transferrin from varied mammalian species, much as is seen for the single haptoglobin-haemoglobin receptor23.
A more likely hypothesis is that multiple receptors are present to avoid inhibition of transferrin uptake by antibodies raised against the transferrin binding site. Switching receptor to a novel antigenic variant could reset the system to prevent such competition. Indeed, our studies support a model in which development of a panel of transferrin receptors most likely allows antigenic variation, as we find that polymorphism is concentrated not predominantly in residues that contact transferrin, but across the mostly exposed, membrane distal third of the receptor.
Such a panel will allow antigenic switching to prevent antibodies from competing for transferrin binding6,20 and will aid immune evasion. Perhaps the broader and most exposed platform of the transferrin receptor is more likely to be detected by antibodies than the narrower haptoglobin-haemoglobin receptor, increasing the likelihood of detection. A panel of transferrin receptors has therefore evolved to allow a population of trypanosomes to survive, under immune onslaught, for longer in their mammalian host.
Materials and Methods
Transferrin receptor expression and cloning
To produce glycosylated transferrin receptors, the open reading frames of BES17 ESAG6 (BES17e6) and BES1 ESAG6 (BES1e6) were modified to remove the native signal peptide and predicted GPI anchor addition site. These genes (residues 18-375 for BES17 and 20-377 for BES1) were codon optimised, synthesised (GeneArt) and subcloned into the pDest12 vector for mammalian expression from the CMV promoter. The CD33 signal peptide was used for recombinant protein secretion and C-terminal AviTag and decahistidine tags preceded by a (GS)3 linker were included. The open reading frames of BES17 ESAG7 (BES17e7) and BES1 ESAG7 (BES1e7) were modified to remove the native signal peptide. Genes (residues 18-337 for BES17 and 20-338 for BES1) were codon optimised, synthesised and subcloned into pDest12. The CD33 signal peptide was used for secretion and a C-terminal (GS)3 linker and StrepII-tag was present. Glycosylated transferrin receptor was used for all studies except for structure determination.
To produce non-glycosylated, tagless transferrin receptor for structural studies, the open reading frame of BES17e6 was modified to remove the signal peptide and predicted GPI anchor addition site. A TEV cleavable N-terminal polyhistidine-tag was added and predicted N-linked glycosylation sites were mutated, by changing asparagine to aspartic acid (N26Q, N110Q, N235Q, N250Q, N360Q). The C-terminal linker and tags were deleted. BES17e7 was modified by removal of the signal peptide, removal of glycosylation sites by mutation of asparagine to aspartic acid (N26Q, N110Q, N234Q) and deletion of the C-terminal linker and Strep-II tag. These open reading frames were cloned into the pDest12 vector for mammalian cell expression from CMV promoter with a CD33 signal peptide.
For protein production, G22 CHO cells were grown in 500ml serum-free CCM8 medium (SAFC). Cells were co-transfected with recombinant BES17e6 and BES17e7 plasmids in equal mass ratios and were fed on day 1, day 3 and day 6 by the addition of 3.3% F9 and 0.2% F10 cell feed (MedImmune). Cells were harvested on day 8 and the aqueous phase containing secreted recombinant protein was recovered after centrifugation.
Transferrin receptor complexes were purified by nickel affinity chromatography using a His Trap EXCEL 5ml column (GE Healthcare). To prepare complexes for crystallisation, human holo-transferrin (Sigma Aldrich, T4132) was mixed with non-glycosylated transferrin receptor in a 1.1-fold molar excess and was incubated with TEV protease (Invitrogen, 12575015) and PNGase F (NEB, P0704S) at 37°C for 16 hours. The complex was purified from free components using size exclusion with a Superdex 200 16/60 chromatography column (GE Healthcare) with a running buffer of 10mM Tris pH8, 150mM NaCl). For structural studies of glycosylated receptor, BES17e6 and BES17e7 plasmids were co-transfected into G22 CHO cells in the presence of 5μM Kifunensine (Sigma Aldrich, K1140) to generate homogeneous mannose-rich glycans and were isolated by nickel affinity chromatography. Carboxypeptidase B (Roche, 10103233001) was also added prior to size exclusion chromatography.
For surface plasmon resonance, G22 CHO cells were co-transfected with BES17e6 and BES17e7 (BES17), BES1e6 and BES1e7 (BES1), BES1e6 G139R mutant and BES1e7 Y246S, I229V, C233R (BES1mut), BES17e6 and BES1e7 (BES17e6BES1e7 chimera), BES1e6 and BES17e7 (BES1e6BES17e7 chimera), BES1e6 G139R mutant and BES1e7 (BES1 ESAG6 G139R), BES1e6 and BES1e7 S246Y and I229V mutant (BES1 ESAG7 S246Y I229V), BES1e6 G139R mutant or BES1e7 S246Y I229V mutant (BES1 ESAG6 G139R ESAG7 S246Y I229V). All receptors were isolated by nickel affinity chromatography as stated previously.
Crystallisation and Structure determination
Concentrated protein (13.7 mg/ml) was subjected to sitting drop vapour diffusion crystallisation trials in SwisSci 96-well plates by mixing 100 nl protein with 100 nl reservoir solution. Crystals of complexes containing either glycosylated and non-glycosylated BES17 transferrin receptor and human transferrin were obtained in 12% (w/v) PEG 5000 MME, 12% 2-methyl-2,4-pentanediol, 0.1 M MES, pH 6.5 at 18°C. Crystals were transferred into 12% (w/v) PEG 5000 MME, 25% 2-methyl-2,4-pentanediol and 0.1 M MES, pH 6.5 and were then cryo-cooled in liquid nitrogen for storage and data collection. Data were collected on beamline I03 at the Diamond Light Source at 100K with a wavelength of 1Å and were indexed and scaled using XDS 26. Crystals of the glycan-lacking mutant diffracted to 2.75Å resolution and were used for subsequent structure determination. Phaser27 was used to determine a molecular replacement solution. First a search was conducted to locate human transferrin with the two lobes separated into separate search models (residues 3-330 and 339-674 from PDB code 4X1B)28. With the solution from this search fixed in place, a second step used a highly trimmed search model containing just the α-helical core of a dimeric variant surface glycoprotein (residues 7-112 and 239-251 from PDB code 2VSG)29. This identified one copy of the complex in the asymmetric unit of the crystal. Refinement and rebuilding were then completed using Buster30 and Coot31 respectively, giving final Ramachandran statistics of 93.6% of residues in the favoured region, 6.3% in the allowed region and 0.1% outliers.
Crystals of complex containing glycosylated transferrin receptor yielded a diffraction dataset to 3.42Å resolution, which was used to identify which positions retained glycans. This dataset was analysed using molecular replacement by Phaser, with the structure of the complex containing non-glycosyated receptor as the molecular replacement search model. Density was observed for the entire model, with residues 425-582 of transferrin poorly resolved. Difference density was observed for between one and three sugars on each of the four putative glycosylation sites on ESAG6 and the three sites on ESAG7. A model was built, and was refined in Buster using restraints derived from the higher resolution non-glycosylated receptor model, giving final Ramachandran statistics of 94.4% of residues in the favoured region, 5.5% in the allowed region and 0.1% outliers.
Surface plasmon resonance analysis
Native transferrin variants for surface plasmon resonance (SPR) analysis were purified from serum using transferrin receptor affinity chromatography. Cow (Sigma Aldrich, B9433), horse (Sigma Aldrich, H1270), pig (Sigma Aldrich, P9783), mouse sera (Sigma Aldrich, M5905), rabbit (ThermoFisher, 16120099), goat (ThermoFisher, 16210064), rat serum (ThermoFisher, 10710C) and human serum (donor) were used. Due to limited volumes of donor serum, human holo-transferrin (Sigma Aldrich, T4132) was also used after confirming by surface plasmon resonance that there were no significant differences in binding kinetics. Human apo-transferrin (Sigma Aldrich, T1147) was dialysed in the presence of 10mM EDTA into 10mM HEPES pH7.4, 150mM NaCl for 15 hours to remove any residual traces of free iron. BES17 receptor was immobilised via amine coupling to a 1ml HiTrap NHS-activated HP column (GE Healthcare) following the manufacturer’s protocol. Serum was passed over the column and washed with PBS. Transferrin was eluted with 100mM citrate pH 3.5 and dialysed into PBS. It was loaded with iron by incubation with a four-fold molar excess of ammonium iron (III) sulphate in the presence of 5mM sodium bicarbonate32. Free iron was removed by dialysis into 10mM HEPES pH7.4, 150mM NaCl. Avi-tagged transferrin receptors for surface plasmon resonance were biotinylated by incubation of 30μM receptor with 0.4μM BirA, 0.3mM Biotin and 5mM ATP at 25°C for 16 hours.
Surface Plasmon Resonance was performed using the Biotin CAPture kit (GE Healthcare) on a Biacore T200 instrument (GE Healthcare). Biotinylated receptor was immobilised onto flow path 2 of a Biotin CAPture chip (GE Healthcare) to a total of ~500RU, while flow path 1 was left without receptor as a blank. Most experiments were run at 25°C in 10mM HEPES pH 7.4, 150mM NaCl, 0.005% Tween-20. However, for the pH assay, a phosphate-citrate buffer system was used to mimic the endocytic pH range with 50mM citric acid, 150mM NaCl, 0.005% Tween-20 and 50mM Na2HPO4, 150mM NaCl, 0.005% Tween-20 mixed to achieve pH 6.5, 5.5 and 4.8. Two-fold serial dilutions of purified native transferrin were injected over the receptor-coupled chip for 240s, followed by a 500s dissociation time. The chip was regenerated using CAPture regeneration solution (GE Healthcare) after each cycle. Subtraction of the response observed in the blank reference flow cell was used to eliminate non-specific signals. Blank subtracted sensorgrams were fitted to a 1:1 interaction model and kinetic rates were determined using T200 evaluation software.
In vitro culture of BES1 expressing cells and RT-PCR
Lister 427 cells expressing from the BES1 expression site were cultured in HMI-11 with 10% fetal calf serum (Gibco, 10270106) and cells were initially grown for 72 hours Cells were then washed with serum-free HMI-11 and 1 x 10⁵ cells/ml were resuspended in HMI-11 with 10% horse (Gibco, 16050130), rabbit (Gibco, 16120099), pig (Gibco, 26250084) or fetal calf serum. Cells were cultured for a further 309 hours and cell counts were performed by hand in duplicate for each of two independent flasks.
RNA was isolated at 72, 191 and 381 hours, using an RNeasy mini kit (Qiagen). RNA was treated with Turbo DNA-free kit (Invitrogen) to remove residual DNA. RNA was reverse transcribed using random oligomers and SuperScript II reverse transcriptase kit (Invitrogen). cDNA was used as a template for PCR with ESAG6 or ESAG7-specific primers and amplified ESAG6 and ESAG7 mRNAs were sequenced.
Iron quantification by μPIXE
Iron stoichiometry in the different samples were measured using microbeam Particle Induced X-ray Emission (μPIXE) 33. To prepare samples for analysis by μPIXE, complexes of glycosylated BES17 transferrin receptor, expressed in the presence of kifunensine, bound to human transferrin were prepared. To remove chloride ions which would interfere with analysis, samples they were purified by size exclusion chromatography using a Superdex 200 10/30 column (GE Healthcare) into (i) 50mM sodium citrate pH 4.8, 150 mM NaBr; (ii) 50mM sodium citrate pH 5.5, 150 mM NaBr; (iii) 50mM Bis-Tris pH 6.5, 150 mM NaBr and (iv) 50mM Bis-Tris pH 7.5, 150 mM NaBr. In each case, buffers had been titrated with citric acid to the desired pH. As a control, human transferrin, in the absence of receptor, was purified through the same protocol. Samples were concentrated to 1mg/ml for analysis to the retained iron.
The measurements were carried out at the Ion Beam Centre, University of Surrey, UK34. A 2.5-MeV proton beam of diameter 2.0 μm was used to induce characteristic X-ray emission from dried protein droplets (volume per droplet ~ 0.1 μl) under vacuum. The X-rays were detected in a solid-state lithium drifted silicon detector with high energy resolution. By scanning the proton beam in x and y over the dried sample, spatial maps were obtained of all elements heavier than magnesium present in the sample. Quantitative information, using sulphur as an internal standard, was obtained by collecting 3 or 4 point spectra from each droplet. These spectra were analyzed with GUPIX35 within DAN3236 to extract the relative amount of each element, particularly iron, in the sample. Comparison of the quantities of sulphur and iron allowed determination of the number of iron ions per protein complex.
Extended Data
Extended Data Figure 1. Phylogenic analysis of transferrin receptors.
A. Evolutionary trees showing the relatedness of different transferrin receptor variants within the blood stream expression sites of the Lister 427 strain. The BES1 and BES17 receptors are highlighted in red. B. Comparison of the BES17 ESAG6 and ESAG7 proteins. The black box indicates the signal sequence and the dashed black box indicates the GPI-anchor addition site. Blue cylinders represent the helical regions of the structure. Red stars mark residues which make direct contacts with human transferrin. Orange highlighting of the text indicates residues which differ between ESAG6 and ESAG7.
Extended Data Figure 2. Data collection and refinement statistics.
Extended Data Figure 3. Comparison of the transferrin receptor with VSGs and the haptoglobin-haemoglobin receptor.
a. Structural alignment of the transferrin receptor with known VSG structures, 1VSG (orange), 2VSG (yellow) and 5LY9 (pink) and the Trypanosoma brucei haptoglobin-haemoglobin receptor (TbHpHbR, red) b. Sequence alignment of the two subunits of the transferrin receptor with the three VSGs. Orange highlighting indicates divergent residues.
Extended Data Figure 4. Sequence alignment of mammalian transferrin variants analysed in this study.
a. Phylogenic tree of placental mammals adapted from 36. b. Sequence alignment if selected transferrin variants. Variable residues are highlighted in orange and residues which directly contact the BES17 transferrin receptor are indicated by red stars. Green circles identify residues which contact the human transferrin receptor.
Extended Data Figure 5. Table of interactions.
Extended Data Figure 6. Surface plasmon resonance analysis.
Measurement of kinetic binding parameters for transferrin receptor variants to transferrins. BES1mut has a G139R mutation in ESAG6 and S246Y I229V and C223R in ESAG7. ESAG6 is e6 and ESAG7 is e7 in the table.
Extended Data Figure 7. elemental analysis by PIXE to determine the number of Fe ions per transferrin or transferrin:TfR complex at different pH values.
Plots of counts per channel for emission induced by different photon energies, annotated with the element responsible for emission. Comparison of the quantities of Fe and S, together with knowledge of the protein sequences, and the numbers of S atoms, allowed determination of the number of Fe ions per transferrin or transferrin:TfR complex. Data shown is representative of three technical replicates.
Extended Data Figure 8. comparison of the sequences of BES17 and BES1 transferrin receptors.
Sequence alignments of ESAG6 subunits and ESAG7 subunits. Numbering is according to the BES17 sequence, which matches that of the crystal structure. Residues highlighted in orange vary between the BES1 and BES17 variants. Residues indicated by a red star directly contact human transferrin in the BES17 receptor. Residues indicated by a blue triangle are those mutated in the BES1mut mutant. Residues boxed with a continuous line represent the putative signal peptides while those boxed with a discontinuous line represent the GPI-anchor addition sequence.
Extended Data Figure 9. SPR analysis of transferrin receptor variants and mutants.
a. Analysis of binding of chimeric receptors formed between the ESAG6 and ESA7 subunits of the BES1 and BES17 transferrin receptor variants to human transferrin by surface plasmon resonance. b. Analysis of the binding to human and rat transferrin of mutants of the BES1 transferrin receptor. Each concentration series was performed once.
Extended Data Figure 10. Analysis of transferrin receptor expression during growth in sera from different mammals.
a. Sequences of ESAG7 from different transferrin receptor variants within the blood stream expression sites of the Lister 427 strain, showing nucleotide sequences equivalent to 778 to 837 in the BES1 sequence. Below this are shown the predominant sequences found in Trypanosoma brucei cells grown in serum exclusively containing Cow, Horse, Rabbit and Pig transferrin for 309 hours. The red lettering and red star indicate a sequence difference at position 798 in which a T is unique to the BES1 receptor. b. Sequencing chromatograms of the expressed transferrin receptor variants in cells, showing nucleotides equivalent to 791 to 805 in the BES1 sequence. The star marks residue 798, which is T in BES1 and C in the other receptors in the Lister 427 strain. The top chromatogram shows that Trypanosoma brucei grown in fetal calf serum (Cow) for 72 hours predominantly express BES1. These cells were transferred into media containing serum from Cow, Pig, Horse or Rabbit and were grown for a further 119 hours (the 191h time point) and 309 hours (the 381h time point) and the chromatograms show the transferrin receptor sequences expressed at these times remains predominantly BES1, with lower levels of other receptors in all four sera. A similar outcome was seen for ESAG6 sequences (not shown).
Acknowledgements
This work was supported by a research grant from the Medical Research Council (MR/R001138/1). C.T. holds a BBSRC iCASE studentship. M.K.H. is a Wellcome Investigator. The authors are grateful for the assistance of Dr Edward Lowe and the beamline scientists of beamline I03 at Diamond Light Source with crystallographic data collection. They also thank Dr Geoff Grime at the Surrey Ion Beam Centre for assistance with μPIXE data collection, which was funded through an EPSRC grant #NS/A000059/1 to the UK National Ion Beam Centre.
Footnotes
Data availability:
Crystallographic data, including molecular models and reflection data is available in the Protein Data Bank with accession codes 6SOY and 6SOZ. All other data and constructs are available on request from the corresponding authors.
Competing interests statement:
The authors declare that they have no competing interests
Author contributions statement:
C.E.T. performed protein production, crystallisation and surface plasmon resonance analysis. C.E.T. and M.K.H. determined the crystal structure. C.E.T., O.J.S.M. and M.C. conducted growth and expression analysis. P.G.W. and E.F.G. performed and analysed microPIXE experiments. A.L.G., S.R., T.J.V. and R.M. participated in design and experimental coordination. C.E.T, M.C. and M.K.H. devised the study and wrote the manuscript.
References
- 1.McCulloch R, et al. Emerging challenges in understanding trypanosome antigenic variation. Emerg Top Life Sci. 2017;1:585–592. doi: 10.1042/ETLS20170104. [DOI] [PMC free article] [PubMed] [Google Scholar]
- 2.Salmon D, et al. A novel heterodimeric transferrin receptor encoded by a pair of VSG expression site-associated genes in T. brucei. Cell. 1994;78:75–86. doi: 10.1016/0092-8674(94)90574-6. [DOI] [PubMed] [Google Scholar]
- 3.Steverding D, et al. ESAG 6 and 7 products of Trypanosoma brucei form a transferrin binding protein complex. Eur J Cell Biol. 1994;64:78–87. [PubMed] [Google Scholar]
- 4.Hertz-Fowler C, et al. Telomeric expression sites are highly conserved in Trypanosoma brucei. PLoS One. 2008;3:e3527. doi: 10.1371/journal.pone.0003527. [DOI] [PMC free article] [PubMed] [Google Scholar]
- 5.Bitter W, Gerrits H, Kieft R, Borst P. The role of transferrin-receptor variation in the host range of Trypanosoma brucei. Nature. 1998;391:499–502. doi: 10.1038/35166. [DOI] [PubMed] [Google Scholar]
- 6.Gerrits H, Mussmann R, Bitter W, Kieft R, Borst P. The physiological significance of transferrin receptor variations in Trypanosoma brucei. Mol Biochem Parasitol. 2002;119:237–47. doi: 10.1016/s0166-6851(01)00417-0. [DOI] [PubMed] [Google Scholar]
- 7.Andrews NC, Schmidt PJ. Iron homeostasis. Annu Rev Physiol. 2007;69:69–85. doi: 10.1146/annurev.physiol.69.031905.164337. [DOI] [PubMed] [Google Scholar]
- 8.Luck AN, Mason AB. Transferrin-mediated cellular iron delivery. Curr Top Membr. 2012;69:3–35. doi: 10.1016/B978-0-12-394390-3.00001-X. [DOI] [PMC free article] [PubMed] [Google Scholar]
- 9.Wally J, et al. The crystal structure of iron-free human serum transferrin provides insight into inter-lobe communication and receptor binding. J Biol Chem. 2006;281:24934–44. doi: 10.1074/jbc.M604592200. [DOI] [PMC free article] [PubMed] [Google Scholar]
- 10.Hall DR, et al. The crystal and molecular structures of diferric porcine and rabbit serum transferrins at resolutions of 2.15 and 2.60 A, respectively. Acta Crystallogr D Biol Crystallogr. 2002;58:70–80. doi: 10.1107/s0907444901017309. [DOI] [PubMed] [Google Scholar]
- 11.Congiu Castellano A, et al. Structure-function relationship in the serotransferrin: the role of the pH on the conformational change and the metal ions release. Biochem Biophys Res Commun. 1994;198:646–52. doi: 10.1006/bbrc.1994.1094. [DOI] [PubMed] [Google Scholar]
- 12.Eckenroth BE, Steere AN, Chasteen ND, Everse SJ, Mason AB. How the binding of human transferrin primes the transferrin receptor potentiating iron release at endosomal pH. Proc Natl Acad Sci U S A. 2011;108:13089–94. doi: 10.1073/pnas.1105786108. [DOI] [PMC free article] [PubMed] [Google Scholar]
- 13.Dautry-Varsat A, Ciechanover A, Lodish HF. pH and the recycling of transferrin during receptor-mediated endocytosis. Proc Natl Acad Sci U S A. 1983;80:2258–62. doi: 10.1073/pnas.80.8.2258. [DOI] [PMC free article] [PubMed] [Google Scholar]
- 14.Noinaj N, Buchanan SK, Cornelissen CN. The transferrin-iron import system from pathogenic Neisseria species. Mol Microbiol. 2012;86:246–57. doi: 10.1111/mmi.12002. [DOI] [PMC free article] [PubMed] [Google Scholar]
- 15.Calmettes C, Alcantara J, Yu RH, Schryvers AB, Moraes TF. The structural basis of transferrin sequestration by transferrin-binding protein B. Nat Struct Mol Biol. 2012;19:358–60. doi: 10.1038/nsmb.2251. [DOI] [PMC free article] [PubMed] [Google Scholar]
- 16.Steverding D, Stierhof YD, Fuchs H, Tauber R, Overath P. Transferrin-binding protein complex is the receptor for transferrin uptake in Trypanosoma brucei. J Cell Biol. 1995;131:1173–82. doi: 10.1083/jcb.131.5.1173. [DOI] [PMC free article] [PubMed] [Google Scholar]
- 17.Ligtenberg MJ, et al. Reconstitution of a surface transferrin binding complex in insect form Trypanosoma brucei. EMBO J. 1994;13:2565–73. doi: 10.1002/j.1460-2075.1994.tb06546.x. [DOI] [PMC free article] [PubMed] [Google Scholar]
- 18.Salmon D, et al. Characterization of the ligand-binding site of the transferrin receptor in Trypanosoma brucei demonstrates a structural relationship with the N-terminal domain of the variant surface glycoprotein. EMBO J. 1997;16:7272–8. doi: 10.1093/emboj/16.24.7272. [DOI] [PMC free article] [PubMed] [Google Scholar]
- 19.Engstler M, et al. Hydrodynamic flow-mediated protein sorting on the cell surface of trypanosomes. Cell. 2007;131:505–15. doi: 10.1016/j.cell.2007.08.046. [DOI] [PubMed] [Google Scholar]
- 20.Steverding D. The significance of transferrin receptor variation in Trypanosoma brucei. Trends Parasitol. 2003;19:125–7. doi: 10.1016/s1471-4922(03)00006-0. [DOI] [PubMed] [Google Scholar]
- 21.Cheng Y, Zak O, Aisen P, Harrison SC, Walz T. Structure of the human transferrin receptor-transferrin complex. Cell. 2004;116:565–76. doi: 10.1016/s0092-8674(04)00130-8. [DOI] [PubMed] [Google Scholar]
- 22.Williams J, Moreton K. The distribution of iron between the metal-binding sites of transferrin human serum. Biochem J. 1980;185:483–8. doi: 10.1042/bj1850483. [DOI] [PMC free article] [PubMed] [Google Scholar]
- 23.Vanhollebeke B, et al. A haptoglobin-hemoglobin receptor conveys innate immunity to Trypanosoma brucei in humans. Science. 2008;320:677–81. doi: 10.1126/science.1156296. [DOI] [PubMed] [Google Scholar]
- 24.Mehlert A, Wormald MR, Ferguson MA. Modeling of the N-glycosylated transferrin receptor suggests how transferrin binding can occur within the surface coat of Trypanosoma brucei. PLoS Pathog. 2012;8:e1002618. doi: 10.1371/journal.ppat.1002618. [DOI] [PMC free article] [PubMed] [Google Scholar]
- 25.Lane-Serff H, MacGregor P, Lowe ED, Carrington M, Higgins MK. Structural basis for ligand and innate immunity factor uptake by the trypanosome haptoglobin-haemoglobin receptor. Elife. 2014;3:e05553. doi: 10.7554/eLife.05553. [DOI] [PMC free article] [PubMed] [Google Scholar]
- 26.Kabsch W. Xds. Acta Crystallogr D Biol Crystallogr. 2010;66:125–32. doi: 10.1107/S0907444909047337. [DOI] [PMC free article] [PubMed] [Google Scholar]
- 27.McCoy AJ, et al. Phaser crystallographic software. J Appl Crystallogr. 2007;40:658–674. doi: 10.1107/S0021889807021206. [DOI] [PMC free article] [PubMed] [Google Scholar]
- 28.Wang M, et al. "Anion clamp" allows flexible protein to impose coordination geometry on metal ions. Chem Commun (Camb) 2015;51:7867–70. doi: 10.1039/c4cc09642h. [DOI] [PubMed] [Google Scholar]
- 29.Blum ML, et al. A structural motif in the variant surface glycoproteins of Trypanosoma brucei. Nature. 1993;362:603–9. doi: 10.1038/362603a0. [DOI] [PubMed] [Google Scholar]
- 30.Blanc E, et al. Refinement of severely incomplete structures with maximum likelihood in BUSTER-TNT. Acta Crystallogr D Biol Crystallogr. 2004;60:2210–21. doi: 10.1107/S0907444904016427. [DOI] [PubMed] [Google Scholar]
- 31.Emsley P, Lohkamp B, Scott WG, Cowtan K. Features and development of Coot. Acta Crystallogr D Biol Crystallogr. 2010;66:486–501. doi: 10.1107/S0907444910007493. [DOI] [PMC free article] [PubMed] [Google Scholar]
- 32.Yang N, Zhang H, Wang M, Hao Q, Sun H. Iron and bismuth bound human serum transferrin reveals a partially-opened conformation in the N-lobe. Sci Rep. 2012;2:999. doi: 10.1038/srep00999. [DOI] [PMC free article] [PubMed] [Google Scholar]
- 33.Garman EF, Grime GW. Elemental analysis of proteins by microPIXE. Prog Biophys Mol Biol. 2005;89:173–205. doi: 10.1016/j.pbiomolbio.2004.09.005. [DOI] [PubMed] [Google Scholar]
- 34.Grime GW, Dawson M, Marsh M, McArthur IC, Watt F. The Oxford submicron nuclear microscopy facility. Nuclear Instruments and Methods in Physics Research Section B: Beam Interactions with Materials and Atoms. 1991;54:52–63. [Google Scholar]
- 35.Maxwell JA, Teesdale WJ, Campbell JL. The Guelph PIXE software package II. Nuclear Instruments and Methods in Physics Research Section B: Beam Interactions with Materials and Atoms. 1995;95:407–421. [Google Scholar]
- 36.Grime GW. The “Q factor” method: quantitative microPIXE analysis using RBS normalisation. Nuclear Instruments and Methods in Physics Research Section B: Beam Interactions with Materials and Atoms. 1996;109–110:170–174. [Google Scholar]


