Abstract
Flaviviruses, including dengue virus (DV) and Zika virus, extensively remodel the cellular endomembrane network to generate replication organelles that promote viral genome replication and virus production. However, it remains unclear how these membranes and associated cellular proteins act during the virus cycle. Here, we show that atlastins (ATLs), a subset of ER resident proteins involved in neurodegenerative diseases, have dichotomous effects on flaviviruses with ATL2 depletion leading to replication organelle defects and ATL3 depletion to changes in virus production pathways. We characterized non-conserved functional domains in ATL paralogues and show that the ATL interactome is profoundly reprogrammed upon DV infection. Screen analysis confirmed non-redundant ATL functions and identified a specific role for ATL3, and its interactor ARF4, in vesicle trafficking and virion maturation. Our data identify ATLs as central hubs targeted by flaviviruses to establish their replication organelle and to achieve efficient virion maturation and secretion.
Keywords: Flavivirus, Dengue virus, Zika virus, Atlastin, virus replication organelle, ER membrane structure, membrane fusion, vesicle transport, virus-host interactions
Introduction
Viruses of the Flavivirus genus, including dengue virus (DV), Zika virus (ZV), and West Nile virus (WNV), comprise the most prevalent arthropod-borne pathogens responsible for high morbidity and mortality. The high prevalence and current lack of effective treatments make these flaviviruses a significant global health concern1,2.
Flavivirus RNA genomes have positive-strand polarity, and after entry into cells, are translated at the rough endoplasmic reticulum (ER) to produce a viral polyprotein that is cleaved into individual proteins. Some of these proteins induce rearrangement of ER membranes creating an environment conducive to viral replication (reviewed in3). For DV and ZV, these rearrangements include 80-100 nm diameter invaginated vesicles forming extended arrays designated vesicle packets (VPs). These vesicles are the presumed site of viral replication and hence, regarded as the viral replication organelle (RO). In addition, virus particles bud into the ER lumen4–6. Though the morphology of membrane rearrangements has been well characterized the specific host and viral factors and the mechanisms involved in membrane reorganization are poorly understood.
The ER is the largest cellular organelle and is composed of several subdomains ranging from perinuclear membrane sheets to tubule-like structures that extend through the cell periphery. This ER tubule network links many cellular organelles and is involved in numerous processes (reviewed in7). ER tubule morphology is maintained by distinct membrane shaping and fusion proteins including the membrane-bending reticulon (RTN) and REEP protein families as well as atlastins (ATLs) and Lunapark8, 9. ATLs are ER resident membrane-bound GTPases of the dynamin family of membrane fusion proteins and required for production of ER tubules in vitro (reviewed in10). The disruption of ATL function leads to the formation of long, unbranched ER tubules, implicating ATLs as ER fusogens maintaining branched ER tubule networks11–15. Additionally, specific mutations in ATLs have been linked to neurodegenerative diseases including hereditary spastic paraplegia16–20. Therefore, ATLs are key cellular factor in regulating ER function and important factors in human disease.
In mammalian cells, the 3 ATL paralogues are differentially expressed with ATL1 being expressed primarily in neural cells, and ATL2 and ATL3 more ubiquitously14. The functions of the 3 mammalian ATLs are described as mostly redundant, only differing in the efficiency of membrane fusion21. ATLs have also been linked to other cellular processes such as lipid droplet dynamics, endosomal transport, mitochondrial lipid exchange, selective autophagy, and inner nuclear membrane protein insertion22–25. Moreover, ATLs may have a membrane tethering function independent of membrane fusion activity10, 26. Though their ER tubule membrane fusion activity has been well documented, specific functions of ATLs in connection with other cellular structures remain largely elusive.
Here, we demonstrate that ATLs are host factors exploited by both DV and ZV. Our data show that the two most prevalent ATL homologues in non-neural cells have divergent roles with ATL2 primarily required in the formation of the viral ROs and ATL3 for production of infectious virus particles. Additionally, we show that DV causes reprogramming of the ATL interactome, and establish a link between ATL3 and the vesicle trafficking pathway required for virion maturation.
Results
Divergent roles of Atlastins in flavivirus RNA replication and virion formation
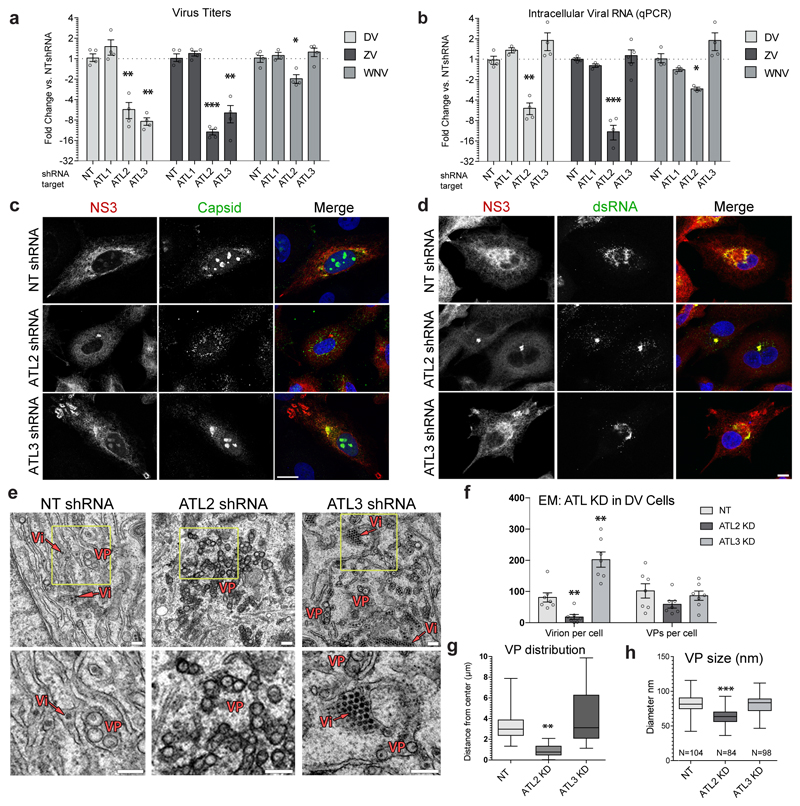
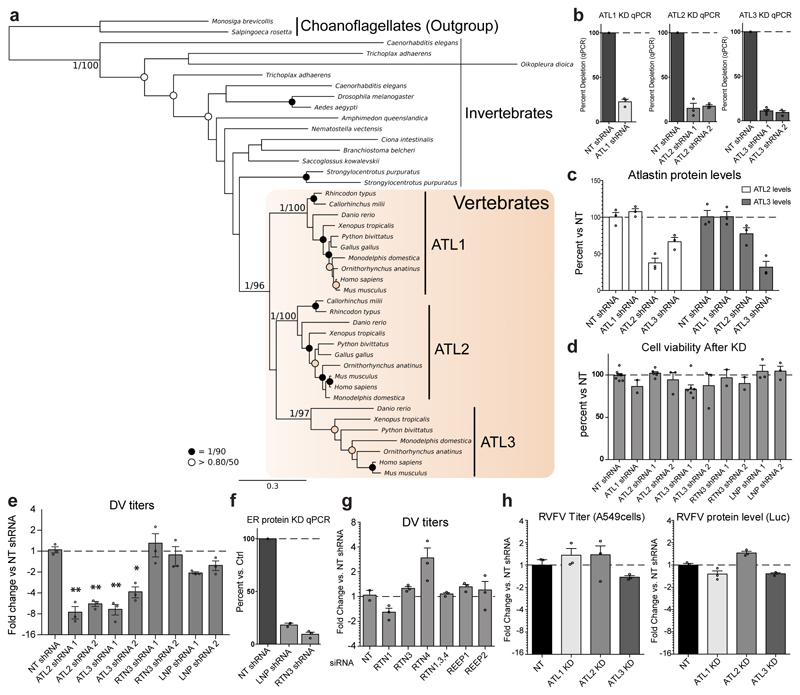
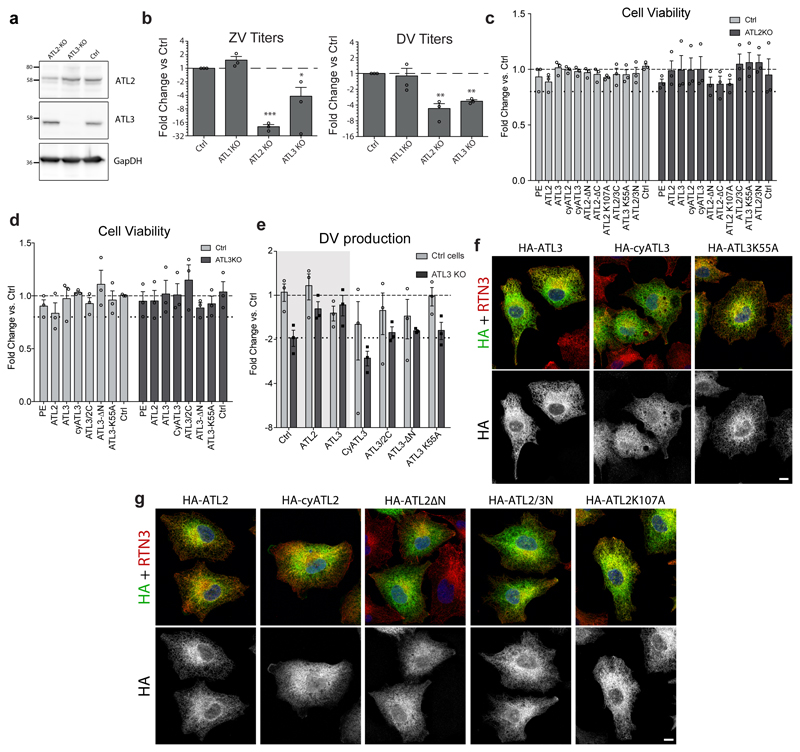
The intimate relationship between the ER and flavivirus replication, and the critical involvement of ATLs in forming and maintaining the ER tubule network prompted us to investigate the role of ATLs in ER membrane reorganization induced by flavivirus infection. To examine this, we first determined the effects of reducing each of the 3 mammalian ATL paralogues (ED Fig. 1a) on virus production (ED Fig. 1b-1d). In infected cells, knockdown of either ATL2 or ATL3, but not ATL1, significantly reduced DV and ZV production compared to cells expressing the non-target (NT) shRNA (Fig. 1a; ED Fig. 1e for additional shRNAs). Additionally, ATL2 depletion also reduced WNV titers whereas ATL3 depletion had no effect. Notably, ATL3 is not present in birds (ED Fig. 1a), one of the WNV host species. Depletion of other ER shaping proteins did not significantly alter flavivirus titers, arguing for ATL-specific effects (ED Fig. 1d-g). ATL depletion did not alter Rift Valley fever virus (RVFV – a negative-strand RNA virus) titers indicating that the role of ATL2 and ATL3 in virus infection might be limited to a subset of viruses or specifically, to flaviviruses (ED Fig. 1h).
Figure 1. Impact of atlastin depletion on flavivrus replication.
A549 cells were transduced with the indicated shRNA constructs for 48 h followed by infection with DV (DV-2), ZV (strain H/PF/2013) or WNV (strain NY99) for 48 h. Virus titers (a) and intracellular viral RNA (b) were quantified, protein/dsRNA localization was determined (c-d). a, Graphs show the mean fold change in PFU/mL relative to the non-target (NT) shRNA cells (set to 1), error bars show SEM. N=4 biological replicates. b, Graphs show the mean fold change in viral RNA levels relative to the NT shRNA cells (set to 1), error bars show SEM. N=4 biological replicates. For a and b statistical significance was determined using one-way ANOVA with a Dunnett’s multiple comparison analysis. * , ** , and *** represent p values < 0.05, 0.01 or 0.001, respectively. c-d, Cells were fixed with PFA and viewed by immunofluorescence microscopy using antibodies of given specificities. Images are representative of 3 independent experiments. Scale bars, 10μm. e, Cells were fixed and processed for viewing by TEM. Vesicle packets (VP) and virions (Vi) are highlighted. A VP was defined as array of >2 connected vesicles residing at the same of the ER lumen. Yellow boxes show the region of magnification displayed on the bottom. Images are representative of 3 biological replicates. Scale bars, 200 nm. f, Numbers of virions and vesicle packets were calculated for each condition (N=7 cells/condition). Graphs show the mean number per cell counted, error bars represent SEM. g, Graph shows the mean diameter of vesicles contained in VPs for each treatment. N=200 vesicles for each condition. h, Graph shows the mean distribution of VPs within shRNA transduced cells as measured from a central focus (N=6 cells/treatment). Box plots, box shows 25th-75th percentile; whiskers show min to max; line shows the mean value. For f, g, and h, ** and *** represent p values < 0.01 or 0.001, respectively as determined by 2-tailed T-test.
We next evaluated the effect of ATL2 or ATL3 depletion on viral genome replication. While we observed no effect of ATL1 depletion on flavivirus RNA production, knock down of ATL2 significantly reduced viral RNA levels in DV, ZV or WNV infected cells (Fig. 1b), but not in RVFV infected cells (ED Fig. 1h). Interestingly, though ATL3 depletion reduced DV and ZV titers, there was no significant reduction in viral RNA levels. These results indicate that ATL2 and ATL3 support flavivirus infection and suggest that, for DV, ZV and WNV, ATL2 has a role in viral RNA replication whereas ATL3 influences DV and ZV assembly or virion release. Moreover, the phenotypic differences between ATL2 or ATL3 depletion in virus infection indicate non-redundant roles for these ATLs.
Atlastin depletion alters formation of the membranous flaviviral replication organelle
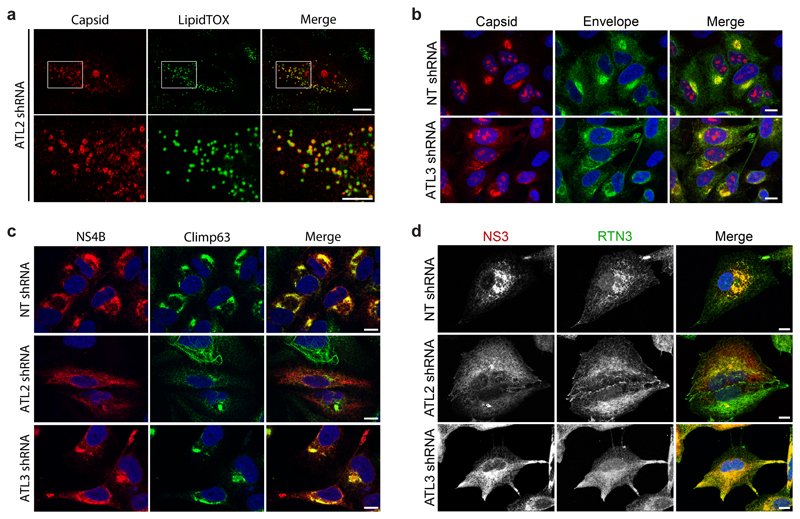
To further dissect the differential roles of ATLs in flavivirus replication or assembly, we examined virus protein localization (Fig. 1c-d). In DV infected control cells, NS3 was distributed throughout the cytoplasm with enrichment in larger perinuclear regions, which also contained double strand (ds)RNA and small amounts of capsid protein (Fig. 1c-d top rows). In ATL2 depleted cells the majority of the NS3 and dsRNA signal was localized to a relatively small nucleus-proximal focus, while capsid protein was observed to be enriched in cytosolic foci surrounding lipid droplets (Fig. 1c-d middle rows; ED Fig. 2a, respectively). In ATL3 depleted cells, both capsid and dsRNA fluorescence patterns were similar to control cells. However, viral non-structural proteins as well as envelope (Env) protein accumulated at the cell periphery in regions enriched for the ER tubule marker reticulon 3 (RTN3), but not the ER sheet marker Climp63 (Fig. 1c-d, bottom rows; ED Fig. 2b-d).
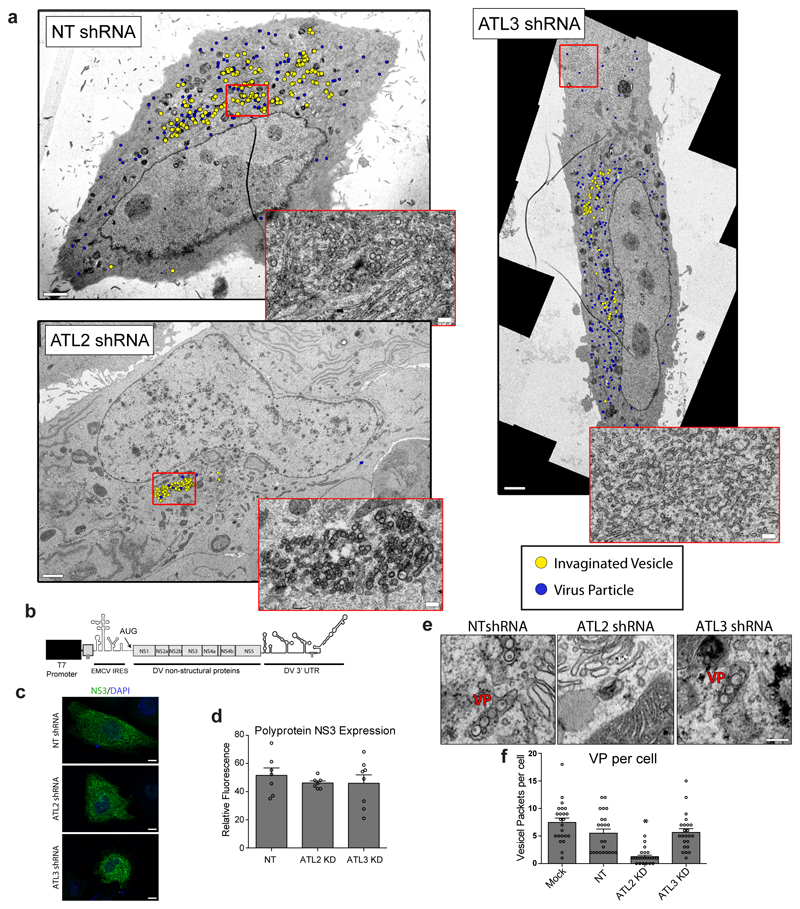
Next we examined the role of ATLs in DV infection using electron microscopy (EM) to visualize possible changes in virus-induced ROs upon ATL depletion (Fig. 1e). Consistent with previous studies, in control cells infected with DV we observed the formation of VPs as well as ER-wrapped virions (~30 nm-diameter electron dense dots) (Fig. 1e; ED Fig. 3a). In ATL2 depleted cells, similar numbers of invaginated vesicles were observed (Fig. 1f; ED Fig. 3a); however, the vesicles were condensed to a small perinuclear region (Fig. 1g; ED Fig. 3a), and the vesicle size and shape were distorted (Fig. 1c-e, 1h). Additionally, very few intracellular virus particles were observed in ATL2 depleted cells (Fig. 1e-f; ED Fig. 3a). In ATL3 depleted cells, there was no significant effect on VP numbers or morphology, but an increase in the overall number of intracellular virus particles, accumulating in paracrystalline structures within the lumen of ER cisternae (Fig. 1e-f; ED Fig. 3a). Accumulation of ER tubular networks at the cell periphery was also observed by TEM in ATL3 depleted cells (ED Fig. 3a), which, together with our immunofluorescences data (Fig. 1c; ED Fig. S2c-d), indicate that ATL3 might play a role in membrane trafficking.
To determine whether the ATL2 depletion effects on RO morphology were a result of decreased viral replication or due to specific defects in VP formation we utilized an expression based system that induces VP formation independent of viral replication (ED Fig. 3b). We found that, even though virus NS protein levels were not altered (ED Fig. 3c-d), significantly fewer VPs were formed in ATL2 depleted cells compared to control or ATL3 depleted cells (ED Fig. 3e-f). Together, these data suggest that ATL2 has a role early in viral replication, specifically in RO formation, and ATL3 is required at later stages of the DV replication cycle, likely having a role in virion trafficking and/or release from the cell.
Atlastins differentially associate with viral proteins
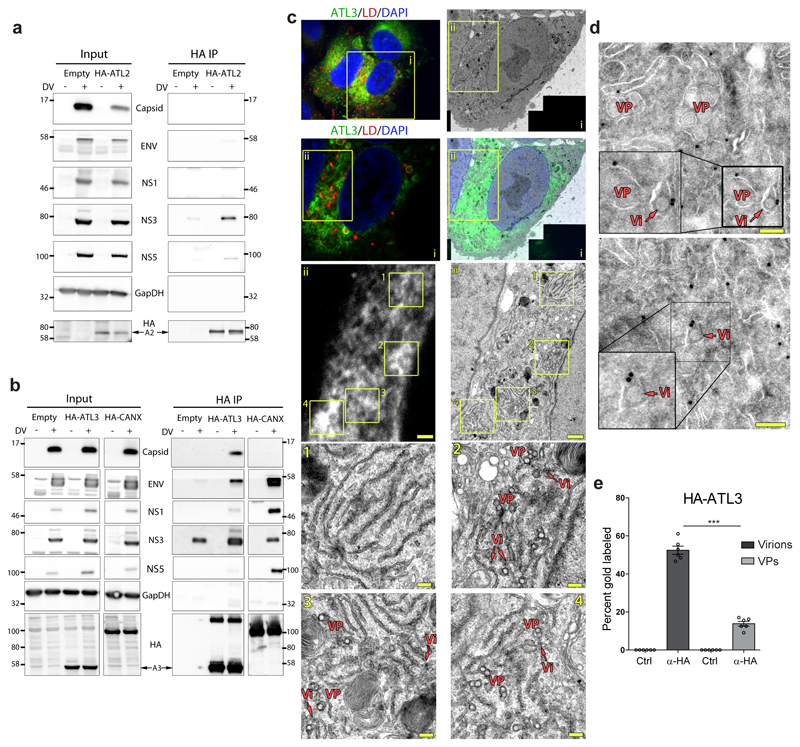
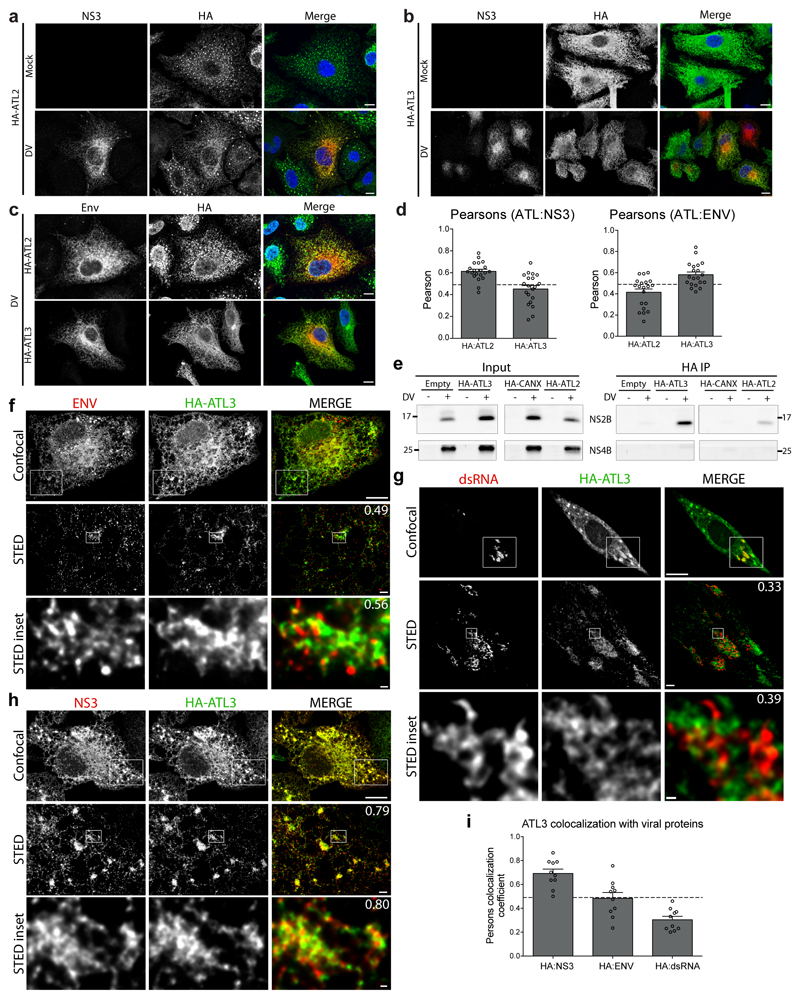
We next examined whether the localization of ATLs was altered during infection. In DV infected cells expressing HA-tagged ATL2 or ATL3 we found that fluorescent signals for both ATLs were enriched in regions containing DV NS3 or Env protein (ED Fig. 4a-c). Of note, ATL2 had a slightly higher colocalization with NS3 whereas ATL3 had a higher colocalization with DV Env protein (ED Fig. 4d). To test for interaction between viral proteins and ATLs, we performed coimmunoprecipitation experiments using HA-tagged ATLs or an HA-tagged calnexin (CANX) control (Fig. 2a-b). Consistent with previous reports, CANX associated with viral glycoproteins Env and NS1, and, to a lesser extent, with NS3 and NS5. Both HA-ATL2 and HA-ATL3 associated with NS3, NS5 and NS2B, components of the viral replicase (Fig. 2a-b; ED Fig. 4e); however, associations between viral proteins and HA-ATL2 were relatively weak. Additionally, ATL3 associated with NS1 and the structural proteins Env and capsid (Fig. 2b). Neither ATL2 nor ATL3 associated with NS4B demonstrating specificity (ED Fig. 4e). These results indicate transient or indirect interactions between ATLs and viral non-structural proteins, and stronger associations between ATL3 and the structural proteins, in particular capsid, which correlates with a viron assembly or release role for ATL3 in flavivirus infection.
Figure 2. Atlastins associate with DV proteins.
a-b, A549 cells stably expressing HA-ATL2, HA-ATL3, HA-Calnexin (CANX) or an empty plasmid were infected with DV for 48 h. Cells were lysed and HA-tagged proteins were immunoprecipitated with anti-HA beads. Inputs and precipitated proteins were determined by western blot and probing for the indicated proteins. GapDH served as loading and specificity control. Panels are representative of 3 biological replicates. Breaks between adjacent blots indicate lanes not relevant to the experiment were removed. c, A549-derived cells expressing endogenously tagged ATL3 were grown in Mattek gridded dishes and infected with DV. After 48 h, cells were fixed with paraformaldehyde and glutaraldehyde followed by lipidTOX staining to visualize lipid droplets (LD) and imaging by confocal microscopy. Cells were then immediately embedded and processed for EM imaging using grid numbers as a reference. Correlation of light microscopy and EM images was done with Fiji software using lipid droplets as correlation marker. Images are representative of 3 independent samples. Scale bars: panel ii, 1μm; panels 1 - 4, 200 nm. d, A549 cells stably expressing HA-ATL3 were infected with DV for 48 h. Cells were processed using the Tokuyasu protocol and labeled with HA-epitope targeting 10 nm gold beads. For EM images, VP denotes areas containing vesicle packets and Vi denotes regions containing virions. Scale bars, 100 nm. e, Quantification of the number of virions or vesicle packets containing proximal immune-gold staining pertaining to either a control antibody or an HA specific antibody. Graph shows the mean value for 6 cells from 2 biological replicates. For each sample, >100 Vi or VP structures were counted. ***, p values < 0.001 as determined by 2-tailed T-Test.
ATL3 is associated with viral assembly sites
To determine if ATL3 is recruited to regions of virus assembly, HA-ATL3 expressing cells infected with DV were co-stained for HA and several viral proteins or dsRNA, followed by super resolution imaging using STED microscopy (ED Fig. 4f-h). Image quantification revealed that ATL3 colocalizes with both viral non-structural (NS3) and structural proteins (Env), but not with dsRNA, indicating that ATL3 is not associated with sites of viral RNA replication (ED Fig. 4f-i).
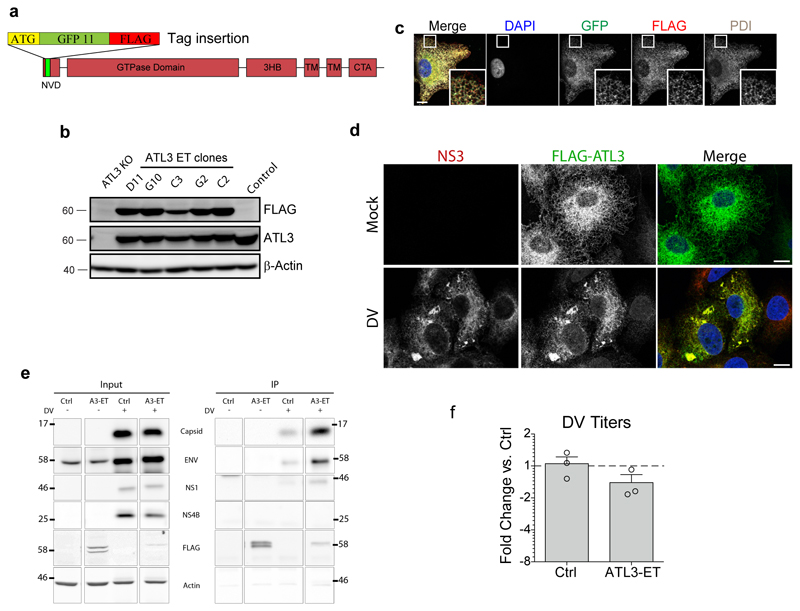
To more precisely define the DV RO subsites enriched for ATL3, we used correlative light electron microscopy (CLEM). To avoid overexpression artifacts we endogenously tagged ATL3 to allow detection of endogenous ATL3 with either the FLAG epitope or the split GFP11 system in A549 cells (ED Fig. 5a)27. In the selected cell clone, designated A549-ATL3-ET-GPF, endogenously tagged (ET)-ATL3 colocalized with the ER marker PDI (ED Fig. 5b-c) and showed consistent localization and interaction profiles to HA-tagged ATL3 (ED Fig. 5d-e). Importantly, A549-ATL3-ET-GFP cells produced levels of infections DV comparable to naïve cells (ED Fig. 5f). These cells were used to correlate ATL3-GFP fluorescence signal with membrane structures using CLEM (Fig. 2c). ATL3 signal was enriched in regions with high numbers of VPs and virus particles (Fig. 2c lower panels), but not in regions containing just ER membranes (Fig. 2c, EM subpanel 1), confirming that ATL3 is recruited to DV ROs where RNA replication and virion assembly occur in close proximity5. To differentiate between these two sites, we refined our analysis by using immune EM (Fig. 2d) and observed enrichment of ATL3-specific gold particles at membranes surrounding virions, but only sporadic labeling was found at VPs (Fig. 2e). These results suggest that ATL3 is specifically associated with cytoplasmic transport vesicles containing individual virions in close proximity to viral replication complexes, further indicating a specific role for ATL3 in virus assembly, distinct from the role of ATL2 in RO formation.
Domains in ATL that are functionally interchangeable and required for the DV replication cycle
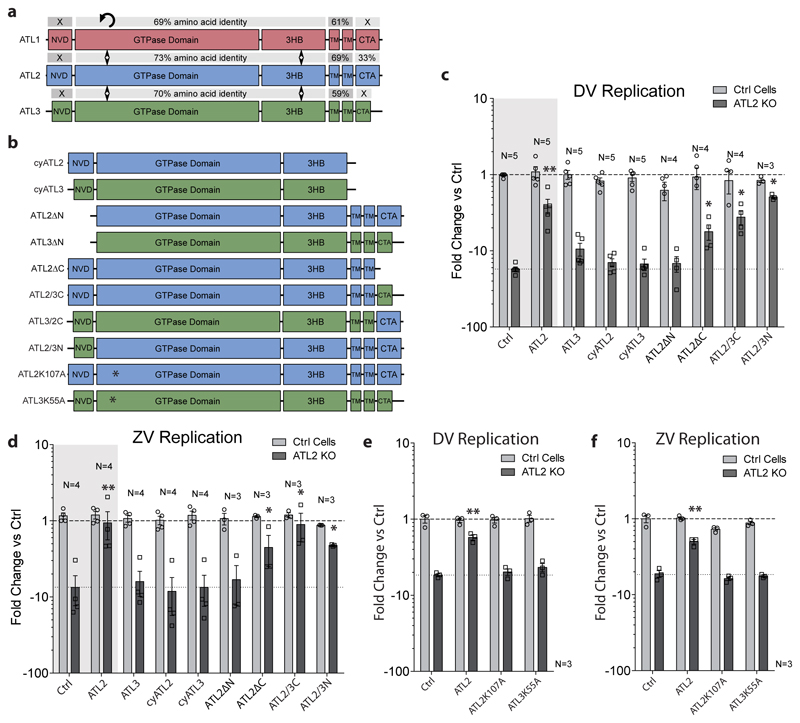
The phenotypic difference between ATL2 and ATL3 in DV infection provided us with a unique opportunity to evaluate functional differences between these two cellular proteins that are generally perceived as having largely redundant roles10, 14. To this end, we generated ATL chimera to characterize subdomains responsible for redundant or unique functions (Fig. 3). ATL protein sequences alignments revealed that the middle domains were highly conserved between all 3 paralogues, while the N-terminal variable domain (NVD) and the C-terminal amphipathic-helix (CTA) domains have little amino acid sequence identity (Fig. 3a). This suggests that NVD and CTA confer major functional differences between ATL2 and ATL3. To test this, we performed a domain-swap analysis using the ATL-dependent viral replication or assembly defect as phenotypic readouts. A549 ATL knock-out (KO) cell pools (ED Fig. 6a-b) were transduced with constructs encoding for wild type or mutant ATLs (Fig. 3b), followed by infection with either DV or ZV. None of the expression constructs had a significant effect on cell growth and, in control (Ctrl) cells, no significant changes in viral RNA replication were observed (Fig. 3c-f; ED Fig. 6c-d). For either ATL2 KO or ATL3 KO cells, expression of the respective wildtype protein rescued virus replication or assembly/release (Fig. 3c-d; ED Fig. 6e – grey regions).
Figure 3. Mapping of functional domains of ATLs involved in the DV replication cycle.
a, Sequence comparison of human ATL1, ATL2, and ATL3 proteins, showing the amino acid sequence identity of each annotated domain. Sequences were aligned using the NCBI BLAST server. NVD, N-terminal variable domain; 3HB, three-bundle Helix; TM, transmembrane region; CTA, C-terminal amphipathic-helix domain. b, Schematic representation of ATL2 and ATL3 mutant constructs used for rescue experiments. Names of expressed proteins are given on the left. c-f, ATL2 knockout or control cells were transduced with lentivirus encoding for the ATL variant given on the bottom of each panel. 24 h after transduction, cells were infected with DV-R2A (c and e) or synZV-R2A (d and f) for 48 h. Graphs show viral replication expressed as average fold change in RLU/mL relative to control cells transfected with the empty plasmid (Ctrl). Numbers above each bar pair in c and d refers to the number of independent experiments. Lower dashed line indicates the difference between ATL2 KO cells and ctrl cells, both transduced with an empty plasmid. For all graphs, error bars represent SEM; * or ** represent p values < 0.05 or 0.01, respectively calculated by one-way ANOVA with a Dunnett’s multiple comparison analysis.
Analysis of ATL2 mutations showed a significant rescue of replication for both DV and ZV in cells expressing the C-terminal truncation ATL2ΔC or ATL2/3C (Fig. 3c-d). Interestingly, though expression of either ATL3 or ATL2ΔN did not rescue the ATL2 KO phenotype, expression of the ATL2/3N did. Expression of any of the other ATL mutants did not restore virus replication in the ATL2 KO cells. Similar N-terminal domain requirements were observed for ATL3 however, the window to measure rescue was low, making statistical significance difficult to determine (ED Fig 6e). Notably, the GTPase null mutants, ATL2K107A or ATL3K55A, did not rescue virus replication, indicating that ATL GTPase activity is important for both DV and ZV replication (Fig. 3e-f; ED Fig. S6e). The inability of specific mutants to rescue the viral phenotype was not linked to significant changes in protein localization (ED Fig. 6f-g). These results suggest that the NVDs of ATL2 and ATL3 are functionally interchangeable and that the C-terminal region of ATL2 is dispensable, at least regarding virus replication, indicating that the NVD and CTA domains confer functional difference between ATL2 and ATL3.
Comparative ATL interactomes and their reprograming during DV infection
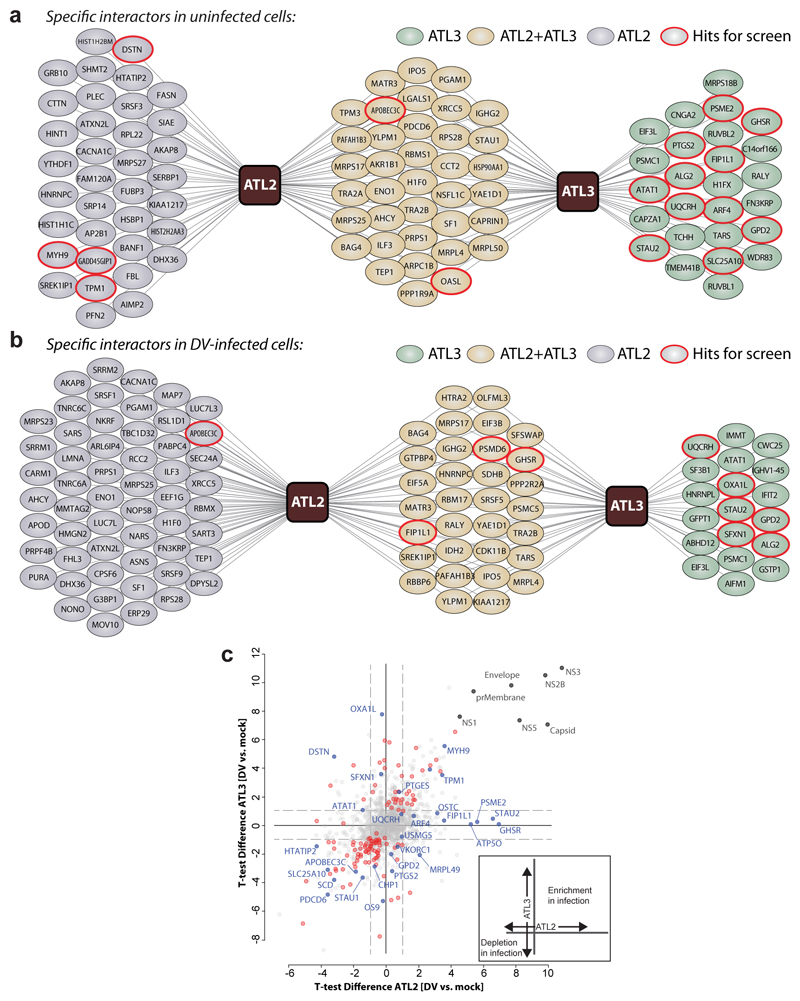
Having found that flaviviruses selectively exploit ATLs, we hypothesized that virus infection might alter the interactome of ATL2 and ATL3 and this information should provide mechanistic insights. Therefore, we performed an unbiased proteomic survey to identify cellular proteins specifically associating with individual ATLs and flaviviral perturbation of these complexes. We employed overexpression cell lines with cellular protein profiles comparable to control cells, confirming their suitability for the analysis. (ED Fig. 7). Cells were mock-infected or infected with DV and subjected to affinity purification and mass spectrometry to determine proteins associating to ATL2 or ATL3 (Fig. 4a-b; ED Fig. 8a-b; SI Table 8). In mock cells we identified 99 proteins associating with either ATL2 or ATL3, 36 of which were specific to ATL2 and 26 specific to ATL3. In DV infected cells 108 ATL specific interactors were identified, 56 of which were specific to ATL2 and 19 specific to ATL3. Of note, for both ATL2 and ATL3, DV infection led to dynamic changes in their cellular protein associations (Fig. 4b-c). These data provide an overview of ATL2 and ATL3 interactomes as well as insights into cellular functions of ATLs and how DV manipulates these interaction profiles (Fig. 4; ED Fig 8a-b; SI Table 8).
Figure 4. Comparative ATL interaction networks.
a-b, Network representation of unique and shared ATL2- and ATL3-interacting cellular proteins. AP–LC–MS/MS analysis of HA-tagged ATLs in comparison to Calnexin (CANX). N = 4 independent experiments; significance testing are results from Welch’s T-test. a, Solid lines represent specific interactors identified by AP–MS/MS analysis of naïve A549 cells (log2(fold change) ≥ 2.5, unadjusted two-sided p ≤ 0.05). b, Solid lines represent specific interactors identified by AP–MS/MS analysis of DV-infected A549 cells (log2(fold change) ≥ 1), unadjusted two-sided P ≤ 0.05). c, The scatter plot displays ATL2 (x-axis) and ATL3 (y-axis) specific changes in uninfected compared to DV infected cells. Virus proteins (grey), significant enrichment or depletion (red) and specific hits selected for RNAi screen (blue) are shown. Significantly enriched or depleted proteins are shown in red (n = 4 independent experiments; Welch’s T-test unadjusted two-sided p ≤ 0.05; log2(fold-change) ≥ 1). A schematic of the variables compared is shown on the bottom right.
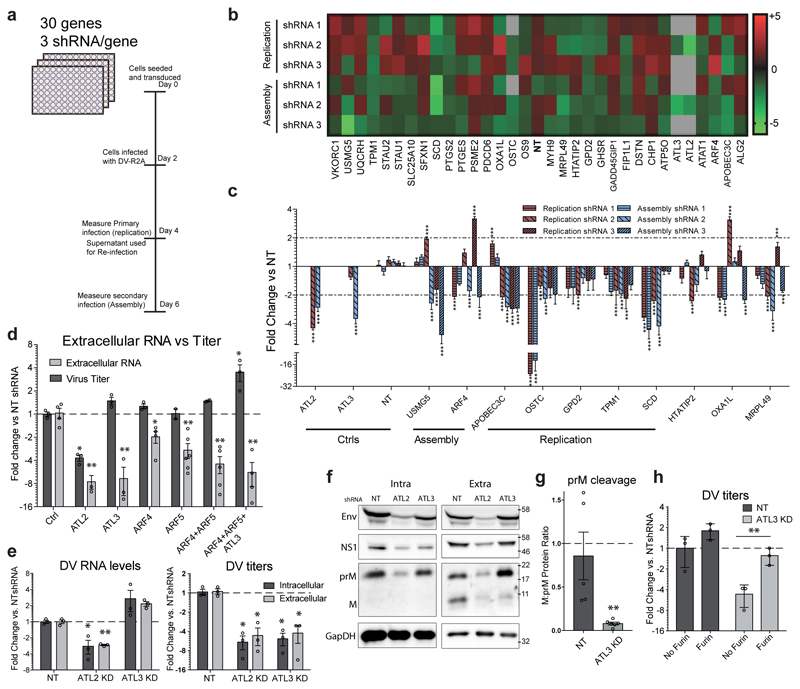
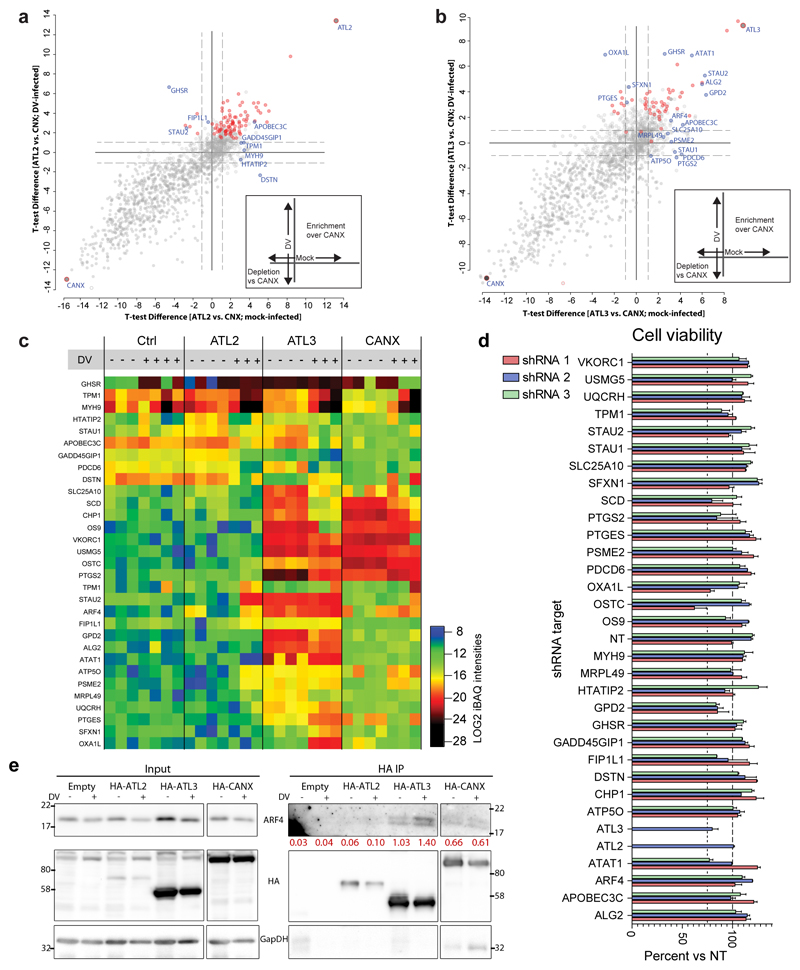
To assess the functional relevance of ATL-associated proteins in the flavivirus replication cycle, we selected 30 ATL interacting proteins exhibiting altered binding profiles during infection or specific enrichment over CANX (Fig. 4c; ED Fig. 8a-c), and evaluated the consequences of gene silencing on virus replication or assembly/release (Fig. 5a-c; ED Fig 8d). These experiments identified 10 host factors critically required for DV infection, 5 of which were previously unlinked to flavivirus replication (Fig. 5b-c). Importantly, for several of these factors, we observed phenotypes similar to those seen for the respective ATL.
Figure 5. ATL3 and its interactor ARF4 play important roles in DV maturation.
a, Experimental approach used for the shRNA screen. A549 cells were transduced with shRNA encoding lentivirus (3 different shRNAs/gene). 48 h post transduction, cells were infected with DV-R2A for 48 h followed by quantification of intracellular luciferase levels (replication). Supernatant from infected cells was then used to infect naïve A549 cells for 48 h and luciferase levels were quantified (Assembly/release). b, The heat map shows the mean fold difference between gene specific shRNA treated cells and NT shRNA treated cells. c, Graph shows the mean fold change for genes with the most significant effect on viral replication or assembly. N=6 independent samples; ***, p value < 0.001 calculated by one-way ANOVA with a Dunnett’s multiple comparison analysis. d-h, A549 cells were transduced with constructs encoding for gene-specific or non-targeting (NT) shRNA for 48 h, followed by infection with DV for 48 h. d, Graph shows the mean values for extracellular viral RNA (RT-qPCR) or titers (PFU assay) compared to control cells. e, The left graph shows the average fold change in intracellular or extracellular viral RNA levels over 3 experimental replicates. The right graph shows the average fold change in PFU/mL (PFU assay) for intracellular and extracellular virus over 3 experimental replicas. f-g, Intracellular and extracellular proteins were evaluated using western blot. g, Extracellular protein levels for prM and M were quantified using Fiji software. Graphs show average ratio between M and prM protein for NT shRNA and ATL3 shRNA transduced cells for 3 independent experiments. h, Virus particles in supernatants harvested from infected cells were purified using ultracentrifugation and incubated with purified furin. Graph shows the average fold change in PFU/mL (PFU assay) before and after furin treatment for ATL3 shRNA treated cells compared to NT shRNA treated cells over 3 independent experiments. For all graphs, error bars show SEM; * or **, p values < 0.05 or 0.01, respectively as determined by 2-tailed T-tests.
Among the specific interactors that affected the flavivirus replication cycle we found ADP-ribosylation factor 4 (ARF4), a protein that has previously been linked to protein trafficking, vesicle budding and uncoating28. Upon knock-down of ARF4, all three shRNAs consistently impaired virus assembly/release to a similar extent as ATL3 depletion (Fig. 5c). Immunoprecipitation experiments confirmed the interaction of ATL3 and ARF4, as well as the enhanced ATL3-ARF4 association upon DV infection (ED Fig. 8e). Consistent with previous findings29, we also found that co-depletion of ARF4 and ARF5 had an increased effect on limiting DV assembly or release compared to cells depleted of only ARF4 or ARF5 (Fig. 5d; ED Fig. S9a).
Depletion of ATL3 or ARF4/5 limits maturation of viral particles
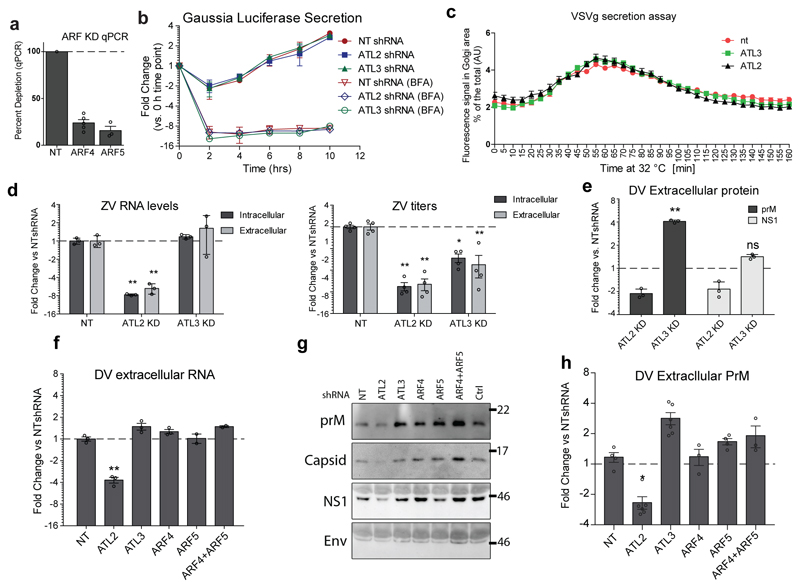
ARF4 and ARF5 have been previously linked to regulating traffic between the ER and Golgi as well as secretion of DV subviral particles 30–32. To better understand the relationship between ARF and ATL3, we evaluated the effects of ATL3 depletion on trafficking. First we confirmed that ATL3 depletion had no effect on secretion of a Gaussia luciferase reporter that follows a constitutive secretory pathway, and did not impair the transport of a vesicular stomatitis virus G protein from the ER to the Golgi (ED Fig. 9b-c)33. Next we determined whether ATL3 depletion limits flavivirus particle secretion by evaluating intra- and extracellular levels of viral RNA, titers of infectious virions, and virus protein accumulation (Fig. 5e-g; ED Fig. 9d-h). Knockdown of ATL3 had limited effects on intracellular DV or ZV RNA or protein levels, but profoundly reduced virus titers (Fig. 5e; ED Fig 9d). Notably, extracellular DV RNA levels did not decrease (Fig. 5e) but uncleaved DV prM accumulated, compared to its cleavage product M, in ATL3 depleted cells (Fig. 5f-g; ED Fig. 9e). Moreover, accumulation of extracellular PrM was also observed for ARF4 or ARF5 depletion, and especially upon co-depletion (ED Fig. 9f-h).
To determine if the increased levels of extracellular prM and viral RNA pertained to immature virions or aberrant virus particles caused by defects in the assembly process we performed a virus reactivation assay34. Virions released from ATL3 knockdown cells were more efficiently activated following furin cleavage compared to virus from control cells (Fig. 5h). These results show that ATL3 as well as ARF4 and ARF5 play an important role in the maturation of flavivirus particles.
Depletion of ATL3 limits recycling of Furin
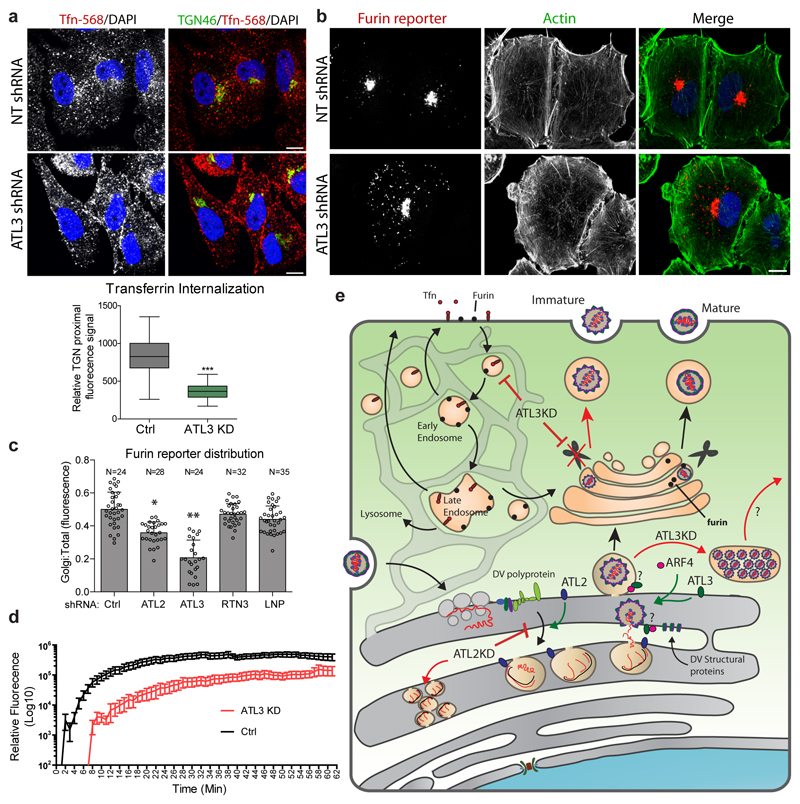
In addition to roles in secretory pathways, ARF4 has been linked to retrograde trafficking in cells when depleted together with either ARF1 or ARF5, and ARF5 has specifically been linked to internalization at the plasma membrane30, 35, 36. Therefore, we hypothesized that ATL3 might function in coordination with ARF4 to regulate vesicular trafficking. To test this, we evaluated the effects of ATL3 on Tfn recycling. In NT shRNA expressing cells, high levels of Tfn-568 associated fluorescence signal accumulated in close proximity to the trans-Golgi network (TGN) (Fig. 6a). In contrast, in ATL3 depleted cells the majority of the Tfn-568 signal resided at the cell periphery suggesting either an increase in recycling or a limitation in transport to the late endosome or endosomal sorting body.
Figure 6. ATL3 depletion alters retrograde transport.
a, A549 cells were transduced with constructs encoding for shRNA directed against ATL2, ATL3 or a non-targeting (NT) shRNA. 96 h after transduction, cells were serum starved for 30 mins followed by incubation with Alexa fluor 568-conjugated transferrin (Tfn-568) for 40 mins. Cells were then fixed and stained for the trans-Golgi marker TGN46 using specific antibodies. Cells were analyzed by confocal microscopy (upper panel). Scale bars, 10 μm. The relative levels of Tfn-568 signal proximal to the TGN46 signal in control or ATL3 depleted cells is shown in the lower panel. Box, 25th-75th percentile; line shows mean value; Whiskers, min to max. N=52 cells were counted per sample over 2 biological replicates. ***, p value < 0.001 based on 2-tailed T-Test,. b-d, A549 cells stably expressing the furin reporter (CD4-Fu) were transduced with constructs encoding for shRNA directed against the indicated gene or a NT shRNA. b, 72 h after transduction, cells were fixed and the subcellular localization of the furin reporter was evaluated using immunofluorescence staining and confocal microscopy. N=3 biological replicates. c, Total cellular fluorescence and Golgi fluorescence were quantified and calculated for ≥20 cells for each condition. The graph shows the mean ratio between Golgi and total cellular fluorescence levels. Error bars show SEM. RTN3, reticulon 3; LNP, lunapark. d, 72 h post transduction, cells were imaged at 1 minute intervals. Following the 2 min time point, anti-CD4 fluor-conjugated antibodies were added and imaging continued for 1 h. Graphs shows mean total cellular fluorescence levels for ≥20 cells at each time point. N=3 biological replicates. e, Model for the function of ATLs in flavivirus infection, highlighting the role of ATL2 in VP formation and ATL3 in virus particle maturation and vesicular transport.
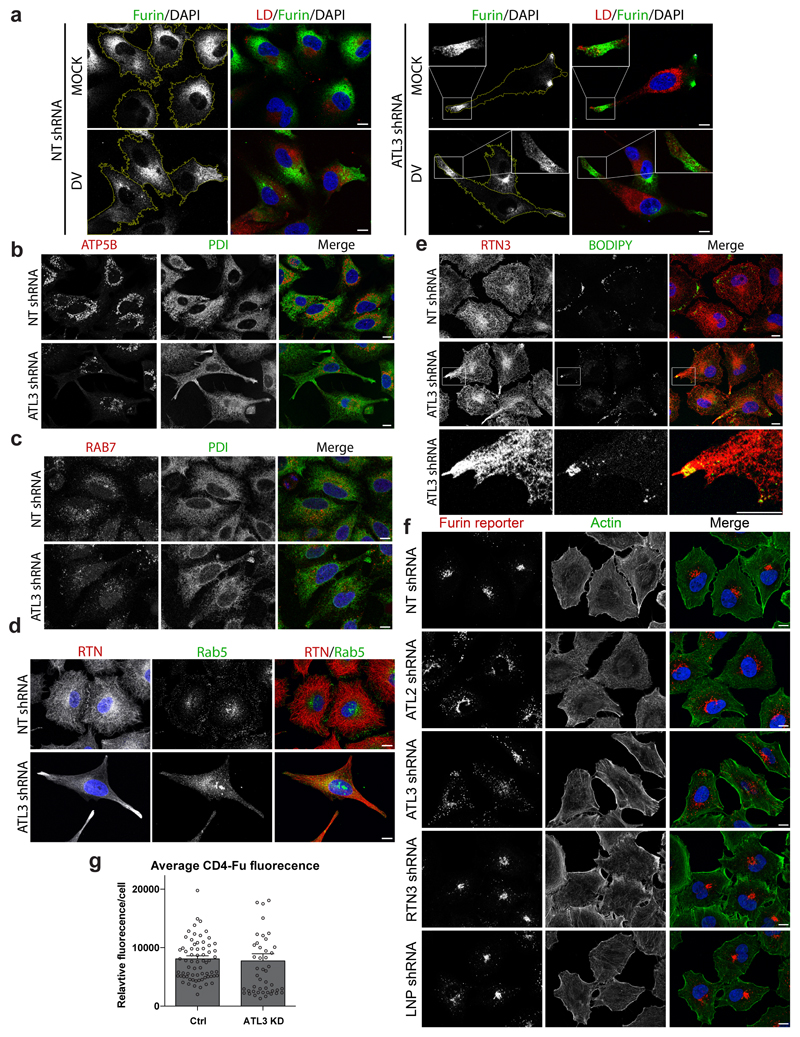
To determine how this defect is linked to virus particle maturation we examined cellular factors involved in this process. Furin is a cellular enzyme that critically relies on this cycling process and is required for virus particle maturation3, 37. To determine if the decrease in virus maturation, and thus infectivity, was caused by changes in the furin transport pathway we evaluated changes in furin localization following ATL3 depletion (ED Fig. 10a). In control cells, furin localized predominantly to the perinuclear region, likely reflecting its accumulation in the Golgi. In ATL3 knockdown cells furin accumulated at the cell periphery, similar to the fluorescence pattern observed for other ER markers and LDs (Fig. 1c-d; ED Fig. 10e) suggesting that depletion of ATL3 prevents the access of immature virus particles to furin (ED Fig. 10a). Of note, we did not observe significant localization changes in mitochondria (ATP5B) or endosomal proteins (RAB5, RAB7) (ED Fig. 10b-d), indicating that depletion of ATL3 does not cause global changes in the endosomal transport pathway.
To further dissect the role of ATL3 in furin recycling, we utilized a well-defined CD4-furin fusion protein as reporter38. In control cells this reporter localized primarily to the Golgi and TGN, whereas in ATL3 depleted cells, the reporter was dispersed away from the TGN to the cellular periphery (Fig. 6b). Importantly, depletion of other ER tubule forming proteins, including RTN3 and LNP, did not alter furin reporter localization and ATL3 depletion did not significantly impact total furin levels (Fig. 6c; ED Fig. 10f-g). Using this reporter and live cell imaging, we evaluated the dynamics of furin internalization and observed a significant delay in intracellular accumulation of CD4-furin upon ATL3 depletion (Fig. 6d; SI Video 1). Taken together, our data suggest that ATL3 functions in an ARF4-dependent trafficking pathway that leads to the association of immature virions with furin to allow virion maturation cleavage (Fig. 6e).
Discussion
The ER is a versatile organelle having functions in numerous cellular processes, many of which are coopted by flaviviruses. Here we show that ATL2 and ATL3 support flavivirus replication or assembly processes, respectively and provide data supporting a model in which ATL2 functions in RO formation and ATL3 in virion maturation (Fig. 6e). ATLs are well characterized as membrane fusogens and involved in maintaining ER membrane structure, suggesting that ATLs play a role in recruitment of membranes or specific lipids required for RO membrane structure. Indeed, ATLs have been linked to reticulophagy, lipid droplet formation and formation of ER exit sites, all pathways of relevance for flavivirus infection22, 25, 39, 40. Flaviviruses likely hijack one or more of these specific cellular functions of ATLs in order to facilitate either RO biogenesis (ATL2) or virion assembly (ATL3). For ATL2 this may include associations with the nucleic acid editing protein APOBEC3C and the actin binding protein TPM1, which we have physically and phenotypically linked to ATL2 and DV replication (Fig. 4, 5). For ATL3, we have demonstrated a link between ATL3 and ARF4/ARF5 and provide data showing that this is important for endosomal trafficking and virus particle maturation. Further study of these and other proteins identified in our proteomics and RNAi analysis will provide important insights into ER function per se and its exploitation by flaviviruses.
We propose two functions for ATL3 in flavivirus infection: directly in assembly and trafficking of virus particles (Fig. 1, 2) and indirectly in the recycling of furin from the PM to the Golgi (Fig. 5, 6). The increase in intracellular virus particles (Fig. 1f) compared to limited changes in extracellular virus particle number (Fig. 5e-f) indicates that, in addition to blocking maturation of virions, ATL3 might have additional roles. These could include regulating virion assembly or trafficking, or coordinating the association of virion-containing vesicles with furin. Consistently, we found a large proportion of intracellular virus particles colocalizing with ATL3 (Fig. 2d-e). Additionally, our data show a previously unidentified link between ATL3 and early endosomal trafficking involved in virus particle maturation. It may be that ATL3 contributes to previously described contact sites between ER tubules and endosomes, thereby facilitating uptake or trafficking of furin and perhaps other endosomal proteins41, 42. Moreover, this may involve coordination with ARF proteins, which have links to both virus assembly and endosomal trafficking28, 29, 43. Further experimentation will be required to determine the precise function of ATL3 in flavivirus particle maturation.
We demonstrate distinct roles of ATL3 and ATL2 in virus assembly and RO formation, respectively. Though ATL paralogues serve several redundant functions, different ATLs also have distinct cellular functions; however, evaluating these has proven difficult 9, 15, 24. We have used comparative proteomics and a virus-based phenotypic assay to demonstrate non-redundant roles for these ATLs in different cellular pathways. Moreover, we show that the C-, but not the N-terminal region of ATL2 is dispensable for ATL function in DV and ZV RNA replication. Although the C-terminal amphipathic helix is important for efficient membrane fusion44, 45, ATL2∆C deletion mutants might retain residual membrane activity sufficient to overcome this attenuation. In addition, the N-terminal domain of ATL3 can functionally replace the one of ATL2. Previous studies have shown that ATLs favor homodimer over heterodimer formation14. Our observations may indicate that specificity for homodimer formation is conferred through the N-terminal domain. Though we did not exhaust the possibilities for evaluating the differences between ATL2 and ATL3, we provide a powerful tool to further dissect non-overlapping functions of ATLs. Taken together, our findings increase the basic understanding of the ER and open interesting avenues for cell biological inquiries. Our results also provide knowledge and tools to decipher mechanisms of ER-linked human pathologies, both in the context of viral infection and in ATL-related neurodegenerative diseases.
Methods
Cell lines and virus strains
VeroE6 cells were obtained from Progen, HEK-293T, HeLa and A549 cells were obtained from ATCC, and Huh7-Lunet cells were developed in our research group46. All cell lines are regularly tested for mycoplasma contamination and cell lines were authenticated by visual observations of cell morphology. All cells were cultured in Dulbecco’s modified Eagle medium (DMEM, Life Technologies) containing 10% fetal bovine serum, 100 U/mL penicillin, 100 μg/mL streptomycin and 1% non-essential amino acids (complete medium). Stable A549 cell lines were cultured in complete medium containing either 5 ug/mL blasticidin or 1ug/mL puromycin or both. Stable Huh7-Lunet cells were cultured in medium containing 2 ug/mL zeocin. A list of stable cell lines produced for this study is available in SI Table 1.
The reporter virus genomes for DV-2 (strain 16681; sDV-R2A) and ZV (strain H/PF/2013; synZIKV-R2A), which encode Renilla luciferase, have been previously described47, 48. DV stocks were prepared as previously described47 by electroporation of BHK-21 cells with in vitro transcribed DV-2 RNA and subsequent virus amplification in VeroE6 cells. ZV H/PF/2013 (obtained from the European Virus Archive), synZIKV-R2A, and WNV (strain NY99, kindly provided by Jonas Schmidt-Chanasit, Hamburg, Germany) stocks were prepared by virus amplification in VeroE6 cells or insect C6/36 cells. The Rift Valley Fever virus (RVFV) encoding a Renilla Luciferase gene (RVFV-R2A, a gift from Friedemann Weber, University of Giessen, Germany) has been described elsewhere49. Extracellular virus titers were determined by plaque forming unit (PFU) assay in VeroE6 cells using an overlay medium containing 1.5% carboxymethylcellulose. Intracellular virus titers were analyzed by first freeze-thawing cells 3 times followed by centrifugation (14000xg for 10 min) and PFU assay using the resulting supernatant. Virus replication was measured by Renilla luciferase assay. Quantification of viral RNA levels in cells and culture supernatants was done by RT-qPCR (see below).
Expression constructs and transfection
A list of expression vectors and cloning primers is displayed in SI Table 2. For all ATL pWPI expression constructs, the gateway cloning system was used as per the manufacturer’s protocol (ThermoFisher). Sequences were amplified with primers containing the ATTB recombination overhangs (SI Table 2), followed by recombination into the pDONR207 entry vector using the BP recombination reaction (invitrogen). From the entry vectors, sequences were transferred to either the pWPI-nHA or pWPI-rosa26 expression vectors using the LR recombination reaction. The pWPI-rosa26 plasmid was made by swapping the EA1 promoter for a ROSA26 eukaryotic promotor which supports significantly lower target protein expression. For site directed mutagenesis of the ATL GTPase mutants, DNA sequences were amplified using PFU Taq polymerase with primers containing the specific mutations (SI Table 2), followed by DpnI digestion of the original plasmid. Transfection of tissue culture cells was performed using TransIT-LT1 (Mirus) transfection reagent according to the manufacturer’s protocol.
Lentivirus production and transduction of cells
Delivery of expression plasmids for depletion, knockout or overexpression experiments was done through transduction with lentiviruses. For production of lentivirus stocks, sub-confluent 293T cells were transfected with packaging plasmids pCMV-Gag-Pol and pMD2-VSV-G (kind gifts from Didier Trono, EPFL, Lausanne) and specific plasmids (specific shRNA constructs used are given in SI Table 3 and expression constructs are listed in the SI Table 2). Two days post-transfection, lentivirus-containing medium was collected and filtered. Lentiviruses were titrated by SYBR green I-based real-time PCR-enhanced reverse transcriptase (SG-PERT) assay50, 51 using the Takyon SYBR green kit (Eurogentec). Alternatively, HeLa cells were transduced, cultured in the presence of 1 ug/ml puromycin for 5 days, fixed and stained with 1% crystal violet/10% ethanol for 15-30 minutes. Stained cells were rinsed with water, colonies were counted and titers calculated taking into account inoculum dilution. For SG-PERT based virus titer calculations, samples were compared to a standard curve derived from known RNA concentrations in order to determine specific titers for each sample. For all experiments, transductions were performed using a MOI of 5 in the presence of 4 μg/mL polybrene. Cell viability of transduced cells was evaluated using the Cell Titer-Glo Luminescent Cell Viability Assay kit (Promega) according to the manufacturer’s instructions. Luminescence was measured with a Mithras LB940 plate reader (Berthold Technologies). Stable cell lines were produced by transduction of the target cells with lentivirus particles at an MOI of 0.1 followed by selection with either blasticidin or puromycin containing media.
For the shRNA knockdown screen, lentiviral particles harbouring shRNA expression constructs directed towards the indicated genes (SI Table 3) were ordered from Sigma. A549 cells (8000/well of a 96 well plate) were transduced (MOI=3), 48 h later infected with DV-R2A (MOI=1), and 48 h later analyzed by Renilla luciferase assay.
Generation of ATL KO cells by using the CRISPR/Cas9 system and ATL rescue experiments
The 20-base guide strands used to target ATLs are listed in SI Table 4. CRISPR plasmids were constructed by insertion of the annealed oligonucleotides into the lentiCRISPRv2 plasmid (Addgene) encoding puromycin resistance for ATL3 or into the lentiCRISPR plasmid (Addgene) encoding blasticidin resistance for ATL2. To generate knockout cell lines, A549 cells were infected with the respective lentivirus and one day later the cells were cultured in medium containing 3 ug/ml puromycin or blasticidin. For the rescue experiments, ATL knockout cells were plated at 8000 cells/well into 96 well plates and transduced with the specified lentivirus particles (MOI=5). 48 h after transduction, cells were infected with DV-R2A (MOI=1) or wildtype DV-2 for 48 h. For DV-R2A infected cells, viral replication was determined by Renilla luciferase assay. For DV-2 infected samples, cell culture supernatants were evaluated for virus titers using PFU assay.
Endogenous tagging of ATL3 in A549 cells
For N-terminal endogenous tagging of ATL3, the split GFP system was used27. The tagging sequence of GFP11, (11th β-strand of the superfolder GFP β-barrel structure)28 was fused to a FLAG epitope sequence with 3 glycine residues flanking the tag cassette. To create a donor construct for homology directed repair (HDR), sequences homologous to the sites of insertion were added to the 5' and 3' ends of the tag cassette. This DNA fragment was inserted into a pJet vector using the Clonjet PCR cloning kit (Thermo Fisher). Homology arm sequences (NC_000011.10, Homo sapiens chromosome 11, GRCh38.p12 Primary Assembly; left homology arm chromosomal position: 63671324-63671587; right homology arm chromosomal position: 63671048-63671323) were retrieved from NCBI (National Center for Biotechnology Information). The ATL3 gene locus was targeted with a lentivirus based CRISPR/cas9 system52. The relevant guide RNA sequence (5'-GATTTTCCCTGGATCGCCCCG-3') was inserted into lentiCRISPRv2 and used to produce the ATL3 gene targeting CRISPR/cas9 lentiviral particles. To reconstitute a functional GFP protein, A549 cells stably expressing the complementary GFP fragment (GFP 1-10) were created using lentiviral transduction and transduced cells were selected with 5 μg/ml blasticidin. A549 cells expressing GFP 1-10 were reverse transfected with 2 μg of the HDR donor construct using the TransIT-LT1 transfection reagent (Mirus) in a 6-well plate according to the manufacturer’s protocol and infected with the ATL3 gene targeting CRISPR/cas9 lentiviral particles. 3 days later single cells were sorted based on GFP fluorescence; single cell clones were expanded and evaluated using immunofluorescence. Cell clones with ER localized GFP signal were expanded to test for expression of the FLAG epitope using Western blot as described above. The resulting cell line was designated A549-ATL3-ET-GFP.
Phylogenetic analysis of ATL proteins
Human ATL proteins were used as BLAST queries to search for homologues in publicly available predicted animal and choanoflagellate proteomes at NCBI. Retrieved protein sequences were aligned using MUSCLE, manually trimmed to 494 well-conserved homologous sites before being subjected to phylogenetic analysis53. Phylogenetic tree reconstructions were performed using MrBayes v3.2.6 for Bayesian analysis54. MrBayes analyses were run with the following parameters: prset aamodelpr = fixed (WAG); mcmcngen = 1,000,000; samplefreq = 1000; nchains = 4; startingtree = random; sumt burnin = 250. Split frequencies were checked to ensure convergence. Maximum likelihood bootstrap values (100 pseudoreplicates) were obtained using RAxML v8.2.1055 under the LG model56.
Quantitative real-time PCR (RT-qPCR)
Isolation of total cellular RNA was carried out using a NucleoSpin RNA extraction kit (Macherey-Nagel) according to the manufacturer’s protocol. cDNA was synthesized using a high capacity cDNA reverse transcription (RT) kit (Thermo Scientific) according to the manufacturer’s specification. cDNA was diluted 1:20 and used directly for qPCR analysis using specific primers and the iTaq Universal SYBR green mastermix (Bio-Rad). Primers for qPCR were designed using Primer3 software; primer sequences are supplied in SI Table 2. To obtain the relative abundance of specific RNAs from each sample, cycle threshold (ct) values were corrected for the PCR efficiency of the specific primer set, and normalized to hypoxanthine phosphoribosyltransferase 1 (HPRT) transcript levels.
Western blotting
Cells were lysed using protein sample buffer, followed by sonication and denaturation at 95°C for 10 minutes. 10 μg of total protein from each sample was resolved by SDS-PAGE and transferred to nitrocellulose. Membranes were blocked with PBS-T (PBS - pH 7.4, containing 0.1% Tween-20) containing 5% skim milk for 2 h at room temperature, followed by incubation with anti-sera containing primary antibodies overnight at 4°C (for list of primary and secondary antibodies used see SI Table 5 and 6). Membranes were washed and incubated for 1 h with the HRP-conjugated secondary antibodies. Membranes were imaged using the ChemoCam 6.0 ECL system (INTAS Science Imaging, Goettingen, Germany). Images were cropped and analyzed using Fiji software (National Institute of Health).
Immunofluorescence
A549 cells grown on glass cover slips were fixed with 4% paraformaldehyde (PFA) at room temperature for 15 min and permeabilized in 0.2% Triton X-100 for 2 min at room temperature. Cover slips were blocked in 2.5% skim milk in PBS for 2 h and incubated with the indicated primary antibodies at 4°C overnight (for list of primary and secondary antibodies used see SI Table 5 and 6). Samples were then washed with PBS and incubated with secondary antibodies for 45 min at room temperature, followed by mounting onto microscope slides using Dapi-Fluoromount-G mounting media (Southern BioTech, 0100-20) for confocal microscopy or MOWIOL mounting media for STED microscopy. For STED microscopy, the secondary antibodies were conjugated to either STAR-red or ATTO-594 fluorescent dyes (SI Table 6). To visualize lipid droplets, samples were incubated with BODIPY493/503 (ThermoFisher) or LipidTOX (Thermofisher) neutral lipid stains for 15 min at room temperature prior to mounting.
Confocal images were obtained with a Leica SP8 AOBS Point Scanning Confocal Microscope (Leica Microsystems). Confocal images were acquired as a z-stack series (with a distance of 0.3 μm between slices) and are represented as a z-projection. For two-color STED nanoscopy, cells were imaged using a 100x Olympus UPlanSApo (NA 1.4) oil immersion objective on an inverted Aberrior Instruments microscope (Abberior Instruments GmbH) with 640 nm or 590 nm excitation laser and 775 nm depletion laser. All STED images shown were linearly deconvolved with a Lorentzian function (fwhm 50 nm) using the software Imspector (Abberior Instruments GmbH). Z-projection and merging of channels was done using Fiji software (National Institute of Health). All original images were taken with a bit depth of 12 bits for display images or 16 bits for images that were quantified. Pearson’s colocalization coefficients were calculated as previously described using the Coloc2 plugin for Fiji. Adobe Photoshop and Illustrator software packages were used to assemble images into figures.
Electron Microscopy
Cells grown on glass coverslips were fixed for 30 min by incubation with pre-warmed 2.5% glutaraldehyde/2% sucrose in 50 mM sodium cacodylate buffer (CaCo)(50 mM cacodylate, 50 mM KCl, 2.6 mM CaCl2, 2.6 mM MgCl2, pH-7.4). After 3 washes with 50 mM CaCo buffer, cells were incubated with 2% osmium tetroxide/50 mM CaCo for 40 min on ice, washed with water 3 times and treated with 0.5% uranyl acetate for 30 min. After 30 min rinsing with water, cells were progressively dehydrated with increasing concentrations of ethanol (40% to 100%) and finally infiltrated in a polymerizing Epon/araldite resin (Araldite 502/Embed 812 kit; Electron Microscopy Sciences) for 72 h at 60°C. Embedded cells were sectioned into 70-nm-thick slices by using an Ultracut UCT microtome (Leica) and a diamond knife (Diatome). After counterstaining with 3% uranyl acetate in 70% methanol for 5 min and 2% lead citrate in water for 2 min, cells were examined either with an EM-10 transmission electron microscope (Zeiss) with a built-in MegaView camera (Olympus) or with a JEOL JEM-1400 transmission electron microscope (Jeol Ltd., Tokyo, Japan). Quantification of virion number, size, and distribution was done manually or using macros developed for the Fiji software package.
Correlative light-electron microscopy (CLEM)
CLEM was performed as previously described57, 58. A549-ATL3-ET-GFP cells were seeded into glass-bottom culture dishes containing photo-etched gridded coverslips (MatTek Corporation, Ashland, MA) and infected with DV-2 (16681 strain; MOI=1). After 48 h, cells were fixed with 4% PFA and 0.2% glutaraldehyde in PBS for 30 min at room temperature, washed 3 times with PBS, stained with DAPI and LipidTOX and analyzed by fluorescence microscopy on a Nikon TE2000 Ultraview ERS spinning disc (PerkinElmer). Z-stacks of GFP-positive cells were obtained and the positions of the cells of interest were recorded using transmitted light with a differential interference contrast configuration. Cells were then fixed and processed for EM as described above. EM samples were visualized with a JEOL JEM-1400 transmission electron microscope (Jeol Ltd., Tokyo, Japan). DAPI and LipidTOX signals from the light microscopy were used for correlation purposes and images were adapted by using the Landmark Correspondences plugin from Fiji and Adobe Photoshop software packages.
Polyprotein expression system
Huh7-Lunet cells stably expressing T7 RNA polymerase were transfected with the DV polyprotein construct pSM3-Δ5’-SLAB-DV. 24 h after transfection cells were harvested for either IF (to determine transfection efficiency and protein expression level) or EM. To determine transfection efficiency, parallel samples were prepared for immunofluorescence analysis as described above and stained with antibodies directed against DV NS3. Samples were observed using a Nikon Ti Eclipse microscope and the percent of transfected cells was determined using the Fiji software package. For EM analysis, samples were fixed and processed as described above. EM data were obtained from the observation of at least 20 cells originating from 3 biological replicates for each condition. A VP was defined as array of >2 connected vesicles residing at the same of the ER lumen. Cells containing ≥4 VPs were counted as containing VPs.
Immune Electron Microscopy
Fixation and gold labeling of EM samples was done as previously described59. Briefly, to fix the cells, one volume of 0.2 M PHEM buffer (120 mM PIPES, 50 mM HEPES, 4 mM MgCl2, 20 mM EGTA, pH 6.9) containing 8% PFA and 0.2% glutaraldehyde was added to the culture medium in a 1:1 ratio. Cells were incubated for 10 min at room temperature followed by removal of the media and a second fixation for 1 h with 0.1 M PHEM containing 4% PFA and 0.1% glutaraldehyde. Samples were stored in 0.1 M PHEM containing 4% PFA at 4°C until further use. Cells were washed for 10 min in 0.1 M PHEM/50 mM glycine and collected in 0.1 M PHEM containing 1% gelatin. Cells were centrifuged, resuspended in pre-warmed 10% gelatin and spun down again. Cells were then incubated on ice until the gelatin had solidified. Excess of cell-free gelatin was trimmed away and gelatin-embedded cells were cut into small cubes under a magnifying glass. The cubes were put into a 2.3 M sucrose solution and spun at 4°C overnight. Cell pellets were mounted on silver pins, flash-frozen and stored in liquid nitrogen. Samples were sectioned with a Reichert Ultracut S ultramicrotome using a Reichert FCS cryo-attachment and a Diatome diamond knife (Diatome). Cryosections were thawed and immunolabelled as previously described59 using rabbit anti-HA (Sigma-Aldrich) and protein A-Gold, 10 nm (Utrecht). Samples were examined using a JEOL transmission electron microscope. Quantification of virions and VPs containing proximal gold labeling was done manually, counting >150 structures for each.
Furin Reactivation assay
The furin reactivation assay was performed as previously described34. 2x10⁶ cells were transduced with lentivirus (as described above) and, 48 h later, were infected with DV-2 (16681 strain) for 48 h followed by collection of the serum (total volume 10 mL for each sample). Virus particles in the serum were purified by centrifugation through 2 mL 20% sucrose containing NTE buffer (120 mM NaCl, 12 mM Tris-HCL pH 8, 1 mM EDTA) for 4 h at 10,000xg at 4°C. Supernatant was then removed and the resulting pellet was resuspended in 50 μl NTE buffer. Purified DV particles in NTE buffer were mixed with 50 mM 2-(N-morpholino)ethanesulfonic acid (MES) at a 1:1 ratio to adjust the pH to 6.0. Furin (New England Biolabs Inc.) was added at a final concentration of 0.4 U/μL, and the mixture was incubated at 30°C for 16 h in the presence of 3 mM CaCl2. The samples were then mixed with neutralization buffer (120 mM NaCl, 100 mM Tris at pH 8.0) at a 1:1 ratio. Virus particle infectivity was determined by PFU assay as described above.
Affinity-purification and quantitative LC-MS/MS proteomics
For co-immunoprecipitations, uninfected or DV-2 (16681 strain) infected A549 cells constitutively expressing the indicated tagged proteins, were lysed in lysis Buffer (50 mM Tris pH 7.4, 150 mM NaCl, 0.5% TX-100, containing complete protease inhibitor and PhosStop [Roche]) and subjected to immunoprecipitation using anti-HA agarose beads (Sigma-Aldrich) or anti-FLAG magnetic beads (Sigma). After 3 h, immune complexes were washed 5 times with lysis buffer. Proteins were eluted using 3% SDS and evaluated by western blot.
For the determination of the ATL-2 and ATL-3 interactomes, 4 independent affinity purifications were performed for each bait. A549 cells constitutively expressing only the HA tag (pWPI-nHA only; NT), or HA-tagged Calnexin, ATL-2 or ATL-3 were mock-infected or infected with DV-2 (MOI=3). 48 h later cells were scraped into 1 ml of lysis buffer (50 mM Tris pH 7.4, 150 mM NaCl, 0.5% TX-100, containing complete protease inhibitor and PhosStop [Roche]) and HA-affinity purifications were performed as described earlier 60. Briefly, clarified cell lysates were incubated with anti-HA-specific beads for 3 h at 4°C, and non-specifically bound proteins removed by 3 washes with lysis buffer and 5 washes with washing buffer (50 mM Tris pH 8, 150 mM NaCl). Bound proteins were denatured by incubation in 40 μl U/A buffer (8 M Urea, 100 mM Tris-HCl pH 8.5), and reduction and alkylation carried out with 10 mM DTT and 55 mM iodoacetamide in 50 mM ABC buffer (50 mM NH4HCO3 in water, pH 8.0), respectively. After digestion with 1 μg LysC (WAKO Chemicals USA) at room temperature for 3 h, the suspension was diluted in ABC buffer, and the protein solution was digested with trypsin (Promega) overnight at room temperature. Peptides were purified on stage tips with 3 C18 Empore filter discs (3M) and analyzed by liquid chromatography coupled to mass spectrometry on an Orbitrap XL instrument (Thermo Fisher Scientific) as described previously61.
For global proteomic analysis of stable cell lines used for affinity-purification, 4 independent samples were prepared for each cell line. Cells were lysed in 4% SDS-TrisCl (pH=8) and homogenized by two cycles of heating (98 °C, 5 min) and sonication (15 min). After centrifugation proteins in normalized cell lysates were acetone precipitated twice and processed as described above.
Raw mass-spectrometry data were processed with MaxQuant software versions 1.5.6.262 using the built-in Andromeda search engine to search against the human proteome (UniprotKB release 2015_08 including isoforms and unreviewed sequences) containing forward and reverse sequences plus the DV polyprotein (DV-2 strain 16681, UniprotID P29990 with the individual viral cleavage products manually annotated), and the label-free quantitation algorithm as described previously63. Additionally, the intensity-based absolute quantification (iBAQ) algorithm and Match Between Runs option were used. In MaxQuant, carbamidomethylation was set as fixed and methionine oxidation and N-acetylation as variable modifications, using an initial mass tolerance of 6 ppm for the precursor ion and 0.5 Da for the fragment ions. Search results were filtered with a false discovery rate (FDR) of 0.01 for peptide and protein identifications.
Perseus software version 1.5.3.0 and 1.6.2.2 were used to further process the affinity-purification or the proteomics datasets, respectively. Protein tables were filtered to eliminate the identifications from the reverse database and common contaminants. In analyzing mass spectrometry data, only proteins identified on the basis of at least one peptide and a minimum of 3 quantitation events in at least one experimental group were considered. For the interactome dataset, iBAQ protein intensity values were normalized against the median intensity of each sample (using only peptides with recorded intensity values across all samples and biological replicas), log-transformed and missing values filled by imputation with random numbers drawn from a normal distribution calculated for each sample. Significant interactors were determined by Welch’s t-tests with permutation-based false discovery rate statistics. We performed 250 permutations and the FDR threshold was set at 0.01. The parameter S0 was set at 1 to separate background from specifically enriched interactors. For the proteomics dataset, the label-free quantification (LFQ) protein intensity values were used, and intensity values filtered and imputed as described above. Significant interactors were determined as described above using an FDR threshold of 0.05, and the parameter S0 was set at 1 to separate background from specifically enriched or depleted proteins. Results were plotted as scatter plot and heat map using Perseus64 or Cytoscape (version 3.7.0)65.
Transferrin (Tfn) and furin internalization assays
For visualization of Tfn internalization and recycling, cells were first serum starved for 30 min at room temperature. Cells were then incubated with 50 μg/mL Alexa Fluor 568 conjugated transferrin (Tfn-568) (ThermoFisher) for 45 min followed by paraformaldehyde fixation and immunofluorescence staining as described above. Cells were visualized by confocal microscopy. The levels of perinuclear/Golgi associated Tfn-568 fluorescence signal was determined by evaluating the fluorescence levels in proximity to signal arising from TGN46 specific antibodies using a custom made macro in the Fiji software package.
The CD4-furin chimeric protein containing the ectodomain of CD4 and the transmembrane and cytoplasmic regions of furin has been previously described38. A549 cells stably expressing CD4-furin were transduced with lentiviruses encoding for shRNA against ATL3 or non-target control (MOI=5). Three days post-transduction, medium was replaced with imaging medium (DMEM complete without phenol red) and samples were imaged with a confocal spinning disc microscope. For each position, a single confocal slice was collected every 60 seconds. After two minutes Alexa Fluor 647-conjugated anti-CD4 antibodies were added to the medium and antibody internalization and trafficking was allowed to proceed for 2 h. Images were analyzed using the Fiji software package (National Institute of Health). Briefly, after background subtraction, a region of interest was manually drawn around each cell. For each time point, total cell-associated fluorescence was calculated. For each experiment, at least 8 cells were analyzed and each experiment was repeated 3 times.
VSVg trafficking and Gaussia luciferase secretion assays
The VSVg trafficking assay was performed as previously described33. Briefly, Hela cells were transduced with lentiviruses encoding for shRNA targeting ATL2, ATL3 or non-target control (MOI = 5). Three days post-transduction cells were transfected with a construct expressing a temperature-sensitive mutant of the vesicular stomatitis virus G protein fused to GFP (VSV-G_ts045_GFP) (kind gift from Megan Stanifer, Department of Infectious Diseases, Virology, Heidelberg University). After 6 h cells were incubated at 40°C for 16 h to arrest the protein in the ER and then imaged 24 h post-transfection at 32°C with a confocal spinning disc microscope in imaging medium (DMEM complete without phenol red). For each cell, a single confocal slice was collected every 5 min. For each time point, the integrated fluorescence intensity in a region of interest surrounding the perinuclear area was calculated and reported as fraction of the total intensity collected within the same region across all the time points. For each experiment, at least 20 positions per condition were collected.
For the Gaussia luciferase assay, cells were transfected with the Gaussia luciferase reporter. After 24 h an initial sample of media was taken (time point 0) and the media was exchanged for fresh media. Media samples were taken every 2 h for a total of 12 h and the total amount of luciferase was measured.
Statistical reproducibility
Unless otherwise stated, all microscopy or western blot images shown in this study are representative of at least 3 biological replicates.
Extended Data
Extended Data Figure 1. ER protein depletion in virus infection.
a, Phylogenetic analysis of metazoan ATL proteins collected from a subset of publicly available metazoan predicted proteomes. ATL sequences were aligned with MUSCLE and manually trimmed into a 494-site alignment. Phylogenies were reconstructed, and node support values were calculated using MrBayes for posterior probability and RAxML for maximum likelihood and presented as inset (MrBayes/RAxML). The MrBayes tree topology is shown. Scale bar: number of estimated substitutions per site. For genomes used see SI Table 7 b-h, A549 cells were transduced with constructs encoding for shRNAs (b-e, and g-h) or transfected with siRNA (f) targeting indicated mRNA transcripts, or a non-targeting (NT) shRNA or siRNA. b-d, 96 h post transduction, mRNA levels, protein levels and cell viability were evaluated. b, ATLs mRNA transcript levels were evaluated by RT-qPCR and values corrected using HPRT. Graphs show average percent change compared to NT shRNA for 3 independent experiments. c, ATL protein levels evaluated by western blot. Graph shows average protein levels compared to NT shRNA treated cells from 3 experimental replicates. d, Graph shows mean cell viability as percent survival compared to NT shRNA treated cells. e, 48 h after transduction cells were infected with DV (MOI=1) for 48 h. DV titers were determined by PFU assay. Graph show average fold change in PFU/mL (titers). * and ** - p values lower than 0.05 or 0.01, respectively, determined using one-way ANOVA with a Dunnett’s multiple comparison analysis. RTN, reticulon; LNP, lunapark. f, 96 h post transduction, cells were lysed for RNA analysis. Graph shows average percent change vs. NTshRNA for 3 independent experiments g-h, 48 h after transduction cells were infected with DV or RVFV (MOI=1) for 48 h. DV titers were evaluated using a PFU assay and RVFV replication was determined by luciferase assay. Graphs show average fold change in PFU/mL (titers) or average fold change in RLU/mL (replication) relative to NT shRNA expressing cells for three independent experiments. For all graphs, error bars show SEM and N= ≥ 3 biological replicates.
Extended Data Figure 2. Virus protein localization in ATL depleted cells.
48 h after lentiviral transduction of shRNA expression constructs, cells were infected with DV for 48 h. Cells were fixed with paraformaldehyde and viewed by immunofluorescence microscopy using LipidTOX or antibodies directed against capsid, Env, NS4B, NS3, Climp63 or RTN3. Scale bars, 10 μm, inset 5 μm.
Extended Data Figure 3. Effects of ATL depletion on virus-induced membrane alterations.
Cells were transduced with constructs encoding for shRNAs directed against ATL2 or ATL3, or a NT shRNA. a, 48 h after transduction, cells were infected with DV and 48 h later fixed and processed for viewing by TEM. Invaginated vesicles (yellow dots) and viral particles (blue dots) were determined by counting using Fiji software. Inserts display magnified views of the boxed area (scale bars, 2 μm; inset, 200 nm). Note the accumulation of ER tubular networks at the cell periphery in ATL3 depleted cells. b-f, Huh7-Lunet cells stably expressing the bacterial T7 RNA polymerase were transduced for 48 h, followed by transfection with a construct encoding for the viral polyprotein and containing the 3’ untranslated region (UTR) of the DV genome (panel b). c, 24 h post transfection, cells were fixed and stained with antibodies specific to the viral NS3 protein and visualized by confocal light microscopy. Scale bars, 10 μm. d, Graph shows the average relative fluorescence signal of NS3 in shRNA transduced cells. N=7 independent samples. e, Representative EM images of polyprotein expressing cells from a total of 3 independent experiments. Scale bars, 200nm. f, VPs in each cell were counted and mean values are represented in the graph (N=23 cells, error bars represent SEM). For all graphs * and ** represent p values lower than 0.05 or 0.01, respectively as determined by 2-tailed T-test.
Extended Data Figure 4. ATLs associate with distinct DV proteins.
a-c, A549 cells stably expressing HA-ATL2 or HA-ATL3 were infected with DV for 48 h. Cells were then fixed and stained with antibodies directed against NS3 or Env and the HA epitope, respectively. Scale bars, 10 μm. d, Pearson’s colocalization coefficients were calculated for cells from panels a-c. The graph shows the average value from 20 cells for each condition. Error bars, SEM. e, A549 cells stably expressing HA-ATL2, HA-ATL3, HA-CANX, or an empty plasmid were infected with DV for 48 h. Cells were lysed and HA-tagged proteins were immunoprecipitated with anti-HA beads. Inputs and precipitated proteins were analyzed by western blot using NS2B- and NS4B-specific antibodies. Breaks between adjacent blots indicate lanes not relevant to the experiment were removed. f-h, A549 cells stably expressing HA-ATL3 were infected with DV for 48 h. Cells were fixed and stained with antibodies directed against virus proteins or dsRNA (RED) and the HA epitope (green). Pearson’s colocalization coefficients for merge images are given in the top right corners. Images were taken using an Abberior instruments STED microscope. Scale bars, confocal 10 μm, STED 1 μm, inset 100 nm. i, Average Pearson’s colocalization coefficients were calculated for the fluorescent signal corresponding to the HA-tagged ATL3 compared to those from the indicated viral proteins in STED microscopy images. Graph shows the average Pearson’s colocalization coefficients calculated for 10 cells. Error bars, SEM.
Extended Data Figure 5. Production and testing of endogenously tagged ATL3.
a, Schematic representation of the cloning strategy used for endogenous tagging of ATL3. NVD, N-terminal variable domain; 3HB, three-bundle Helix; TM, transmembrane region; CTA, C-terminal amphipathic-helix domain. The tagging cassette includes the 11th beta-strand of GFP (GFP11) and the FLAG-tag. b, Individual ATL3-ET (Endogenously Tagged) cell clones were lysed and lysates were analysed by western blot using the indicated antibodies. N=2 biological replicates. c, Cells expressing the endogenously tagged ATL3 were fixed and stained for FLAG or the ER marker PDI. Fluorescence signals specific for antibodies or GFP were visualized by confocal microscopy. Scale bar, 10 μm. d-f, A549 cells expressing endogenously-tagged ATL3 were infected with DV for 48 h. d, Cells were fixed and stained with NS3 (red) or FLAG-specific antibodies (green). Scale bars, 10 μm. e, Cells were lysed and FLAG-tagged proteins were precipitated with anti-FLAG magnetic beads. Inputs and captured protein complexes were evaluated by western blot using antibodies of given specificities. Actin served as loading and specificity control. Breaks between adjacent blots indicate lanes not relevant to the experiment were removed. N=2 biological replicates. f, Titers of infectious extracellular DV were determined by PFU assay. Graph shows the average fold change in PFU/mL compared to wild type cells for CRISPR/Cas9 control (Ctrl) or ATL3-ET cells over 3 biological replicates. Error bars, SEM.
Extended Data Figure 6. Production of ATL KO cells and effects of ATL mutations on viral replication and subcellular localization.
a-e, A549 cells were transduced with vectors expressing CRISPR/CAS9 as well as a guide RNA directed towards ATL1, ATL2, ATL3, or a non-target guide RNA (Ctrl). a, Knock out or control cells were lysed and protein levels were determined by western blot using given antibodies. GapDH served as loading control. b, Knock out or control cell pools were infected with ZV or DV for 48 h followed by quantification of extracellular virus titers. Graphs show average fold change in PFU/mL for each cell line compared to control cells over 3 independent experiments. ** and *** represent p values lower than 0.01 or 0.001, respectively as determined by 2-tailed T-test. c-e, Knockout or control cell pools were transduced with lentiviruses encoding for the ATL variant given on the bottom of each. c-d, 72 h after transduction, cell viability was determined using celltiter glow measuring intracellular ATP levels. Graphs show the average fold change in cell viability compared to control A549 cells. Lower dashed line shows the cut off of 80% viability. N=3 biological replicates. e, 24 h after transduction, cells were infected with DV for 48 h followed by evaluation of virus production using PFU assay. Graph shows the average PFU/mL as fold change compared to ctrl cells for 3 independent experiments. Lower dashed line indicates the difference between ATL3 KO cells and ctrl cells, both transduced with an empty plasmid. For all graphs, error bars show SEM. f-g, A549 cells were transduced with constructs encoding for the indicated ATL variants. 72 h after transduction, cells were fixed and stained with antibodies directed against the HA epitope (green) or the ER marker reticulon 3 (RTN3; red). Scale bars, 10 μm.
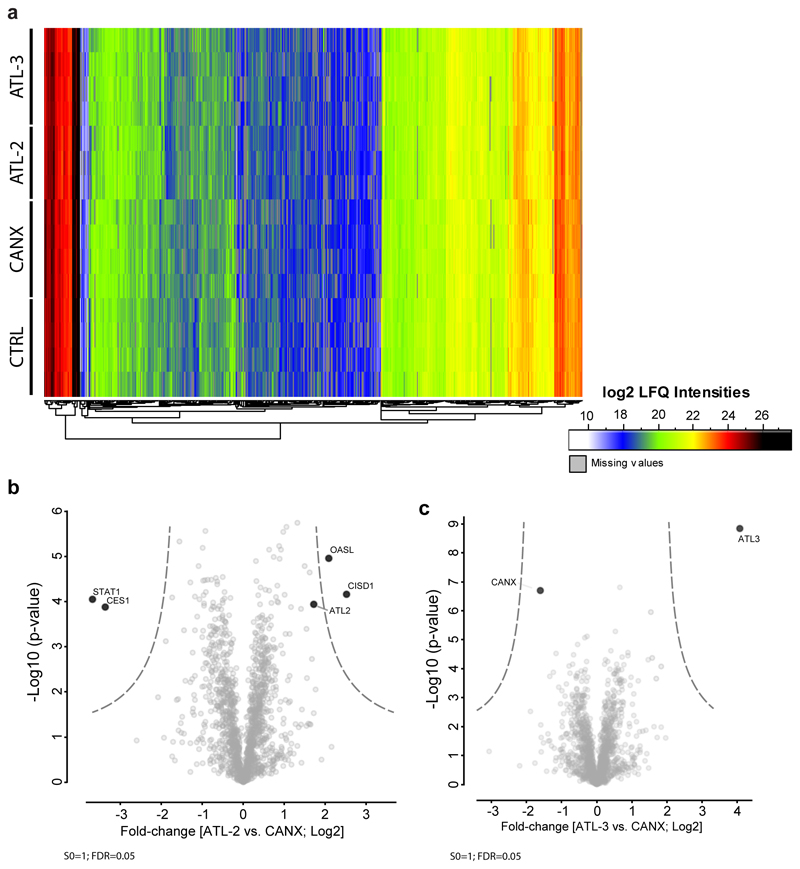
Extended Data Figure 7. ATL2 and ATL3 overexpression does not alter the cellular proteome.
Proteomic analysis of A549 cells stably expressing HA-ATL2, HA-ATL3, HA-CANX, or an empty plasmid. a, Heat map of log2-transformed LFQ intensities for each individual replicate in rainbow colours (see colour scale). b-c, Volcano plots of the p values vs. the log2 protein abundance differences between HA-tagged ATL2- and ATL3-overexpressing cells compared to HA-Calnexin (CANX) overexpressig cells, with proteins outside the significance lines highlighted (unadjusted two-sided t-test. Permutation based FDR < 0.05, S0 = 1, p<0.05). N=4 independent experiments. For Raw data see Source Data Table 1.
Extended Data Figure 8. ATL interactome and shRNA screen.
a-b, The scatter plot displays ATL2 (a) or ATL3 (b) specific interactors (compared to calnexin (CANX)) in both infected and uninfected cells. Schematics of the variables compared are shown in the bottom right of each scatter plot. Significantly enriched or depleted proteins are shown in red (N = 4 independent experiments. Welch’s T-test unadjusted two-sided P ≤ 0.05; |log2(fold-change)| ≥ 1). c) Heat map showing imputed log2-transformed iBAQ intensities for each individual replicate in rainbow colors (see color scale). Only the bait proteins and the selected cellular interaction partners used for the RNAi screen are depicted in the plot. d, Knockout or control cells were transduced with lentivirus encoding for shRNAs (3/gene) targeting the genes specified in the left of the panel. 72 h after transduction, cell viability was tested. Graphs show the average change in cell viability, as determined by intracellular ATP quantification, for each treatment compared to control cells that were transduced with the non-target shRNA vectors. N=3 independent experiments. Error bars, SEM e, A549 cells stably expressing HA-ATL2, HA-ATL3, HA-CANX (calnexin) or transduced with the empty vector were infected with DV for 48 h. Cells were lysed and HA-tagged proteins were captured with anti-HA beads. Inputs and precipitated protein were determined by western blot and probing for the indicated proteins. Red numbers below the ARF4 panel indicate efficiency of ARF4 pulldown compared to bait protein over an average of 3 experiments. Breaks between adjacent blots indicate non-relevant lanes were removed.
Extended Data Figure 9. Effects of ATL3 depletion on virus particle maturation and the secretory pathway.
a, Cells were transduced with lentiviruses encoding for ARF4, ARF5 or non-targeting (NT) shRNAs. 72 h later RNA levels were quantified by RT-qPCR. Shown is the average fold change in viral RNA levels, corrected for HRPT. b-c, Cells were transduced with lentiviruses encoding for ATL2, ATL3 or NT shRNAs. b, After 72 h cells were transfected with a construct encoding for Gaussia luciferase and luciferase secretion was measured over 10 h. Graph shows the average levels of secreted luciferase compared to the 0 h time point. c, 72 h post transduction, cells were transfected with VSV-G_ts045_GFP and 8 h later incubated at 40°C. 16 h later temperature was lowered to 32°C and cells were imaged by confocal microscopy. Graph shows the means and SEM of perinuclear fluorescence intensity distribution for each condition. d-h, A549 cells were transduced with constructs of given specificities and cultured for 48 h. d, Cells were infected with ZV, and 48 h later viral RNA levels were determined by RT-qPCR (left panel). Intracellular viral RNA levels were corrected for HRPT. Titers of infectious virus contained in cell lysates and culture supernatants were determined using a PFU assay (right panel). For both panels, average fold changes are shown. e, Levels of prM and NS1 released from DV infected cells were calculated by quantifying western blots using Fiji software. Values were normalized to NT shRNA transduced cells (horizontal line). f, Cells were infected with DV for 48 h. RNA levels were determined by RT-qPCR; graph shows average fold change. g-h, Extracellular proteins were evaluated using western blot. h, Levels of prM released from DV infected cells were calculated using Fiji software. Values are displayed relative to NT shRNA transduced cells. All graphs show means and SEM derived from an average of 3 independent experiments. Significance was determined relative to NT shRNA transduced cells. * or ** represent p values < 0.05 or 0.01, respectively as determined by one-way ANOVA with a Dunnett’s multiple comparison analysis.
Extended Data Figure 10. Effects of ATL3 depletion on specific host protein localization.
A549 cells were transduced with constructs encoding for shRNA directed against the indicated gene, or a NT shRNA. a, 48 h post transduction cells were infected with DV for 48 h. Cells were then fixed and the indicated proteins or structures were visualized by immune staining and confocal microscopy. b-e, 96 h after transduction, cells were fixed and stained with the antibodies of given specificity. After incubation with secondary antibody fluorescence signal was visualized by confocal microscopy. f, shRNA transduced cells expressing the furin reporter protein CD4-Fu were fixed 72 h after transduction. The subcellular localization of the furin reporter was evaluated using immunofluorescence staining and confocal microscopy. Nuclear DNA was stained with DAPI. All scale bars, 10 μm. g, Transduced cells expressing the furin reporter protein were fixed 72 h after transduction and stained with anti-CD4 antibodies. The average total fluorescence levels of CD4-Fu were determined for ≥50 ctrl or ATL3 KD cells. Error bars, SEM.
Supplementary Material
Acknowledgments
We thank Alessia Ruggieri, Laurent Chatel-Chaix and Michael Joyce for constructive scientific discussions and valuable comments. We also thank Uta Haselmann, Marie Bartenschlager, I. Paron, Antonio Piras and Steffanie Kallis for excellent technical support. We acknowledge the Electron Microscopy Core Facility at Heidelberg University and the Infectious Diseases Imaging Platform (IDIP) at the Center for Integrative Infectious Disease Research, Heidelberg, Germany, for expert assistance and access to their equipment as well as the Department of Proteomics and Signal Transduction of the Max-Planck Institute of Biochemistry for continuous and generous support. We thank the European Virus Archive (EVAg, France) for provision of ZV strains, Jonas Schmidt-Chanasit for providing WNV strains, Friedemann Weber for providing the RVFV isolate, Didier Trono for providing the lentiviral transduction system and Megan Stanifer for providing the VSVg constructs. This work was supported by grants from the Deutsche Forschungsgemeinschaft (SFB1129, TP11 and BA1505/8-1, both to R.B., and TRR179, TP11 to A.P.) and the ERC (StG iVIP 331339, CoG ProDAP 817798) to A.P.. C.J.N was supported in part by a European Molecular Biology Organization (EMBO) Long-Term Fellowship (ALTF 466-2016).
Footnotes
Data Availability
UniprotKB accession codes of all protein groups and proteins identified by Mass Spectrometry are provided in each respective Supplementary SI Table 8 and were extracted from UniprotKB (Human; release 2015_08 including isoforms and unreviewed sequences). Protein sequences of DV-2 16681 strain (P29990) were extracted from UniprotKB. The MS-based proteomics data were deposited at the ProteomeXchange Consortium (http://proteomecentral.proteomexchange.org) via the PRIDE partner repository with the data set identifier PXD014639 and PXD014640. For the evolutionary tree analysis, all accession codes can be found in SI Table 7. The remainder of the data that support the findings of this study are available from the corresponding authors upon reasonable request.
Author contributions
C.J.N. Designed the concept of the project, carried out the majority of the experiments, interpreted the results and wrote the manuscript. M.C. Conceived and carried out experiments, interpreted the results. P.S. Performed and analysed mass spectrometry data. J.W. Performed and interpreted evolutionary analysis and sequence comparisons. B.C. Produced endogenously-tagged cell lines. T.M. Performed some siRNA experiments. K.T. Produced knockout cell lines. O.O. provided reagents and advice for STED microscopy. A.P. contributed to the analysis of mass spectrometry data as well as critical discussions. R.B. Contributed to the concept of the study, interpretation of the results and manuscript writing, supervised the project and secured funding.
Declaration of Interests
The authors declare no competing interests
References
- 1.World Health, O. Dengue vaccine: WHO position paper, July 2016 - recommendations. Vaccine. 2017;35:1200–1201. doi: 10.1016/j.vaccine.2016.10.070. [DOI] [PubMed] [Google Scholar]
- 2.Wikan N, Smith DR. Zika virus: history of a newly emerging arbovirus. Lancet Infect Dis. 2016;16:e119–e126. doi: 10.1016/S1473-3099(16)30010-X. [DOI] [PubMed] [Google Scholar]
- 3.Neufeldt CJ, Cortese M, Acosta EG, Bartenschlager R. Rewiring cellular networks by members of the Flaviviridae family. Nature reviews. Microbiology. 2018;16:125–142. doi: 10.1038/nrmicro.2017.170. [DOI] [PMC free article] [PubMed] [Google Scholar]
- 4.Cortese M, et al. Ultrastructural Characterization of Zika Virus Replication Factories. Cell Rep. 2017;18:2113–2123. doi: 10.1016/j.celrep.2017.02.014. [DOI] [PMC free article] [PubMed] [Google Scholar]
- 5.Welsch S, et al. Composition and three-dimensional architecture of the dengue virus replication and assembly sites. Cell Host Microbe. 2009;5:365–375. doi: 10.1016/j.chom.2009.03.007. [DOI] [PMC free article] [PubMed] [Google Scholar]
- 6.Gillespie LK, Hoenen A, Morgan G, Mackenzie JM. The endoplasmic reticulum provides the membrane platform for biogenesis of the flavivirus replication complex. J Virol. 2010;84:10438–10447. doi: 10.1128/JVI.00986-10. [DOI] [PMC free article] [PubMed] [Google Scholar]
- 7.Goyal U, Blackstone C. Untangling the web: mechanisms underlying ER network formation. Biochim Biophys Acta. 2013;1833:2492–2498. doi: 10.1016/j.bbamcr.2013.04.009. [DOI] [PMC free article] [PubMed] [Google Scholar]
- 8.Powers RE, Wang S, Liu TY, Rapoport TA. Reconstitution of the tubular endoplasmic reticulum network with purified components. Nature. 2017;543:257–260. doi: 10.1038/nature21387. [DOI] [PMC free article] [PubMed] [Google Scholar]
- 9.Wang S, Tukachinsky H, Romano FB, Rapoport TA. Cooperation of the ER-shaping proteins atlastin, lunapark, and reticulons to generate a tubular membrane network. eLife. 2016;5 doi: 10.7554/eLife.18605. [DOI] [PMC free article] [PubMed] [Google Scholar]
- 10.Hu J, Rapoport TA. Fusion of the endoplasmic reticulum by membrane-bound GTPases. Semin Cell Dev Biol. 2016;60:105–111. doi: 10.1016/j.semcdb.2016.06.001. [DOI] [PubMed] [Google Scholar]
- 11.Zhang H, Hu J. Shaping the Endoplasmic Reticulum into a Social Network. Trends Cell Biol. 2016;26:934–943. doi: 10.1016/j.tcb.2016.06.002. [DOI] [PubMed] [Google Scholar]
- 12.Hu J, et al. A class of dynamin-like GTPases involved in the generation of the tubular ER network. Cell. 2009;138:549–561. doi: 10.1016/j.cell.2009.05.025. [DOI] [PMC free article] [PubMed] [Google Scholar]
- 13.Orso G, et al. Homotypic fusion of ER membranes requires the dynamin-like GTPase atlastin. Nature. 2009;460:978–983. doi: 10.1038/nature08280. [DOI] [PubMed] [Google Scholar]
- 14.Rismanchi N, Soderblom C, Stadler J, Zhu PP, Blackstone C. Atlastin GTPases are required for Golgi apparatus and ER morphogenesis. Hum Mol Genet. 2008;17:1591–1604. doi: 10.1093/hmg/ddn046. [DOI] [PMC free article] [PubMed] [Google Scholar]
- 15.Zhao G, et al. Mammalian knock out cells reveal prominent roles for atlastin GTPases in ER network morphology. Exp Cell Res. 2016;349:32–44. doi: 10.1016/j.yexcr.2016.09.015. [DOI] [PubMed] [Google Scholar]
- 16.Salinas S, Proukakis C, Crosby A, Warner TT. Hereditary spastic paraplegia: clinical features and pathogenetic mechanisms. Lancet Neurol. 2008;7:1127–1138. doi: 10.1016/S1474-4422(08)70258-8. [DOI] [PubMed] [Google Scholar]
- 17.Fischer D, et al. A novel missense mutation confirms ATL3 as a gene for hereditary sensory neuropathy type 1. Brain. 2014;137:e286. doi: 10.1093/brain/awu091. [DOI] [PubMed] [Google Scholar]
- 18.Kornak U, et al. Sensory neuropathy with bone destruction due to a mutation in the membrane-shaping atlastin GTPase 3. Brain. 2014;137:683–692. doi: 10.1093/brain/awt357. [DOI] [PubMed] [Google Scholar]
- 19.Zhao X, et al. Mutations in a newly identified GTPase gene cause autosomal dominant hereditary spastic paraplegia. Nature genetics. 2001;29:326–331. doi: 10.1038/ng758. [DOI] [PubMed] [Google Scholar]
- 20.Behrendt L, Kurth I, Kaether C. A disease causing ATLASTIN 3 mutation affects multiple endoplasmic reticulum-related pathways. Cellular and molecular life sciences : CMLS. 2019 doi: 10.1007/s00018-019-03010-x. [DOI] [PMC free article] [PubMed] [Google Scholar]
- 21.Hu X, Wu F, Sun S, Yu W, Hu J. Human atlastin GTPases mediate differentiated fusion of endoplasmic reticulum membranes. Protein Cell. 2015;6:307–311. doi: 10.1007/s13238-015-0139-3. [DOI] [PMC free article] [PubMed] [Google Scholar]
- 22.Klemm RW, et al. A conserved role for atlastin GTPases in regulating lipid droplet size. Cell Rep. 2013;3:1465–1475. doi: 10.1016/j.celrep.2013.04.015. [DOI] [PMC free article] [PubMed] [Google Scholar]
- 23.Ortiz Sandoval C, Simmen T. Rab proteins of the endoplasmic reticulum: functions and interactors. Biochem Soc Trans. 2012;40:1426–1432. doi: 10.1042/BST20120158. [DOI] [PubMed] [Google Scholar]
- 24.Pawar S, Ungricht R, Tiefenboeck P, Leroux JC, Kutay U. Efficient protein targeting to the inner nuclear membrane requires Atlastin-dependent maintenance of ER topology. eLife. 2017;6 doi: 10.7554/eLife.28202. [DOI] [PMC free article] [PubMed] [Google Scholar]
- 25.Liang JR, Lingeman E, Ahmed S, Corn JE. Atlastins remodel the endoplasmic reticulum for selective autophagy. J Cell Biol. 2018;217:3354–3367. doi: 10.1083/jcb.201804185. [DOI] [PMC free article] [PubMed] [Google Scholar]
- 26.Krols M, et al. Sensory-Neuropathy-Causing Mutations in ATL3 Cause Aberrant ER Membrane Tethering. Cell Rep. 2018;23:2026–2038. doi: 10.1016/j.celrep.2018.04.071. [DOI] [PubMed] [Google Scholar]
- 27.Leonetti MD, Sekine S, Kamiyama D, Weissman JS, Huang B. A scalable strategy for high-throughput GFP tagging of endogenous human proteins. Proc Natl Acad Sci U S A. 2016;113:E3501–3508. doi: 10.1073/pnas.1606731113. [DOI] [PMC free article] [PubMed] [Google Scholar]
- 28.Donaldson JG, Jackson CL. ARF family G proteins and their regulators: roles in membrane transport, development and disease. Nature reviews Molecular cell biology. 2011;12:362–375. doi: 10.1038/nrm3117. [DOI] [PMC free article] [PubMed] [Google Scholar]
- 29.Kudelko M, et al. Class II ADP-ribosylation factors are required for efficient secretion of dengue viruses. J Biol Chem. 2012;287:767–777. doi: 10.1074/jbc.M111.270579. [DOI] [PMC free article] [PubMed] [Google Scholar]
- 30.Volpicelli-Daley LA, Li Y, Zhang CJ, Kahn RA. Isoform-selective effects of the depletion of ADP-ribosylation factors 1-5 on membrane traffic. Mol Biol Cell. 2005;16:4495–4508. doi: 10.1091/mbc.E04-12-1042. [DOI] [PMC free article] [PubMed] [Google Scholar]
- 31.Mazelova J, et al. Ciliary targeting motif VxPx directs assembly of a trafficking module through Arf4. Embo J. 2009;28:183–192. doi: 10.1038/emboj.2008.267. [DOI] [PMC free article] [PubMed] [Google Scholar]
- 32.Chun J, Shapovalova Z, Dejgaard SY, Presley JF, Melancon P. Characterization of class I and II ADP-ribosylation factors (Arfs) in live cells: GDP-bound class II Arfs associate with the ER-Golgi intermediate compartment independently of GBF1. Mol Biol Cell. 2008;19:3488–3500. doi: 10.1091/mbc.E08-04-0373. [DOI] [PMC free article] [PubMed] [Google Scholar]
- 33.Cortese M, et al. Reciprocal Effects of Fibroblast Growth Factor Receptor Signaling on Dengue Virus Replication and Virion Production. Cell Rep. 2019;27:2579–2592 e2576. doi: 10.1016/j.celrep.2019.04.105. [DOI] [PubMed] [Google Scholar]
- 34.Yu IM, et al. Association of the pr peptides with dengue virus at acidic pH blocks membrane fusion. J Virol. 2009;83:12101–12107. doi: 10.1128/JVI.01637-09. [DOI] [PMC free article] [PubMed] [Google Scholar]
- 35.Nakai W, et al. ARF1 and ARF4 regulate recycling endosomal morphology and retrograde transport from endosomes to the Golgi apparatus. Mol Biol Cell. 2013;24:2570–2581. doi: 10.1091/mbc.E13-04-0197. [DOI] [PMC free article] [PubMed] [Google Scholar]
- 36.Moravec R, Conger KK, D'Souza R, Allison AB, Casanova JE. BRAG2/GEP100/IQSec1 interacts with clathrin and regulates alpha5beta1 integrin endocytosis through activation of ADP ribosylation factor 5 (Arf5) J Biol Chem. 2012;287:31138–31147. doi: 10.1074/jbc.M112.383117. [DOI] [PMC free article] [PubMed] [Google Scholar]
- 37.Chia PZ, Gasnereau I, Lieu ZZ, Gleeson PA. Rab9-dependent retrograde transport and endosomal sorting of the endopeptidase furin. J Cell Sci. 2011;124:2401–2413. doi: 10.1242/jcs.083782. [DOI] [PMC free article] [PubMed] [Google Scholar]
- 38.Mallet WG, Maxfield FR. Chimeric forms of furin and TGN38 are transported with the plasma membrane in the trans-Golgi network via distinct endosomal pathways. J Cell Biol. 1999;146:345–359. doi: 10.1083/jcb.146.2.345. [DOI] [PMC free article] [PubMed] [Google Scholar]
- 39.Lennemann NJ, Coyne CB. Dengue and Zika viruses subvert reticulophagy by NS2B3-mediated cleavage of FAM134B. Autophagy. 2017;13:322–332. doi: 10.1080/15548627.2016.1265192. [DOI] [PMC free article] [PubMed] [Google Scholar]
- 40.Khaminets A, et al. Regulation of endoplasmic reticulum turnover by selective autophagy. Nature. 2015;522:354–358. doi: 10.1038/nature14498. [DOI] [PubMed] [Google Scholar]
- 41.Friedman JR, Dibenedetto JR, West M, Rowland AA, Voeltz GK. Endoplasmic reticulum-endosome contact increases as endosomes traffic and mature. Mol Biol Cell. 2013;24:1030–1040. doi: 10.1091/mbc.E12-10-0733. [DOI] [PMC free article] [PubMed] [Google Scholar]
- 42.Di Mattia T, Tomasetto C, Alpy F. Faraway, so close! Functions of Endoplasmic reticulum-Endosome contacts. Biochim Biophys Acta Mol Cell Biol Lipids. 2019 doi: 10.1016/j.bbalip.2019.06.016. [DOI] [PubMed] [Google Scholar]
- 43.Iglesias NG, et al. Dengue Virus Uses a Non-Canonical Function of the Host GBF1-Arf-COPI System for Capsid Protein Accumulation on Lipid Droplets. Traffic. 2015;16:962–977. doi: 10.1111/tra.12305. [DOI] [PMC free article] [PubMed] [Google Scholar]
- 44.Faust JE, et al. The Atlastin C-terminal tail is an amphipathic helix that perturbs the bilayer structure during endoplasmic reticulum homotypic fusion. J Biol Chem. 2015;290:4772–4783. doi: 10.1074/jbc.M114.601823. [DOI] [PMC free article] [PubMed] [Google Scholar]
- 45.Wu F, Hu X, Bian X, Liu X, Hu J. Comparison of human and Drosophila atlastin GTPases. Protein Cell. 2015;6:139–146. doi: 10.1007/s13238-014-0118-0. [DOI] [PMC free article] [PubMed] [Google Scholar]
- 46.Friebe P, Boudet J, Simorre JP, Bartenschlager R. Kissing-loop interaction in the 3' end of the hepatitis C virus genome essential for RNA replication. J Virol. 2005;79:380–392. doi: 10.1128/JVI.79.1.380-392.2005. [DOI] [PMC free article] [PubMed] [Google Scholar]
- 47.Fischl W, Bartenschlager R. High-throughput screening using dengue virus reporter genomes. Methods Mol Biol. 2013;1030:205–219. doi: 10.1007/978-1-62703-484-5_17. [DOI] [PubMed] [Google Scholar]
- 48.Munster M, et al. A Reverse Genetics System for Zika Virus Based on a Simple Molecular Cloning Strategy. Viruses. 2018;10 doi: 10.3390/v10070368. [DOI] [PMC free article] [PubMed] [Google Scholar]
- 49.Kuri T, Habjan M, Penski N, Weber F. Species-independent bioassay for sensitive quantification of antiviral type I interferons. Virol J. 2010;7:50. doi: 10.1186/1743-422X-7-50. [DOI] [PMC free article] [PubMed] [Google Scholar]
- 50.Vermeire J, et al. Quantification of reverse transcriptase activity by real-time PCR as a fast and accurate method for titration of HIV, lenti- and retroviral vectors. PLoS One. 2012;7:e50859. doi: 10.1371/journal.pone.0050859. [DOI] [PMC free article] [PubMed] [Google Scholar]
- 51.Pizzato M, et al. A one-step SYBR Green I-based product-enhanced reverse transcriptase assay for the quantitation of retroviruses in cell culture supernatants. J Virol Methods. 2009;156:1–7. doi: 10.1016/j.jviromet.2008.10.012. [DOI] [PubMed] [Google Scholar]
- 52.Shalem O, et al. Genome-scale CRISPR-Cas9 knockout screening in human cells. Science. 2014;343:84–87. doi: 10.1126/science.1247005. [DOI] [PMC free article] [PubMed] [Google Scholar]
- 53.Edgar RC. MUSCLE: a multiple sequence alignment method with reduced time and space complexity. BMC Bioinformatics. 2004;5:113. doi: 10.1186/1471-2105-5-113. [DOI] [PMC free article] [PubMed] [Google Scholar]
- 54.Ronquist F, Huelsenbeck JP. MrBayes 3: Bayesian phylogenetic inference under mixed models. Bioinformatics. 2003;19:1572–1574. doi: 10.1093/bioinformatics/btg180. [DOI] [PubMed] [Google Scholar]
- 55.Stamatakis A. RAxML-VI-HPC: maximum likelihood-based phylogenetic analyses with thousands of taxa and mixed models. Bioinformatics. 2006;22:2688–2690. doi: 10.1093/bioinformatics/btl446. [DOI] [PubMed] [Google Scholar]
- 56.Le SQ, Gascuel O. An improved general amino acid replacement matrix. Mol Biol Evol. 2008;25:1307–1320. doi: 10.1093/molbev/msn067. [DOI] [PubMed] [Google Scholar]
- 57.Doerflinger SY, et al. Membrane alterations induced by nonstructural proteins of human norovirus. PLoS Pathog. 2017;13:e1006705. doi: 10.1371/journal.ppat.1006705. [DOI] [PMC free article] [PubMed] [Google Scholar]
- 58.Lee JY, et al. Spatiotemporal Coupling of the Hepatitis C Virus Replication Cycle by Creating a Lipid Droplet-Proximal Membranous Replication Compartment. Cell Rep. 2019;27:3602–3617 e3605. doi: 10.1016/j.celrep.2019.05.063. [DOI] [PubMed] [Google Scholar]
- 59.Griffiths G, Simons K, Warren G, Tokuyasu KT. Immunoelectron microscopy using thin, frozen sections: application to studies of the intracellular transport of Semliki Forest virus spike glycoproteins. Methods Enzymol. 1983;96:466–485. doi: 10.1016/s0076-6879(83)96041-x. [DOI] [PubMed] [Google Scholar]
- 60.Scaturro P, Cortese M, Chatel-Chaix L, Fischl W, Bartenschlager R. Dengue Virus Non-structural Protein 1 Modulates Infectious Particle Production via Interaction with the Structural Proteins. PLoS Pathog. 2015;11:e1005277. doi: 10.1371/journal.ppat.1005277. [DOI] [PMC free article] [PubMed] [Google Scholar]
- 61.Scaturro P, et al. An orthogonal proteomic survey uncovers novel Zika virus host factors. Nature. 2018;561:253–257. doi: 10.1038/s41586-018-0484-5. [DOI] [PubMed] [Google Scholar]
- 62.Tyanova S, Temu T, Cox J. The MaxQuant computational platform for mass spectrometry-based shotgun proteomics. Nat Protoc. 2016;11:2301–2319. doi: 10.1038/nprot.2016.136. [DOI] [PubMed] [Google Scholar]
- 63.Holze C, et al. Oxeiptosis, a ROS-induced caspase-independent apoptosis-like cell-death pathway. Nature immunology. 2018;19:130–140. doi: 10.1038/s41590-017-0013-y. [DOI] [PMC free article] [PubMed] [Google Scholar]
- 64.Tyanova S, et al. The Perseus computational platform for comprehensive analysis of (prote)omics data. Nat Methods. 2016;13:731–740. doi: 10.1038/nmeth.3901. [DOI] [PubMed] [Google Scholar]
- 65.Shannon P, et al. Cytoscape: a software environment for integrated models of biomolecular interaction networks. Genome Res. 2003;13:2498–2504. doi: 10.1101/gr.1239303. [DOI] [PMC free article] [PubMed] [Google Scholar]
Associated Data
This section collects any data citations, data availability statements, or supplementary materials included in this article.


