Abstract
目的
比较基于功能磁共振成像(fMRI)数据的熵分析方法和热门的局部一致性(ReHo)方法在检测肠易激综合征患者脑活动状态的有效性和敏感性。
方法
本研究基于54例肠易激综合征(IBS)患者与54例健康被试的静息态fMRI数据,计算所有被试体素水平上的近似熵(ApEn)。然后采用双样本t检验进行特征筛选,并用支持向量机方法对两组被试进行分类判别,得到不同特征数目下的分类性能,并将该结果与ReHo获得的特征分类性能进行对比。
结果
IBS患者与健康对照组ReHo在左侧三角部额下回、右侧顶下缘角回、左侧颞下回、左侧颞中回、左侧舌回、双侧枕中回和双侧枕上回区域差异具有统计学意义(P < 0.05),ApEn在双侧中央后回、右侧中央前回、右侧颞下回、双侧颞中回和左侧枕上回区域差异存在统计学意义(P < 0.05)。而且,无论特征数目如何变化,以ApEn为特征的识别效果均优于以ReHo为特征的识别效果。以ApEn为特征得到的分类正确率、特异性和敏感性可高达93.5%、90.7%与96.2%,而以ReHo为特征得到的分类正确率、特异性和敏感性则高达86.1%、85.1%与87.0%。
结论
与ReHo方法相比,基于fMRI的熵分析方法在IBS的识别和诊断中具有更高的敏感性和有效性。
Keywords: 近似熵, 肠易激综合征, 静息态, 功能磁共振成像, 局部一致性
Abstract
Objective
To compare the effectiveness and sensitivity of entropy and regional homogeneity (ReHo) for identifying irritable bowel syndrome (IBS) based on functional magnetic resonance imaging (fMRI).
Methods
Voxel-based approximate entropy (ApEn) was calculated based on findings of resting fMRI of 54 patients with IBS and 54 healthy control subjects. Feature selection was performed using independent sample t-test, and support vector machine was then used to classify and identify different groups. The classification performance obtained from ApEn was compared with that from ReHo.
Results
Significant differences between the two groups were found in the left triangle part of inferior prefrontal gyrus, right angular gyrus of the inferior parietal lobule, left inferior temporal gyrus, left middle temporal gyrus, left lingual gyrus, bilateral middle occipital gyrus and bilateral superior occipital gyrus for ReHo (P < 0.05), and in the bilateral postcentral gyrus, right precentral gyrus, right inferior temporal gyrus, bilateral middle temporal gyrus and left superior occipital gyrus for ApEn (P < 0.05). ApEn consistently showed better performance than ReHo regardless of the variations in the number of features. The classification accuracy, specificity and sensitivity of ApEn were 93.5185%, 90.7407% and 96.2963%, respectively, as compared with 86.1111%, 85.1852% and 87.037% of ReHo.
Conclusion
Entropy analysis based on fMRI can be more sensitive and effective than ReHo for identification of IBS.
Keywords: approximate entropy, irritable bowel syndrome, resting state, functional magnetic resonance imaging, regional homogeneity
功能磁共振成像(fMRI)的出现为无创性地揭示大脑功能活动提供了可能,这使得越来越多的人开始进行fMRI的研究。大脑功能活动十分复杂,寻求有效的fMRI数据分析方法一直是揭示大脑功能活动的难题。目前,基于fMRI的大脑功能活动的分析方法主要包括局部一致性分析(ReHo)、低频振幅分析、功能连接及脑网络等线性方法。其中,ReHo作为局部脑活动测量方法,受到学者们的广泛认可[1-5]。自2004年研究者将ReHo方法发表在NeuroImage杂志之后[3],对于ReHo方法的研究热度就持续升高[6-10]。目前,对该方法的引用率已高达1200多次[3],其对fMRI脑活动检测的有效性也不断被验证[1-12]。然而,大脑是一个十分复杂的非线性系统,通过单一的ReHo方法检测与大脑相关的疾病病理存在着很大的片面性。近年来,随着非线性分析技术的发展,熵方法开始被应用于脑fMRI研究中[13-17]。例如,Sokunbi等[14]通过模糊近似熵和样本熵测量了86名年龄在19~85岁的健康成人的静息态fMRI数据的复杂性,结果发现模糊近似熵是一种分析fMRI数据复杂性的敏感新方法;通过静息态fMRI研究发现,脑熵与人类智力呈现显著性正相关[13]。由此可见,熵分析很有可能从人脑复杂性的角度反映了人类的认知、行为、情绪和疾病状态。然而,与当前火热的ReHo分析方法相比,基于fMRI的熵分析研究还相对较少,二者在人脑活动检测以及脑疾病识别上的效果差异上也不清楚。
为了将熵方法和ReHo方法进行比较,本文选择被研究人员广泛认可的近似熵(ApEn)方法进行检测。在所有熵分析中,近似熵(ApEn))因其独有的优势使其在fMRI的研究中占有一席之地。ApEn衡量的是时间序列在维数增加一维时产生新信息的概率,用于预测系统的复杂程度,熵值变大表示时间序列的复杂度增加,熵值变小表示时间序列的复杂度减少。本文基于脑-肠互动理论,针对肠易激综合征(IBS)患者与健康对照(HC)人群这两组人的静息态fMRI数据,将非线性ApEn方法与支撑向量机(SVM)技术进行有效地结合,采用双样本t检验筛选ApEn特征,并对IBS患者与HC进行识别,然后对比以ApEn为特征与以ReHo为特征在不同数目下的分类性能,以探讨ApEn和ReHo方法在识别和诊断IBS脑疾病时的敏感性和有效性。
1. 脑影像学的ApEn和ReHo计算
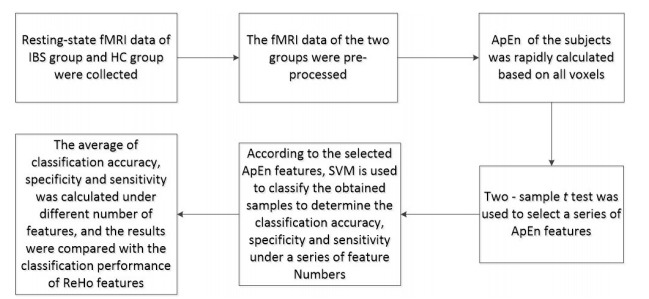
基于ApEn的特征选取及分类的完整流程如图 1所示,基于ReHo的特征选取及分类的完整流程将图 1的ApEn特征换成ReHo特征即可。
1.

基于ApEn的特征选取及分类的完整流程图
Flow diagram of feature selection and classification based on ApEn.
1.1. 影像学fMRI数据采集
影像学数据是在被试处于静息闭眼状态(未受到任何刺激,也不集中思考一件事情)下,通过德国西门子公司的3T磁共振扫描仪采用梯度平面回波成像序列得到的,其参数如下,层厚度:5 mm、矩阵大小:64×64、回波时间:30 ms、重复时间:2 s、翻转角度:90°、层内分辨率:3.75 mm×3.75 mm。每个被试的扫描过程需要6 min,共采集180个时间点。在扫描过程中,被试被要求保持清醒并放松的状态,同时使用乌龙头线圈和泡沫垫子固定被试头部避免头动。在本研究中,影像学数据包含54例IBS患者,以及与患者年龄、性别相匹配的54例HC,其人口统计学信息如表 1所示。
1.
受试者人口统计学信息
Demographic data of the subjects
| Items | Healthy controls | Patients with irritable bowl synrome | P |
| Gender (male/female) | 27/27 | 27/27 | - |
| Age (years) | 22±1 | 22±1 | 0.49 |
| Height (cm) | 163±7 | 165±7 | 0.26 |
| Weight (kg) | 54±7 | 55±8 | 0.58 |
1.2. 影像学fMRI数据预处理
本文对影像学数据的预处理是基于中科院心理研究所开发的DPABI软件工具包[8]进行的,主要步骤包括:(1)将fMRI的原始DICOM数据转换为NIFTI数据;(2)去除所有时间序列中的前10个时间点,避免扫描仪的不稳定及被试的不适应性等因素对结果的影响;(3)进行时间层校正,消除层与层的扫描时间差异;(4)进行头动校正,去除头部移动大于1.5 mm或者旋转角度大于1.5°的被试数据,避免在扫描期间头动对结果的影响;(5)进行空间标准化,消除不同个体大脑形态的差异;(6)进行去线性漂移及带通滤波,去除扫描仪及生理活动产生的噪声,提高信噪比,其中带通滤波频率为0.01~0.08 Hz。
1.3. 局部一致性方法在静息态fMRI中的实现过程
本研究中,经过预处理后的脑图像共包含70 831个3.75 mm×3.75 mm×5 mm大小的体素,每一个体素对应着一个时间序列。ReHo分析方法是Zang等[3]提出的一种研究fMRI的数据驱动方法,它所基于的假设是相邻体素的时间序列是相似的,它是通过计算给定体素与周围相邻体素的肯德尔相关系数(KCC)来探索大脑功能活动,该值的大小反映了给定体素与周围相邻体素的一致性大小。对上述预处理之后得到的脑图像,进行ReHo分析,其计算公式如下:
 |
1 |
其中W表示给定体素的KCC值,Ri表示第i个时间点的秩和,R是所有Ri的平均值,K是任一体素及其相邻体素的总数目,K一般为7、19、27(本文K取27),n为时间点的数目。
1.4. 近似熵方法在静息态fMRI中的实现过程
针对预处理后的脑图像,对逐个体素进行ApEn求解,具体步骤如下:
(1)设预处理后fMRI每个个体数据的脑图像有n个(即时间序列的长度为n),全脑有1个体素;
(2)提取全脑体素的时间序列,矩阵形式如下:
 |
其中,每一列表示一个体素的时间序列。
(3)针对第t个体素的时间序列X(t)= X(:, t),将其重构成m=2维向量,向量形式如下:
 |
(4)计算任一向量Xi(t)与所有向量Xj(t), j=1, 2, ⋯n-m+1之间的距离,此时的距离为两向量对应元素差值绝对值的最大值,其计算公式如下:
 |
2 |
(5)给定阈值f=r×SD(其中SD是原始一维时间序列的标准差),对任一向量Xi(t)统计该向量与所有向量之间距离小于阈值的数目,并计算出其所占向量对总数n-m+1的比值,记为Cmi(t);
(6)将Cmi(t)取对数,求其平均值,记为Φm(t),其计算公式如下:
 |
3 |
(7)维数m增加1,重复步骤(3)~(6),求得Φm+1(t);
(8)将求得的Φm(t)和Φm+1(t)作差,其结果即为ApEn(t),其计算公式如下:
 |
4 |
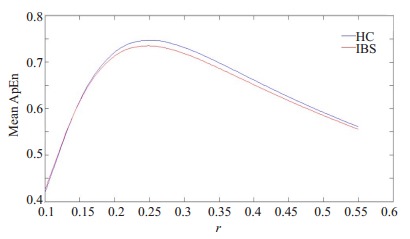
ApEn方法中,参数m与r均有给定的推荐值,m的推荐值为2,r的推荐值为0.1~0.2。然而最近的研究[11]表明对于fMRI这种动态变化的神经信号,参数r的推荐值并不是很合适。为选取一个合适的参数r,本文计算了HC组与IBS组在一系列r值下的平均ApEn,其值随r的变化曲线如图 2所示。从图 2中可以看出,随着r的增加,HC组与IBS组的平均ApEn的差距先逐渐增大后逐渐减小,当r=0.25~0.35时,HC组与IBS组的平均ApEn差距较大,这说明r=0.25~0.35下的ApEn可以较好的区分HC与IBS患者。因此,本文的参数r可取为0.25。
2.

HC组与IBS组的平均ApEn随r的变化曲线
Changes of mean ApEn with r in IBS patients and healthy control subjects.
1.5. 统计分析
针对步骤1.3与1.4得到的ReHo与ApEn,将其生成相应的ReHo图与ApEn图,并进行统计分析,其具体步骤如下:(1)对得到的ReHo图与ApEn图取4 mm×4 mm×4 mm半高宽平滑核进行高斯平滑;(2)对平滑后的ReHo图与ApEn图,采用双样本t检验进行两组数据的统计分析,检测其功能活动存在组差异的区域。
2. 特征选取和模式识别
2.1. 基于t检验的特征选择
fMRI数据的超高维特性使得提取的特征维数过高,过高的特征维数不仅可能使得分类精度低,而且需要耗费大量的计算时间。因此,往往需要采取合适的方法对高维特征进行优化选取。本文主要针对得到的高维特征向量,采用双样本t检验(P < 0.05)进行特征选择,其步骤如下:(1)采用双样本t检验分别对两组被试全脑ReHo与ApEn进行统计分析,确定具有显著性的体素;(2)针对ReHo与ApEn存在显著性差异的体素,按其对应的P值进行排序,选取那些p值较小的体素(即差异较大的体素)对应的ReHo与ApEn作为分类特征。为了更好地比较ReHo和ApEn,本研究将特征数目在10~100的范围内,每隔10取一个值进行广泛探索。
2.2. 基于SVM的fMRI数据分类
fMRI数据具有小样本、超高维等特点。SVM是由Cortes等[18]首次提出的,其原理是通过一个非线性映射,将样本空间映射到高维空间,使得在原有空间线性不可分的问题转换为特征空间中的线性可分的问题。通过比较SVM与其他分类算法,最终得出SVM在解决小样本、非线性及高维模式识别等问题上具有明显的优势[19-20]。因此,本文采用SVM对fMRI数据进行分类识别。
本文SVM的分类是基于Matlab的LIBSVM软件工具包[21]实现的。我们知道,SVM的参数设置对分类效果的好坏有着重要的影响。在本文中,SVM的核函数采用RBF,最优参数C/g由网格搜索法确定,即尝试各种可能的(C, g)对值,然后进行交叉验证,找出使交叉验证精确度最高的(C, g)对,其中参数C是指惩罚因子,g是指核函数的半径。本文采用留一法交叉验证来评估ApEn和ReHo作为特征对IBS患者的识别能力,即每执行一次评估需要保留一个样本作为测试集,其它样本作为训练集。具体来说是,针对所有样本(共108个),分类迭代108次,每次将一个样本的特征用于测试集,剩余的107个样本特征用于训练集,采用SVM进行分类,直到所有的样本都被作为测试集一次且只作为一次时迭代停止。此时计算出每次迭代后得到的分类正确率、特异性和敏感性,并求平均值,将其作为对应的特征数目下分类性能的度量。其中,分类正确率是指所有样本被正确分类的比例,特异性是指健康人被正确分类的比例,敏感性是指病人被正确分类的比例。
3. 结果
3.1. 影像学组差异
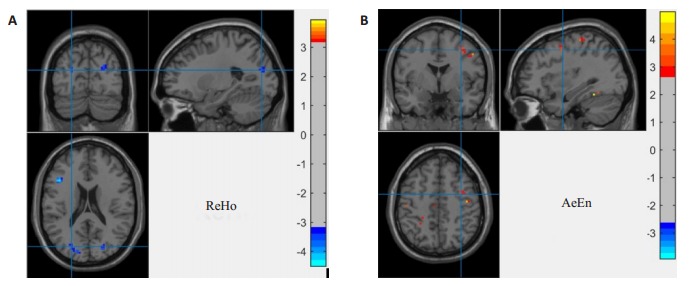
本文采用双样本t检验对平滑后的ReHo图与ApEn图分别进行统计分析,确定HC组与IBS组的差异区域,其结果如图 3所示,详情见表 2、3。从图 3A和表 2中可以看出,HC与IBS的ReHo差异区域主要分布在左侧三角部额下回、右侧顶下缘角回、左侧颞下回、左侧颞中回、左侧舌回、双侧枕中回和双侧枕上回。从图 3B和表 3可以看出,HC与IBS的ApEn差异区域主要分布在双侧中央后回、右侧中央前回、右侧颞下回、双侧颞中回和左侧枕上回。IBS患者在额叶、颞叶、枕叶及中央后回区域的功能活动存在差异在现有的IBS研究中均有相关报道[22-23],这与本文ReHo方法、ApEn方法得到的结果存在一定的一致性。
3.

HC与IBS患者的差异区域图
Brain regions showing significant differences between healthy control subjects and IBS patients identified based on ReHo method (A) and ApEn method (B).
2.
HC与IBS的ReHo差异区域分布
Brain regions with significant ReHo differences between healthy control subjects and IBS patients
| Brain regions with group differences | MNI coordinates at peak voxel | Number of voxels | T (HC-IBS) | ||
| x | y | z | |||
| Left triangular part of inferior frontal gyrus | -42 | 21 | 21 | 23 | -4.5147 |
| right angular gyrus | 54 | -45 | 45 | 36 | 3.9438 |
| left inferior temporal gyrus/middle temporal gyrus | -48 | -57 | -6 | 43 | -3.7589 |
| Left lingual gyrus | -15 | -63 | 0 | 24 | -3.5765 |
| Left middle occipitalgyrus/superior occipital gyrus | -18 | -84 | 18 | 81 | -4.0734 |
| Right middle occipitalgyrus/superior occipital gyrus | 24 | -81 | 24 | 64 | -3.9364 |
3.
HC与IBS的ApEn差异区域分布
Brain regions with significantApEn differences between healthy control subjects and IBS patients
| Brain regions with group differences | MNI coordinates at peak voxel | Number of voxels | T (HC-IBS) | ||
| x | y | z | |||
| Left postcentral gurus | -24 | -36 | 54 | 32 | 3.5961 |
| Right precentral gyrus/postcentral gyrus | 42 | -12 | 48 | 45 | 4.2628 |
| Right inferior temporal gyrus/middle temporal gyrus | 57 | -60 | -9 | 38 | 3.5823 |
| Left middle temporal gyrus | -54 | -57 | 9 | 22 | 3.6769 |
| Left superior occipital gyrus | -21 | -75 | 18 | 23 | 4.202 |
3.2. 特征提取与模式识别
针对ReHo方法与ApEn方法得到的ReHo特征与ApEn特征,采用双样本t检验进行筛选,分别将70 831个体素减少到4759个具有显著性差异的体素与6280个具有显著性差异的体素。针对得到的具有显著性差异的体素,选取多个不同数目的ReHo特征与ApEn特征进行分类,分别计算ReHo特征与ApEn特征在不同特征数目下的分类正确率、特异性和敏感性的均值,其值随特征数目的变化情况如表 4、5所示。对比表 4与表 5可以看出,无论特征数目如何变化,以ApEn为特征得到的分类正确率、特异性和敏感性均大于以ReHo为特征的分类正确率、特异性和敏感性。在特征数目为30时,以ApEn为特征得到的分类正确率、特异性和敏感性高达93.5%、90.7%与96.2%。在特征数目为60时,以ReHo为特征得到的分类正确率、特异性和敏感性高达86.1%、85.1%与87.0%。
4.
不同ReHo特征数目下的分类正确率、特异性和敏感性
Accuracy, specificity and sensitivity of classification based on different numbers of ReHo features
| Number of features | 10 | 20 | 30 | 40 | 50 | 60 | 70 | 80 | 90 | 100 |
| Accuracy | 77.7 | 79.6 | 70.3 | 77.7 | 78.7 | 86.1 | 82.4 | 82.4 | 79.6 | 79.6 |
| Specificity | 77.7 | 75.9 | 61.1 | 75.9 | 77.7 | 85.1 | 79.6 | 81.4 | 77.7 | 75.9 |
| Sensitivity | 77.7 | 83.3 | 79.6 | 79.6 | 79.6 | 87.0 | 85.1 | 83.3 | 81.4 | 83.3 |
5.
不同ApEn特征数目下的分类正确率、特异性和敏感性
Accuracy, specificity and sensitivity of classification based on different numbers ofApEn features
| Number of features | 10 | 20 | 30 | 40 | 50 | 60 | 70 | 80 | 90 | 100 |
| Accuracy | 86.1 | 90.7 | 93.5 | 89.8 | 89.8 | 87.9 | 89.8 | 88.8 | 87.9 | 88.8 |
| Specificity | 83.3 | 87.0 | 90.7 | 88.8 | 85.1 | 85.1 | 85.1 | 83.3 | 83.3 | 87.0 |
| Sensitivity | 88.8 | 94.4 | 96.2 | 90.7 | 94.4 | 90.7 | 94.4 | 94.4 | 92.5 | 90.7 |
4. 讨论
本文采用ReHo方法与ApEn方法计算静息态fMRI数据的ReHo与ApEn,并通过双样本t检验进行筛选,借助机器学习方法进行HC与IBS患者的自动识别,对比以ReHo为特征与以ApEn为特征得到的三个分类性能指标。结果发现,ReHo方法与ApEn方法均发现HC与IBS患者在左侧枕上回与左侧颞中回差异具有统计学意义,然而这两种方法确定的差异区域并不完全一样。而且,无论特征如何变化,以ApEn为特征的分类效果均优于以ReHo为特征的分类效果。
IBS作为功能性胃肠病中最常见的类型之一[24-26],因其发病率高、发病机制复杂,对患者的生活质量有严重的影响,已经成为消化内科门诊病人就医的主流疾病之一,为社会医疗增添了巨大的负担[27]。随着技术的进步,人们认知水平的提高,IBS已经被看成一种涉及到中枢神经系统、肠神经系统、自主神经系统、脑-肠态等多方面的疾病[22, 28-30]。近年来,大量研究者通过磁共振图像对IBS的病理生理学基础进行研究和探讨[31-33]。有研究总结了27个用神经影像技术来探索IBS患者病理学机制的研究论文[34]。结果显示,在静息态fMRI研究中,IBS患者最常见的异常活动位于脑岛;在内脏膨胀刺激研究中,最敏感、最容易被激活的脑区位于脑岛、前扣带、杏仁核、中扣带和前额叶;在结构磁共振研究中,主要发现了IBS患者前脑岛皮层厚度的减少和后中央回皮层厚度/灰质体积的增加。除此之外,还有一些多模态磁共振成像结合研究,结合静息态fMRI和弥散张量成像数据来观察IBS患者大脑两半球之间功能和结构的改变,结果发现与健康对照组相比,IBS患者在丘脑、楔叶、后扣带、舌回和枕叶的两半球之间的功能连接增加,在前扣带腹侧和顶下回的两半球之间的功能连接减少[35],但是并未发现这些脑区之间白质纤维结构的改变;他们在同年还发表文章报道,IBS患者部分本质脑活动异常可能与高水平的焦虑和抑郁有关[36]。Bhatt等[37]调查了32名IBS女性和26健康对照组的静息态功能连接和灰质体积,结果发现,与健康对照组相比,IBS女性患者在丘脑、尾状核、伏隔核、中扣带前部和背外侧前额叶处的灰质体积减少,并在中扣带前部和前楔叶之间的功能连接降低,在尾状核和前中央的功能连接增大。以上研究表明,通过脑中枢神经系统的研究为揭示IBS的病理生理学机制提供重要的推动作用[22, 28-30, 38]。
在本研究中,以IBS患者为研究对象,通过比较ApEn和ReHo的分析结果可知,二者检测的IBS患者中枢功能异常存在差异。相比于ReHo而言,ApEn结果检测出双侧后中央回的异常,而相比于ApEn而言,ReHo检测出左侧舌回、右侧角回和左侧额下回三角部的异常。这些异常在以前的IBS相关影像学研究中均有报道,但ApEn检测出的异常要比ReHo检测出的异常在判别IBS时性能更好,这就意味着通过ApEn进行IBS中枢病理生理学机制研究具有更高的有效性。
综上所述,与当前火热的ReHo方法相比,熵分析方法在IBS的识别和诊断中可能具有更高的敏感性和有效性。然而本研究仍存在不足之处:(1)本研究样本数量相对较少,在未来的研究中需要采集更多的样本来进一步验证该研究结果;(2)ReHo与ApEn均是有效识别HC与IBS患者的有效指标,在今后的研究中应当寻求一种有效的特征融合方法,从而更好地提取有效的判别特征。
Biography
南姣芬,博士,讲师,E-mail:nanjiaofen@163.com
Funding Statement
国家自然科学基金(81501548, 81501547)
Supported by National Natural Science Foundation of China (81501548, 81501547)
Contributor Information
南 姣芬 (Jiaofen NAN), Email: nanjiaofen@163.com.
卢 振泰 (Zhentai LU), Email: luzhentai@163.com.
References
- 1.Wang S, Wang GD, Lv HL, et al. Abnormal regional homogeneity as potential imaging biomarker for psychosis risk syndrome: a restingstate fMRI study and support vector machine analysis. https://www.ncbi.nlm.nih.gov/pmc/articles/PMC4897690/ Sci Rep. 2016;6(8):27619. doi: 10.1038/srep27619. [DOI] [PMC free article] [PubMed] [Google Scholar]
- 2.Paakki JJ, Rahko J, Long XY, et al. Alterations in regional homogeneity of resting-state brain activity in autism spectrum disorders. http://d.old.wanfangdata.com.cn/NSTLQK/10.1016-j.brainres.2009.12.081/ Brain Res. 2010;19(3):169–79. doi: 10.1016/j.brainres.2009.12.081. [DOI] [PubMed] [Google Scholar]
- 3.Zang Y, Jiang T, Lu Y, et al. Regional homogeneity approach to fMRI data analysis. Neuroimage. 2004;22(1):394–400. doi: 10.1016/j.neuroimage.2003.12.030. [DOI] [PubMed] [Google Scholar]
- 4.Wu T, Long XY, Zang YF, et al. Regional homogeneity changes in patients with parkinson's disease. Hum Brain Mapp. 2009;30(5):1502–10. doi: 10.1002/hbm.20622. [DOI] [PMC free article] [PubMed] [Google Scholar]
- 5.Liu HH, Liu Z, Liang M, et al. Decreased regional homogeneity in schizophrenia: a resting state functional magnetic resonance imaging study. Neuroreport. 2006;17(1):19–22. doi: 10.1097/01.wnr.0000195666.22714.35. [DOI] [PubMed] [Google Scholar]
- 6.Wang C, Shen Z, Huang P, et al. Altered spontaneous activity of posterior cingulate cortex and superior temporal gyrus are associated with a smoking cessation treatment outcome using varenicline revealed by regional homogeneity. https://link.springer.com/article/10.1007%2Fs11682-016-9538-1. Brain Imaging Behav. 2016;11(3):611–8. doi: 10.1007/s11682-016-9538-1. [DOI] [PubMed] [Google Scholar]
- 7.Takeuchi H, Taki Y, Nouchi R, et al. Regional homogeneity, restingstate functional connectivity and amplitude of low frequency fluctuation associated with creativity measured by divergent thinking in a sex-specific manner. https://linkinghub.elsevier.com/retrieve/pii/S1053811917301891. Neuroimage. 2017;152(15):258–69. doi: 10.1016/j.neuroimage.2017.02.079. [DOI] [PubMed] [Google Scholar]
- 8.Bernier M, Croteau E, Castellano CA, et al. Spatial distribution of resting-state BOLD regional homogeneity as a predictor of brain glucose uptake: A study in healthy aging. https://www.ncbi.nlm.nih.gov/pubmed/28130193. Neuroimage. 2017;150(15):14–22. doi: 10.1016/j.neuroimage.2017.01.055. [DOI] [PubMed] [Google Scholar]
- 9.Geng JT, Yan R, Shi JB, et al. Altered regional homogeneity in patients with somatic depression: A resting-state fMRI study. J Affect Disord. 2019;246(1):498–505. doi: 10.1016/j.jad.2018.12.066. [DOI] [PubMed] [Google Scholar]
- 10.Wang TY, Li SM, Jiang GH, et al. Regional homogeneity changes in patients with primary insomnia. Eur Radiol. 2016;26(5):1292–300. doi: 10.1007/s00330-015-3960-4. [DOI] [PubMed] [Google Scholar]
- 11.Kim H, Kim YK, Gwak AR, et al. Resting-state regional homogeneity as a biological marker for patients with Internet gaming disorder: A comparison with patients with alcohol use disorder and healthy controls. https://www.ncbi.nlm.nih.gov/pubmed/25689820. Prog Neuropsychopharmacol Biol Psychiatry. 2015;60(3):104–11. doi: 10.1016/j.pnpbp.2015.02.004. [DOI] [PubMed] [Google Scholar]
- 12.Jiang L, Zuo XN. Regional homogeneity: a multimodal, multiscale neuroimaging marker of the human connectome. Neuroscientist. 2016;22(5):486–505. doi: 10.1177/1073858415595004. [DOI] [PMC free article] [PubMed] [Google Scholar]
- 13.Saxe GN, Calderone D, Morales LJ. Brain entropy and human intelligence: A resting-state fMRI study. PLoS One. 2018;13(2):e0191582. doi: 10.1371/journal.pone.0191582. [DOI] [PMC free article] [PubMed] [Google Scholar]
- 14.Sokunbi MO, Cameron GG, Ahearn TS, et al. Fuzzy approximate entropy analysis of resting state fMRI signal complexity across the adult Life span. Med Eng Phys. 2015;37(11):1082–90. doi: 10.1016/j.medengphy.2015.09.001. [DOI] [PubMed] [Google Scholar]
- 15.Sokunbi MO, Fung W, Sawlani V, et al. Resting state fMRI entropy probes complexity of brain activity in adults with ADHD. https://core.ac.uk/display/42516237. Psych ResNeuro. 2013;214(3):341–8. doi: 10.1016/j.pscychresns.2013.10.001. [DOI] [PubMed] [Google Scholar]
- 16.Wang Z, Li Y, Childress AR, et al. Brain entropy mapping using fMRI. PLoS One. 2014;9(3):e89948. doi: 10.1371/journal.pone.0089948. [DOI] [PMC free article] [PubMed] [Google Scholar]
- 17.Sokunbi MO. Sample entropy reveals high discriminative power between young and elderly adults in short fMRI data sets. https://core.ac.uk/display/42516235. Front Neuroinform. 2014;8(3):69. doi: 10.3389/fninf.2014.00069. [DOI] [PMC free article] [PubMed] [Google Scholar]
- 18.Cortes C, Vapnik V. Support-Vector networks. http://d.old.wanfangdata.com.cn/Periodical/hwyhmb200803006 Mach Learn. 1995;20(3):273–97. [Google Scholar]
- 19.Banerjee TP, Das S. Multi-sensor data fusion using support vector machine for motor fault detection. https://linkinghub.elsevier.com/retrieve/pii/S0020025512004185 Inf Sci (Ny) 2012;217(12):96–107. [Google Scholar]
- 20.Park HS, Cho SB. Evolutionary attribute ordering in Bayesian networks for predicting the metabolic syndrome. Expert Syst Appl. 2012;39(4):4240–9. doi: 10.1016/j.eswa.2011.09.110. [DOI] [Google Scholar]
- 21.Chang CC, Lin CJ. LIBSVM: A library for support vector machines. http://d.old.wanfangdata.com.cn/Periodical/jdq201315008 ACM Transactions on Intelligent Systems and Technology. 2011;2(3, SI):27. [Google Scholar]
- 22.Nan JF, Yang WY, Meng PT, et al. Changes of the postcentral cortex in irritable bowel syndrome patients. https://link.springer.com/article/10.1007%2Fs11682-019-00087-7. Brain Imaging Behav. 2019;29(3):1–11. doi: 10.1007/s11682-019-00087-7. [DOI] [PubMed] [Google Scholar]
- 23.Ma XF, Li SM, Tian JZ, et al. Altered brain spontaneous activity and connectivity network in irritable bowel syndrome patients: a restingstate fMRI study. Clin Neurophysiol. 2015;126(6):1190–7. doi: 10.1016/j.clinph.2014.10.004. [DOI] [PubMed] [Google Scholar]
- 24.Ghoshal UC, Singh R. Frequency and risk factors of functional gastro-ntestinal disorders in a rural Indian population. J Gastroen Hepatol. 2017;32(2):378–87. doi: 10.1111/jgh.13465. [DOI] [PubMed] [Google Scholar]
- 25.Lewis ML, Palsson OS, Whitehead WE. Prevalence of functional gastrointestinal disorders in children and adolescents. http://d.old.wanfangdata.com.cn/OAPaper/oai_doaj-articles_34390af5a34572994107008989a3cb74. J Pediatr. 2016;177, 12(8):39–43. doi: 10.1016/j.jpeds.2016.04.008. [DOI] [PubMed] [Google Scholar]
- 26.Drossman DA. Functional gastrointestinal disorders: history, pathophysiology, clinical features, and Rome Ⅳ. Gastroenterology. 2016;150(6):1262–79. doi: 10.1053/j.gastro.2016.02.032. [DOI] [PubMed] [Google Scholar]
- 27.Chatila R, Merhi M, Hariri E, et al. Irritable bowel syndrome: prevalence, risk factors in an adult Lebanese population. BMC Gastroenterol. 2017;17(1):137. doi: 10.1186/s12876-017-0698-2. [DOI] [PMC free article] [PubMed] [Google Scholar]
- 28.Tillisch K, Labus JS, Naliboff BD. Neuroimaging of brain-gut interactions in functional gastrointestinal disorders. https://www.sciencedirect.com/science/article/pii/B9780123820266000257 Physi Gastrointestin Tract. 2018;25(7):419–28. [Google Scholar]
- 29.Nan JF, Zhang LL, Chen QQ, et al. White matter microstructural similarity and diversity of functional constipation and constipationpredominant irritable bowel syndrome. J Neurogastroenterol Motil. 2018;24(1):107–18. doi: 10.5056/jnm17038. [DOI] [PMC free article] [PubMed] [Google Scholar]
- 30.Icenhour A, Langhorst J, Benson S, et al. Neural circuitry of abdominal pain-elated fear learning and reinstatement in irritable bowel syndrome. Neurogastroent Motil. 2015;27(1):114–27. doi: 10.1111/nmo.12489. [DOI] [PubMed] [Google Scholar]
- 31.Dinan TG, Cryan JF. Gut-rain axis in 2016: Brain-ut-icrobiota axisood, metabolism and behaviour. Nat Rev Gastro Hepat. 2017;14(2):69–70. doi: 10.1038/nrgastro.2016.200. [DOI] [PubMed] [Google Scholar]
- 32.Liu P, Qin W, Wang JJ, et al. Identifying neural patterns of functional dyspepsia using multivariate pattern analysis: a resting-state fMRI study. PLoS One. 2013;8(7):e68205. doi: 10.1371/journal.pone.0068205. [DOI] [PMC free article] [PubMed] [Google Scholar]
- 33.Lee IS, Preissl H, Enck P. How to perform and interpret functional magnetic resonance imaging studies in functional gastrointestinal disorders. J Neurogastroenterol Motil. 2017;23(2):197–207. doi: 10.5056/jnm16196. [DOI] [PMC free article] [PubMed] [Google Scholar]
- 34.Kristen R, Weaver, et al. Neuroimaging the brain-gut axis in patients with irritable bowel syndrome. World J Gastrointest Pharmacol Ther. 2016;7(2):320–33. doi: 10.4292/wjgpt.v7.i2.320. [DOI] [PMC free article] [PubMed] [Google Scholar]
- 35.Qi RF, Liu C, Weng YF, et al. Disturbed interhemispheric functional connectivity rather than structural connectivity in irritable bowel syndrome. https://www.ncbi.nlm.nih.gov/pubmed/27999530. Front Mol Neurosci. 2016;9(2):141. doi: 10.3389/fnmol.2016.00141. [DOI] [PMC free article] [PubMed] [Google Scholar]
- 36.Qi RF, Liu C, Ke J, et al. Intrinsic brain abnormalities in irritable bowel syndrome and effect of anxiety and depression. Brain Imaging Behav. 2016;10(4):1127–34. doi: 10.1007/s11682-015-9478-1. [DOI] [PubMed] [Google Scholar]
- 37.Bhatt RR, Gupta A, Labus JS, et al. Altered brain structure and functional connectivity and its relation to pain perception in girls with irritable bowel syndrome. Psychosom Med. 2019;81(2):146–54. doi: 10.1097/PSY.0000000000000655. [DOI] [PMC free article] [PubMed] [Google Scholar]
- 38.Koloski NA, Jones M, Talley NJ. Evidence that independent gut-tobrain and brain-to-gut pathways operate in the irritable bowel syndrome and functional dyspepsia: a 1-year population-based prospective study. Aliment Pharm Ther. 2016;44(6):592–600. doi: 10.1111/apt.13738. [DOI] [PubMed] [Google Scholar]


