Abstract
In the present paper, the reduction reaction of high-purity MoO3 with CO–15 vol % CO2 mixed gases in the temperature range of 901–948 K is investigated via the thermogravimetric analysis technology. The results show that reduction of MoO3 to MoO2 follows a three-step reaction process, viz., MoO3 is first reduced into Mo9O26, followed by Mo4O11, and finally to MoO2. The reaction sequences of MoO3 → Mo9O26 → Mo4O11 → MoO2 are proposed, which are quite different from those observed on reduction of MoO3 by pure H2 or CO gases. Pure Mo9O26 and Mo4O11 could be synthesized once suitable time was controlled. Rate-controlling steps for the reduction from MoO3 to Mo9O26 and Mo9O26 to MoO2 (include both Mo9O26 to Mo4O11 and Mo4O11 to MoO2) are interfacial chemical reactions, with the activation energies of 318.326 and 112.047 kJ/mol, respectively. This study also discovers that the as-synthesized MoO2 keeps the same platelet-shaped and smooth morphology as the MoO3 raw material; however, its particles size gradually increased as the reaction proceeds due to the formation of low-melting-point eutectic and the sticking of different particles.
1. Introduction
Molybdenum dioxide (MoO2) possesses a high melting point (>2773 K)1 and density (6.47 g/cm3)2 and a low oxygen content, which have made it become a potential Mo source for the direct alloying steelmaking or production of ferromolybdenum alloys.3 Compared to molybdenum trioxide (MoO3; melting point: 1068 K; density: 4.692 g/cm3),4,5 MoO2 will not sublime at the normal steelmaking temperature (1773 K) and could increase the transport or smelting process, which will further increase the yield of molybdenum (Mo) greatly. Therefore, the preparation of MoO2 has attracted much attention in recent years and many routes have been developed. These routes include hydrogen reduction (reduction of MoO3 with pure H2),6,7 water vapor oxidation (oxidation of molybdenum sulfide concentrate with water vapor),8,9 and solid-phase reaction (roasting of mixed MoS2 and MoO3 powders).10,11 As for the gas–solid reaction, H2 gas as the reducing agent has been widely studied,6,7 and pure CO gas was also adopted in our previous work.12 However, CO–15 vol % CO2 mixed gases as the reducing gases have never been used before. In this paper, one of the purposes is to explore a new approach for the preparation of MoO2, so pure H2 or CO was not adopted, and then the CO–15 vol % CO2 mixed gases were used instead.
Recently, synthesis of tungsten carbides (W2C) by the reduction–carburization of MoO3 with different reducing gases has been widely reported.13−16 However, related study for the preparation of molybdenum carbides (Mo2C), especially for the use of CO as the reducing gas, was lacking.17 In our previous work,18 CO gas was first adopted to produce Mo2C by using MoO3 as the raw material, in which it was discovered that the preparation processes mainly proceeded following two stages: the reduction of MoO3 to MoO2 and the carburization from MoO2 to Mo2C. The characterizations of the intermediate product MoO2 having great influences on those of the final product Mo2C were also concluded. To avoid the occurrence of carbon deposition reaction, as shown in eq 1, a certain volume fraction of CO2 was also added into the reducing gases. It was found12 that when the volume fraction of CO2 is about 15 vol %, the reaction kinetics curve is very similar to that of pure CO in the initial period; in the latter period, the reaction rate is still very rapid, which is much faster than that obtained by using pure CO due to the inhibiting effect of carbon deposition reaction, and then pure MoO2 or Mo2C could be easily obtained. When the volume fraction of CO2 increased to 30 vol % or more, however, the reaction rate will be decreased largely, which was not beneficial for the preparation of MoO2. Therefore, CO–15 vol % CO2 mixed gases were selected for the preparation of MoO2 in the current paper, which could also be used for the preparation of Mo2C. Furthermore, the reduction mechanism and kinetics of MoO3 to MoO2 by H2 have been widely studied.19−22 However, related studies for the reaction processes of MoO3 to MoO2 or MoO3 to Mo2C by CO–15 vol % CO2 mixed gases were extremely scarce. To understand the whole reaction processes from MoO3 to Mo2C, the reduction mechanism and kinetics of MoO3 to MoO2 were studied first, which could also act as a preliminary work for the preparation of Mo2C
| 1 |
As mentioned above, one of the current objectives is to develop a new and simple method for the preparation of MoO2 with the use of CO–CO2 mixed gases (CO–15 vol % CO2 mixed gases are selected as the reducing gases due to the good inhibiting effect on the carbon deposition reaction and the rapid reaction rate). At the same time, the reduction mechanism and kinetics of MoO3 to MoO2 by the CO–15 vol % CO2 mixed gases are illustrated, which will further give a better understanding on the reduction–carburization mechanism from MoO3 to Mo2C.
2. Results
2.1. Thermogravimetric-Differential Thermal Analysis (TG-DTA) Experiments
The mass loss ratio (defined as Wt) of high-purity MoO3 reduced by CO–15 vol % CO2 mixed gases was calculated by eq 2
| 2 |
where m0 and mt are the masses of initial sample and that reduced for a period of time t, respectively.
Reduction extent (defined as α) of the sample was calculated as the ratio of mass loss ratio Wt to the theoretical maximum mass loss ratio Wmax, as shown in eq 3
| 3 |
2.1.1. Nonisothermal TG-DTA Experiments
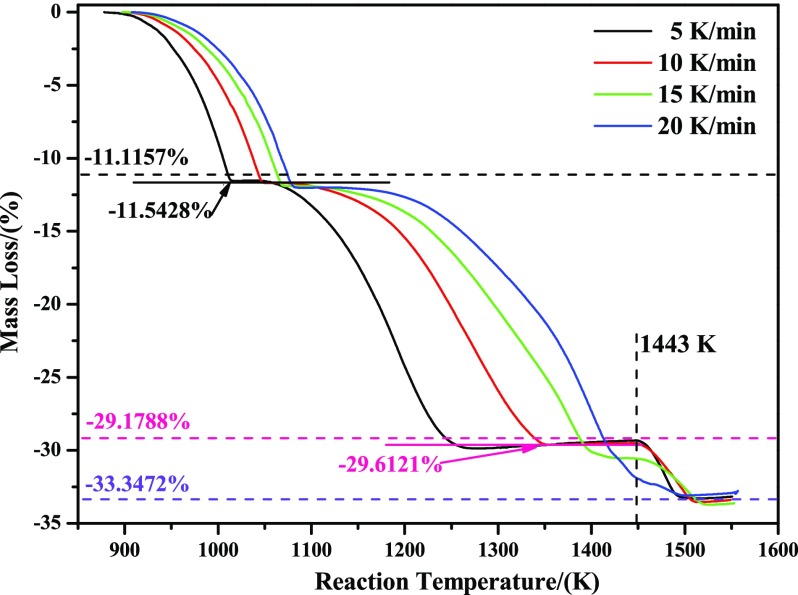
Figure 1 shows the nonisothermal TG curves of reducing high-purity MoO3 with CO–15 vol % CO2 mixed gases from room temperature to 1550 K under four different heating rates: 5, 10, 15, and 20 K/min. From Figure 1, it can be clearly seen that the total reaction processes can be divided into three different stages with respect to the heating rates of 5, 10, and 15 K/min. The first stage is in the range of mass loss ratio from zero to −11.5428%, which is almost consistent with −11.1157% (corresponding to the mass change from MoO3 to MoO2, as shown in eq 4). Therefore, it can be deduced that the main reaction is the reduction of MoO3 to MoO2 in the first stage. The mass loss ratio for the second stage is −29.6121%, which is almost in good agreement with −29.1788% (corresponding to the mass change from MoO3 to Mo2C, as shown in eq 5). If considering the newly as-formed MoO2 as the reactant, then the main reaction in the second stage is the reduction of MoO2 to Mo2C, as shown in eq 6. The third stage is the final platform section, corresponding to the mass loss ratio of −33.3472%, which is exactly equal to the theoretical maximum mass loss ratio from MoO3 to metallic Mo, as shown in eq 7. As for the case of 20 K/min, however, the TG curve is a little different from the above three cases (this experiment at the heating rate of 20 K/min was conducted twice, and the results are almost the same). The first stage is almost the same as the lower heating rates (5, 10, and 15 K/min), that is, the mass loss ratio is also from zero to −11.5428%; as the temperature increases, the second and third stages are nearly overlapped and no obvious stable region existed; however, the final mass loss ratio is still equal to −33.3472%. All in all, it can be concluded that reduction of MoO3 with CO–15 vol % CO2 mixed gases can be divided into three main stages in the temperature range of room temperature to 1550 K: the first is from MoO3 to MoO2, then from MoO2 to Mo2C, and finally to generate metallic Mo
| 4 |
| 5 |
| 6 |
| 7 |
Figure 1.
TG curves of reducing high-purity MoO3 with CO–15 vol % CO2 mixed gases under different heating rates (5, 10, 15, and 20 K/min).
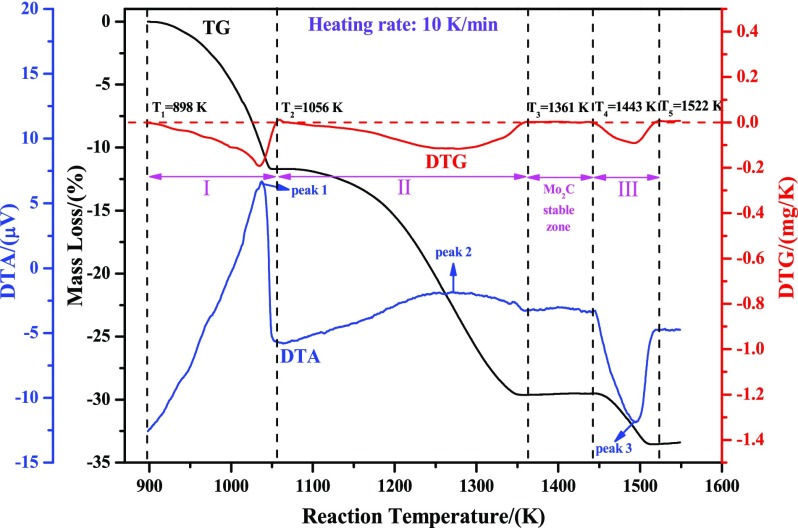
The nonisothermal thermogravimetric-differential thermal analysis (TG-DTA) curves at the heating rate of 10 K/min are also plotted and shown in Figure 2, which may contribute to the deeper understanding of the reaction processes. From the DTA curve (denoted by the blue line), it can be known that reduction from MoO3 to MoO2 is an intense exothermic reaction, as seen by the sharp exothermic peak 1. Besides, the exothermic reaction from MoO2 to Mo2C can also be obtained, as seen by the broad exothermic peak 2. As to the third stage (from Mo2C to metallic Mo), a sharp endothermic peak 3 is obviously observed, which suggests that the process from Mo2C to Mo is an endothermic reaction. Furthermore, from the DTG curve (denoted by the red line), the beginning (defined as T1) and ending reaction temperatures (defined as T2) from MoO3 to MoO2 can be obtained, i.e., T1 = 898 K, T2 = 1056 K (at the points for the values of DTG equal to zero). Accordingly, the ending reaction temperature from MoO2 to Mo2C (defined as T3) and the beginning and ending reaction temperatures from Mo2C to Mo (defined as T4 and T5, respectively) can also be known, i.e., T3 = 1361 K, T4 = 1443 K, and T5 = 1522 K. Similarly, the corresponding values for the heating rates of 5, 15, and 20 K/min can also be obtained, as listed in Table 1.
Figure 2.
Nonisothermal TG-DTA curves of reducing high-purity MoO3 with CO–15 vol % CO2 mixed gases at the heating rate of 10 K/min.
Table 1. Beginning and Ending Reaction Temperatures for Each Stage during the Total Reduction Processes in the Temperature Range of Room Temperature to 1550 K at Different Heating Rates.
| temperature
(K) |
|||||
|---|---|---|---|---|---|
| heating rate (K/min) | T1 | T2 | T3 | T4 | T5 |
| 5 | 888 | 1019 | 1283 | 1443 | 1507 |
| 10 | 898 | 1056 | 1361 | 1443 | 1522 |
| 15 | 904 | 1079 | 1425 | 1445 | 1528 |
| 20 | 907 | 1085 | 1502 | ||
From Table 1, it can be known that T1, T2, and T3 all increased with increasing heating rate. The larger the heating rate is, the higher the beginning and ending reaction temperatures will be. T1 is in the range of 888–907 K, which is larger than that of reducing industrial-grade MoO3 with pure CO as the reducing gas (827 K).12 The reasons for the increased temperature are due to the different raw materials and different reducing gases (CO–15 vol % CO2 mixed gases vs pure CO). However, it can be clearly seen that the T4 values are almost equal to each other for the heating rates of 5, 10, and 15 K/min, at a temperature of about 1443 K. From Figures 1 and 2, it can be found that a stable zone for Mo2C (the result of X-ray diffraction (XRD) pattern is not given) always existed in those cases, which may provide enough time for the heat transport. Once the reaction temperature achieves, Mo2C will begin to proceed the next reaction. As to T5, it is also increased with the increasing heating rate from 5 to 15 K/min. Due to the fact that T3 is increased with the increasing heating rate, however, T4 was almost constant (about 1443 K in the current paper). So, when the heating rate was further increased to 20 K/min, T3 will be further increased and even almost equaled T4, and then the two stages (from MoO2 to Mo2C, and then to metallic Mo) will be overlapped to approximate one stage, which would lead to T5 a little lower than those obtained at lower heating rates and the different kinetic curves, as shown in Figure 1.
2.1.2. Isothermal TG Experiments
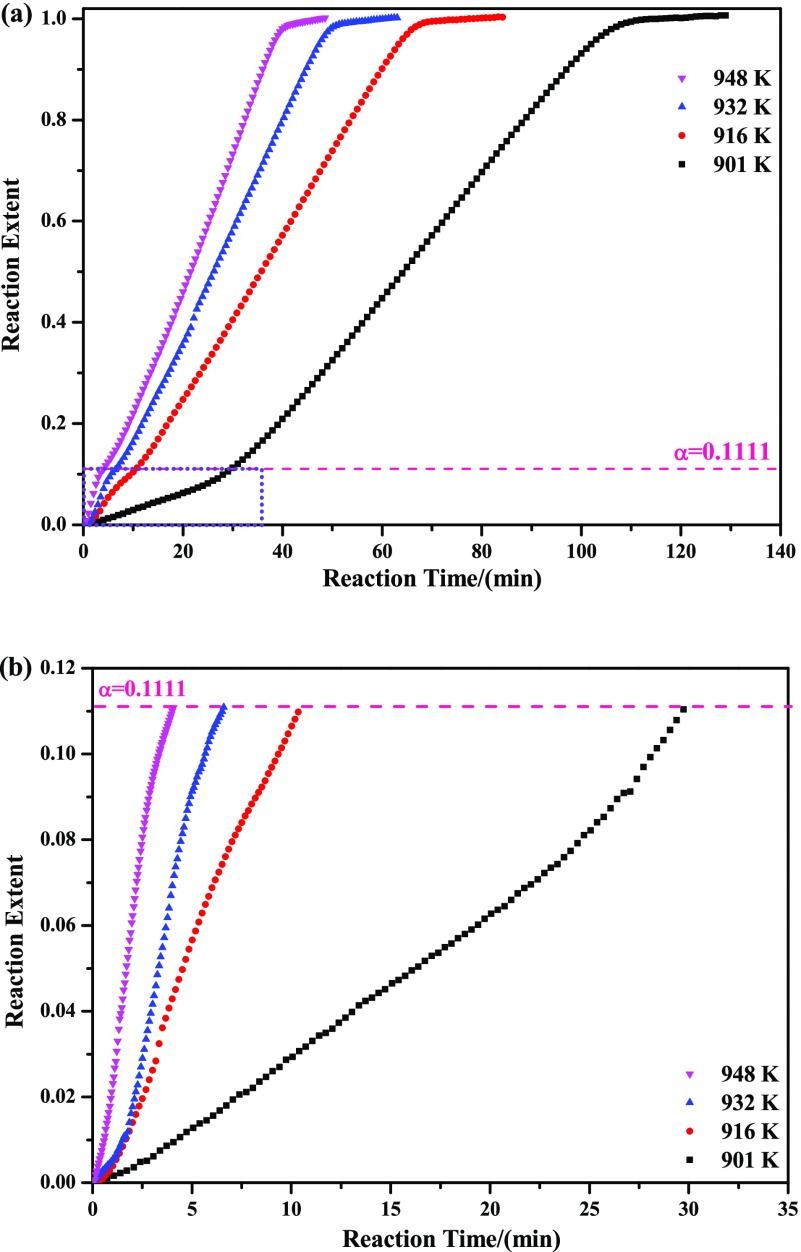
One of the purposes of the current study was to provide a new route for the preparation of high-purity MoO2. So, temperatures in the range of T1 to T2 shown in Table 1 were selected for the isothermal experiments. In this paper, temperatures of 901, 916, 932, and 948 K were adopted, and the corresponding experimental results are displayed in Figure 3 (the mass loss ratio curves have converted to the relationship between reaction extent and reaction time for convenience of the following kinetics analysis). It can be easily seen from this figure that the reaction extent depends strongly on the reaction temperature. The higher the reaction temperature is, the faster the reaction rate will be. Also, an obvious inflection point can be seen in the kinetic curves at the reaction extent of about 0.1111, which is in good agreement with the mass change from MoO3 to Mo9O26, as expressed by eq 8. The generation of Mo9O26 can be further proved in the following XRD sections. Meanwhile, the reaction extent has an obvious linear relationship with reaction temperature, which can also be seen both in the stages from 0 to 0.1111 and 0.1111 to 1. The slopes in the stage from 0 to 0.1111 are more sensitive than those in the stage from 0.1111 to 1 (temperature is more beneficial for the increase of reaction rate in the stage from 0 to 0.1111 than that from 0.1111 to 1).
| 8 |
Figure 3.
Isothermal TG curves of reducing high-purity MoO3 with CO–15 vol % CO2 mixed gases at 901, 916, 932, and 948 K (b) is the amplified image of the purple rectangles marked in (a).
2.2. XRD Analyses
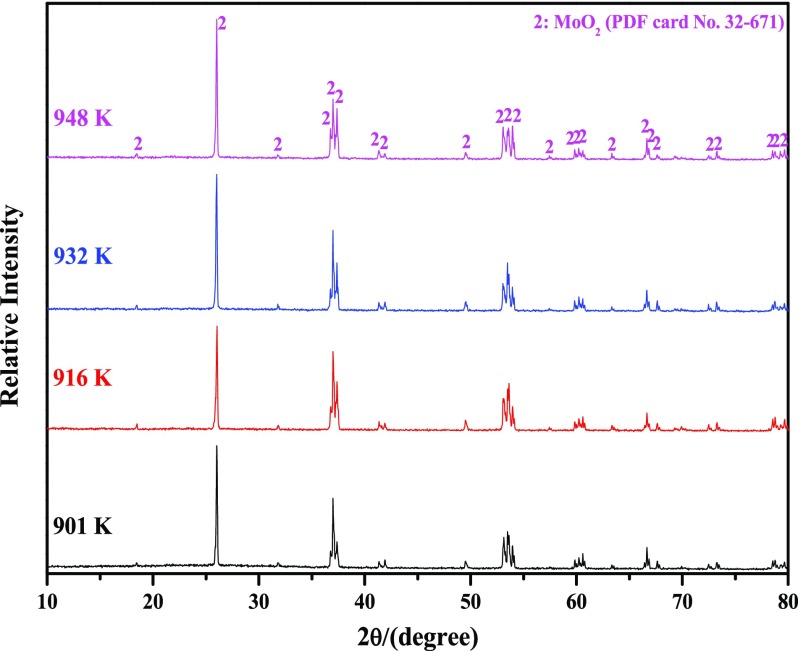
Figure 4 shows the XRD patterns of reaction products obtained by reducing high-purity MoO3 completely with CO–15 vol % CO2 mixed gases at the four different temperatures. The results showed that MoO2 (PDF card No. 32-671) is always the only final product without other impurities, which is in good agreement with the kinetic curves shown in Figure 3a.
Figure 4.
XRD patterns of reaction products obtained by reducing high-purity MoO3 completely with CO–15 vol % CO2 mixed gases at 901, 916, 932, and 948 K.
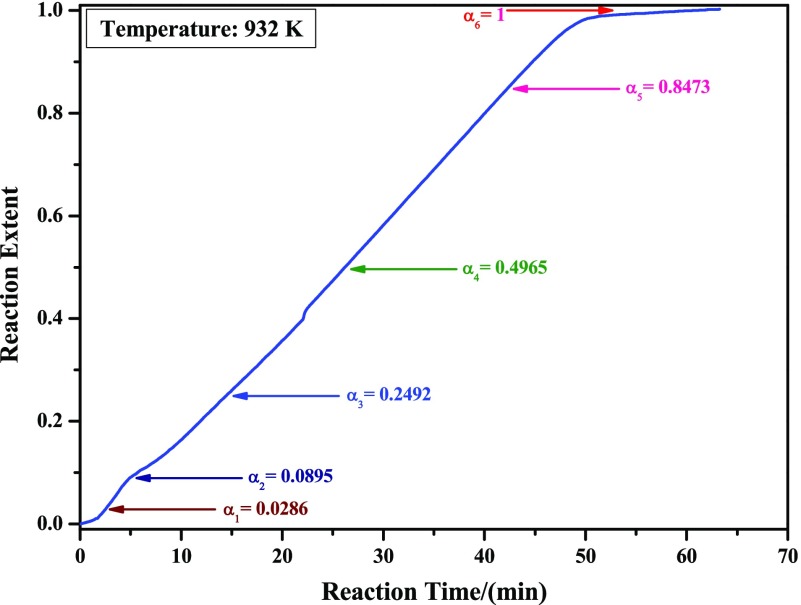
To clarify the phase-transition laws during the reaction processes, XRD patterns of samples obtained at different reaction extents were also detected. In this paper, 932 K is selected as the studied temperature, and α = 0.0286, 0.0895, 0.2492, 0.4965, 0.8473, and 1 were chosen as the analyzed reaction extents, as indicated in Figure 5.
Figure 5.
Isothermal TG curve of reducing high-purity MoO3 with CO–15 vol % CO2 mixed gases at 932 K. The directions indicated by the arrows are the as-prepared samples for the following XRD and field emission scanning electron microscopy (FE-SEM) analyses.
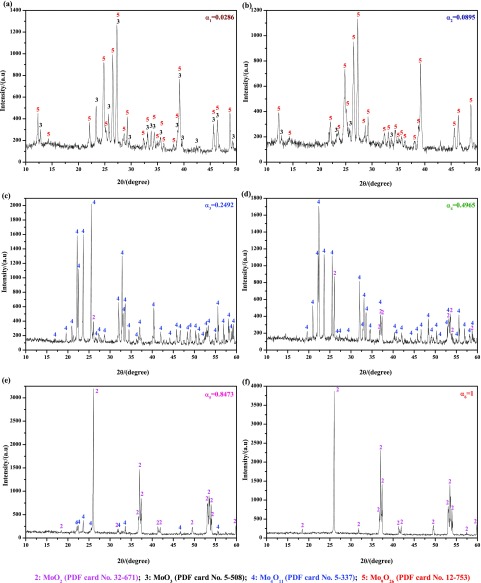
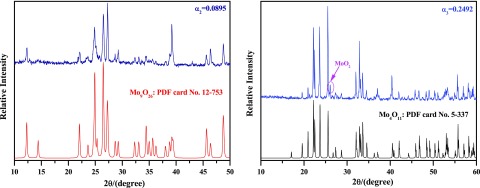
Figure 6 shows the XRD results of reaction products obtained according to Figure 5. When the reaction extent is α1 = 0.0286, most of the MoO3 raw materials are reduced to Mo9O26 (PDF card No. 12-753), which is a new intermediate product and not found in pure H2 or CO reduction of MoO3 to MoO2.7,12 As the reduction continues (α2 = 0.0895), MoO3 nearly disappeared, and then the main product turns to be Mo9O26, as shown in Figure 6b, which can be seen clearer in Figure 7. Combining Figure 6a,b, it can be deduced that the main reaction is reducing MoO3 to Mo9O26 in the preliminary stage (α in the range of 0–0.0895), which agrees well with the results (α in the range of 0–0.1111) shown in Figure 3. When the reaction extent achieves 0.2492, however, both MoO3 and Mo9O26 suddenly disappeared and then the products are replaced by Mo4O11 (PDF card No. 5-337); the formation of Mo4O11 was also found in refs (7, 12) where pure H2 or CO were used as the reducing gases. Besides, a small peak for MoO2 is also detected, which indicates that MoO2 is also formed in this situation, as shown in Figures 6c and 7. After that, the main peaks of Mo4O11 and MoO2 are monotonously decreased and increased, respectively, as shown in Figure 6d,e. When the reduction reaction is complete (α6 = 1), the products are all composed of MoO2, as shown in Figure 6f. Therefore, it can be inferred that reduction from Mo9O26 to Mo4O11 is very rapid and could hardly be controlled. Thus, the main reaction in the latter period (α in the range of 0.1111–1) is the reduction of Mo4O11 to MoO2.
Figure 6.
XRD patterns of reaction products obtained by reducing high-purity MoO3 with CO–15 vol % CO2 mixed gases at 932 K for different reaction extents (defined as the ratio of mass loss ratio of sample at time t to the theoretical maximum mass loss ratio from MoO3 to MoO2). (a) α1 = 0.0286; (b) α2 = 0.0895; (c) α3 = 0.2492; (d) α4 = 0.4965; (e) α5 = 0.8473; (f) α6 = 1. (α represents the reaction extent, α = 1 means reacting completely).
Figure 7.
XRD patterns of reaction products obtained by reducing high-purity MoO3 with CO–15 vol % CO2 mixed gases at 932 K at the reaction extents of 0.0895 and 0.2492. Standard PDF card Nos 12-753 and 5-337 were also given as the references.
2.3. FE-SEM Examinations
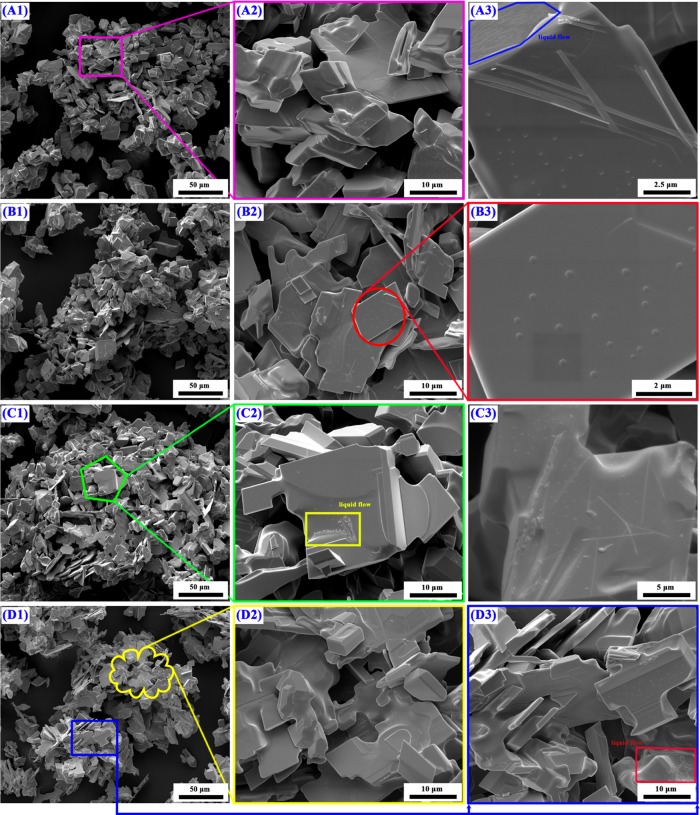
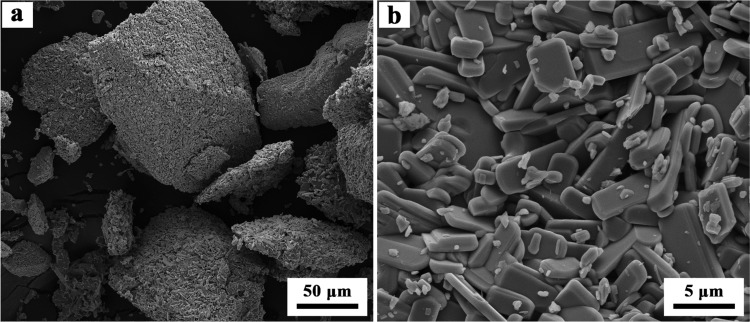
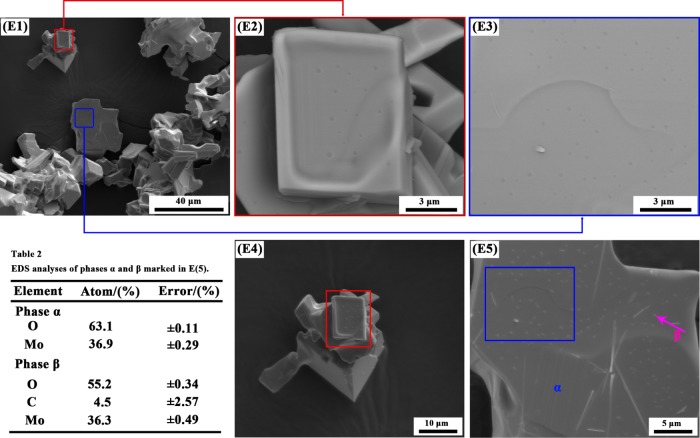
The typical micrographs of reaction products obtained by reducing high-purity MoO3 completely with CO–15 vol % CO2 mixed gases for different temperatures at various magnifications are shown in Figure 8. At 916 K, the gross particle size and micrograph of the as-prepared MoO2 keep the same as the MoO3 raw material, compared Figure 8A1–A3 with Figure 19. Also, several small particles or nuclei are formed on the smooth platelet-shaped surface. From the blue sections shown on the top left corner in Figure 8A3, some water-waves streaks could be easily seen. As the temperature increases, the gross characteristic of the as-prepared MoO2 is typically maintained and the smooth surface is still embedded with many small nuclei, as shown in Figure 8B1–B3. The images obtained at higher temperatures (932 and 948 K) are almost the same as those obtained at lower temperatures (901 and 916 K), all of which included both smooth surface and small nuclei as well as the water-waves streaks. To identify the possible phase compositions for the small nuclei, the backscattering technology is adopted and the experimental results are shown in Figure 9. It can be seen that the colors for the smooth surface and small nuclei have some differences, suggesting that the main element distributions are different, which can be further verified by the energy dispersive X-ray spectroscopy (EDS) results shown in Table 2 (illustrated in Figure 9). The smooth surface and small nuclei can be identified to be MoO2 and MoOxCy, respectively. All in all, the morphologies obtained in the current work have no obvious relationship with the reaction temperature in the temperature range of 901–948 K.
Figure 8.
FE-SEM images of reaction products obtained by reducing high-purity MoO3 completely with CO–15 vol % CO2 mixed gases at different reaction temperatures: (A1), (A2), and (A3) 901 K; (B1), (B2), and (B3) 916 K; (C1), (C2), and (C3) 932 K; and (D1), (D2), and (D3) 948 K. (1, 2, and 3 represent different magnification times).
Figure 19.
Images of the studied MoO3 powder amplified (a) 1000 times and (b) 10 000 times.
Figure 9.
Images and EDS results of reaction products obtained by reducing high-purity MoO3 completely with CO–15 vol % CO2 mixed gases at 932 K. (E1), (E4), and (E5) SEM images; (E2) and (E3) backscattering micrographs.
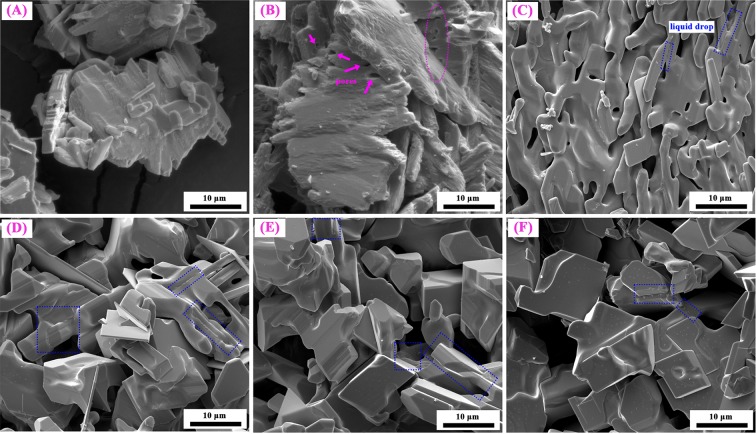
Figure 10 shows the FE-SEM images of reaction products obtained by reducing high-purity MoO3 with CO–15 vol % CO2 mixed gases at 932 K for different reaction extents (defined as the ratio of mass loss ratio of sample at time t to the theoretical maximum mass loss ratio from MoO3 to MoO2). When the reaction extent is α1 = 0.0286, the products almost kept the same smooth surface as the MoO3 raw material (as seen in Figure 19) and no obvious nuclei is found (as seen in Figure 10A). When the reaction extent arrives at α2 = 0.0895 (the products are almost Mo9O26 as shown in Figures 6 and 7), many big pores are formed on the smooth surface, which may result from the tensile stress generated due to the volume decreased during the oxygen removal. As the reaction proceeds forward (α3 = 0.2492, products included Mo4O11 with few MoO2, as shown in Figures 6 and 7), small nuclei begin to form; in the meantime, liquid drops between two platelet-shaped particles can also be observed, as shown in Figure 10C. When the reaction extent reaches α4 = 0.4965, the amount of small nuclei and liquid drops increased even if most of the products still have a smooth surface, as shown in Figure 10D. The tendency for the increase of small nuclei is maintained when the reaction continues, as shown in Figure 10E. After the reaction completes, a larger number of small nuclei can be obviously seen on the smooth platelet-shaped surface, as displayed in Figure 10F. Furthermore, cracks or pores formed in Figure 10B nearly disappeared, which may be filled with the newly as-formed liquid drops.
Figure 10.
FE-SEM images of reaction products obtained by reducing high-purity MoO3 with CO–15 vol % CO2 mixed gases at 932 K for different reaction extents (defined as the ratio of mass loss ratio of sample at time t to the theoretical maximum mass loss ratio from MoO3 to MoO2). (A) α1 = 0.0286; (B) α2 = 0.0895; (C) α3 = 0.2492; (D) α4 = 0.4965; (E) α5 = 0.8473; (F) α6 = 1. (α represents the reaction extent, α = 1 means reacting completely).
3. Discussion
3.1. Reduction Mechanism
As can be known from Figures 1 and 2, reduction of MoO3 with CO–15 vol % CO2 mixed gases in the range of room temperature to 1550 K can be mainly divided into three stages: the first is reducing MoO3 into MoO2 (MoO3 → MoO2, T1 < T < T2), followed by carburizing MoO2 into Mo2C (MoO2 → Mo2C, T2 < T < T3), and the last stage is to generate metallic Mo (Mo2C → Mo, T4< T < T5). Herein, T1, T2, T3, T4, and T5 are the experimental values which vary with heating rates, as shown in Table 1. That is to say, lower temperature is beneficial for the formation of MoO2, higher temperature for Mo, and temperatures between them contribute to the formation of Mo–C compounds. The current results can be further proved by the phase diagram of CO–MoO3 at 1 atm total pressure, as shown in Figure 11, which is calculated by the thermodynamic software FactSage 7.0 (ThermFact Ltd., Montreal, Canada).23 One of the difference is that the critical transformation temperatures from MoO2 to Mo2C and Mo2C to Mo of the experimental data shown in Table 1 are larger than those of the theoretical values shown in Figure 11 (1019 vs 907 K, and 1443 vs 1343 K, respectively). Those deviations resulted from the dynamic condition and the nonequilibrium behavior of the present experimental procedures.
Figure 11.
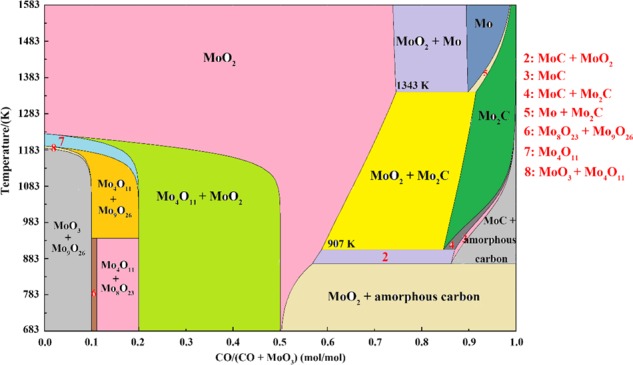
Stable gaseous and solid reaction products after equilibration of different molar ratios of CO and (CO + MoO3) at 1 atm total pressure.
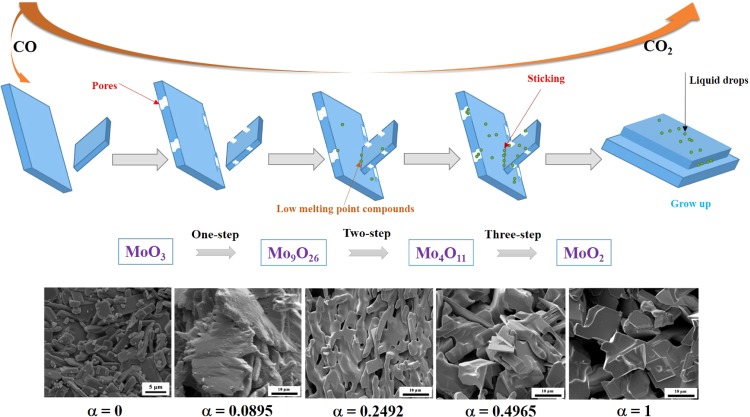
As to the first stage (MoO3 → MoO2) mentioned above, some new and interesting phenomena are found by deeper investigation. From the XRD analyses (Figures 6 and 7), it is found that this stage can be further divided into three minor steps, i.e., MoO3 is first reduced to Mo9O26 (MoO3 → Mo9O26, as shown in eq 8), then to Mo4O11 (Mo9O26 → Mo4O11, as shown in eq 9), and finally to MoO2 (Mo4O11 → MoO2, as shown in eq 10). For expression convenience, those three minor steps are defined as one-step, two-step, and three-step reactions, respectively. The formations of Mo9O26 and Mo4O11 can also be supported by Figure 11, from which it can be known that Mo9O26 and Mo4O11 as the intermediate products are indeed formed during the reduction process. However, other suboxide, such as Mo8O23, is not detected in Figures 6 and 7, which may be due to its small amount. Herein, according to our previous work,12,18 Mo4O11 is the only intermediate product produced in the reduction process of MoO3 with pure CO gas. However, both Mo9O26 and Mo4O11 are detected in this work, even nearly pure Mo9O26 and Mo4O11 are obtained when the reaction extents are 0.0895 and 0.2492, respectively. The possible reasons may be explained as follows: when pure CO is used, reaction ratios for eqs 8–10 are all very fast but differ from each other; the newly as-formed Mo9O26 could rapidly be reduced to Mo4O11; in other words, the reaction ratios for eq 9 are much faster than those for eq 8, which would make Mo9O26 exhausted and hardly accumulated, and then Mo9O26 could not be detected in the XRD patterns, showing that MoO3 was reduced to Mo4O11 directly, as shown in eq 11. However, when CO–15 vol % CO2 mixed gases (low CO partial pressure) is used, the reaction ratios for eqs 8–10 are all decreased. The lower the CO partial pressure is, the lower the reaction ratio will be. Also, it may be deduced that, in this case, the reaction ratio for eq 8 is much faster than that for eq 9, instead. And then, eq 9 can be even ignored at this initial period (α in the range of 0–0.1111). After MoO3 is reduced to Mo9O26 completely, eq 9 begins. Thereafter, the reaction ratio for eq 9 is also very faster than that for eq 10; at this moment, eq 10 can also be ignored. Similarly, after Mo9O26 is reduced to Mo4O11 completely, eq 10 begins. According to the analysis, it can be concluded that eqs 8–10 are independent of each other. Only when the last reaction finishes, the next starts. Combining the current experimental results and refs (12, 18), it can also be deduced that low CO partial pressure is beneficial for the formation of Mo9O26, while high CO partial pressure, for Mo4O11 and MoO2. Therefore, the current paper would also provide an important guide role for the preparation of pure Mo9O26 and Mo4O11. The corresponding reaction sequences are summarized in Figure 12.
| 9 |
| 10 |
| 11 |
Figure 12.

Schematic illustrating the reaction pathways of MoO3 with pure CO and CO–15 vol % CO2 mixed gases.
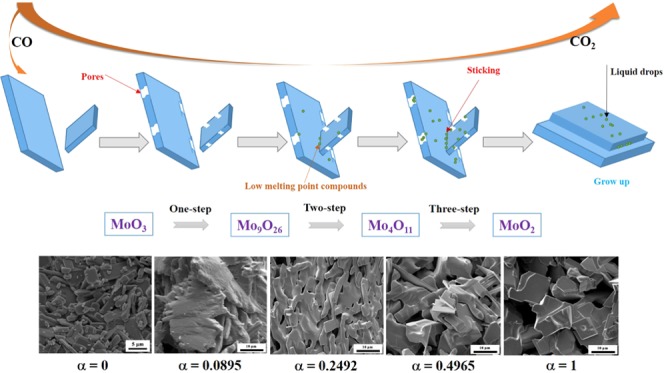
On the other hand, it can be found that particles size of the as-prepared MoO2 are much larger than that of used MoO3 raw materials, as comparing Figures 8 and 10 with Figure 19. Also, numerous small nuclei are generated on the surface. These phenomena can be explained as follows: when CO–15 vol % CO2 mixed gases are used, the reduction of MoO3 to Mo9O26 begins first, and the diffusion of reducing gas CO and release of product gas CO2 will lead to the formation of pores or cracks on the surface, as shown in Figure 10B. After MoO3 is reduced to Mo9O26 completely, the reduction of Mo9O26 to Mo4O11 starts. At this time, CO2 is still produced and released, and pores still existed. Besides, several small nuclei will be generated due to the formation of eutectic between Mo4O11 and other Mo–C compounds (see Table 2 and illustrated in Figure 9), which has a much lower melting point (about 683 K), as can be supported by Figure 11. The formation of MoOxCy is also reported in other refs (24−26), in which hydrocarbon compounds were used as the reducing gases. Recently, the generation of MoOxNy during the NH3 reduction of the Mo–O compound has also been reported,27 and the nuclei of MoOxNy was also very small and the morphology resembled liquid flow, which is very similar to the current experimental results. Thus, the hypothesis for the formation of the MoOxCy compound is reasonable in the present paper. As the reaction proceeds forward, the amount of eutectic will also be increased. Meantime, the reduction of MoO3 to MoO2 by CO–15 vol % CO2 mixed gases is an exothermic reaction (see Figure 2), which will release amounts of heat and increase the local temperature, further contributing to the melting of the lower-melting-point eutectic and resulting in the sticking of different particles. The small liquid drops, in most of the time, will flow into the pores formed in the earlier stage. Therefore, nonporous and much larger MoO2 powder will be formed finally. The corresponding reaction mechanism can be briefly described in Figure 13.
Figure 13.
Proposed possible reaction mechanism diagram for the reduction process of MoO3 to MoO2 by the CO–15 vol % CO2 mixed gases.
3.2. Kinetic Analyses
From the results of Figure 3, it is found that the total reduction of MoO3 to MoO2 by the CO–15 vol % CO2 mixed gases can be roughly divided into two obvious parts according to the reaction extent, i.e., from 0 to 0.1111 and 0.1111 to 1. According to the XRD results shown in Figures 6 and 7, however, it can be divided into three minor steps: (1) from MoO3 to Mo9O26, (2) from Mo9O26 to Mo4O11, and (3) from Mo4O11 to MoO2. From the kinetic curve results, it can be known that the last two stages (2 and 3) have no obvious demarcation point, so the kinetic analyses are conducted based on the reaction extent. Herein, the model fitting method is used, and the rate expressions of different gas–solid reaction models are listed in refs (28−30).
3.2.1. From 0 to 0.1111
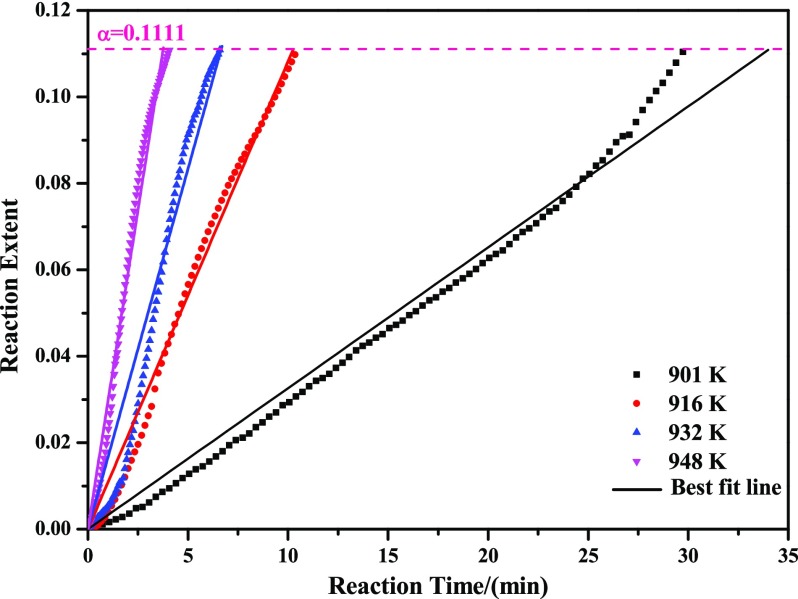
As can be seen from Figure 10B, numerous pores and cracks are generated on the surface of products, which are beneficial for the diffusion of gases, so diffusion of gases could not be the rate-controlling step. In addition, the nucleation and growth process may also not be the rate-controlling step because of the nearly linear kinetics curves. Therefore, the chemical reaction between the interfaces of MoO3 and Mo9O26 should be considered. By attempting different models, it is found that the chemical reaction model, as described by eq 12, can best fit the experimental data, and the corresponding calculated results are shown in Figure 14. The slope of each straight line determined the reaction rate constant, k (a function of temperature, as described by the Arrhenius equation (see eq 13), where A is the preexponential factor (min–1), ΔE is the activation energy (J/mol), R is the gas constant (8.314 J/(mol K)), and T is the absolute temperature (K)), which increased with the increase of reaction temperature
| 12 |
| 13 |
Figure 14.
Plot of reaction extent α vs reaction time t (α in the range of 0–0.1111).
According to eq 13, one can easily obtain
| 14 |
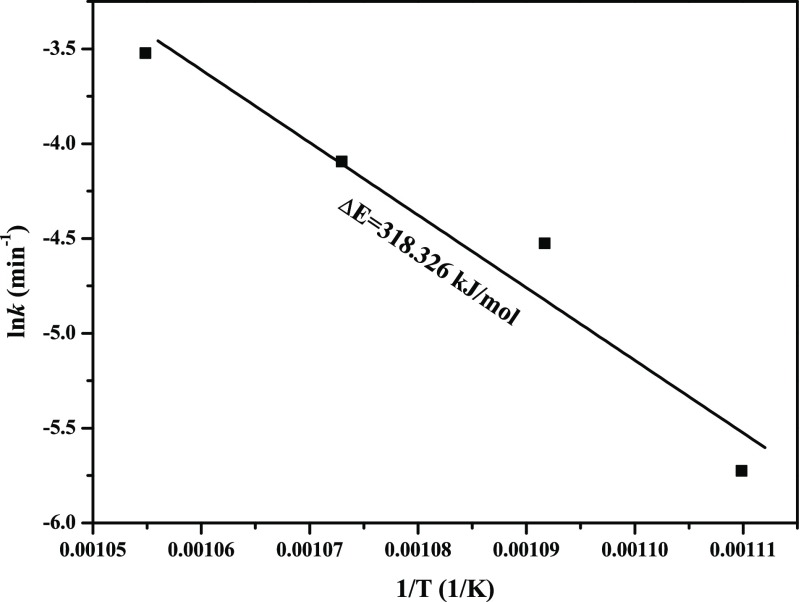
Substituting different rate constants k obtained from Figure 14 into eq 14, the corresponding results can be obtained, as shown in Figure 15. From Figure 5 it can be observed that the experimental data agree well with the Arrhenius equation, which further suggests that reduction from MoO3 to Mo9O26 obeys the chemical reaction model in the temperature range of 901–948 K. Moreover, an activation energy of 318.326 kJ/mol is extracted, and then the reaction extent α can be expressed by eq 15
| 15 |
Figure 15.
Arrhenius plot for the reduction of MoO3 to Mo9O26.
3.2.2. From 0.1111 to 1
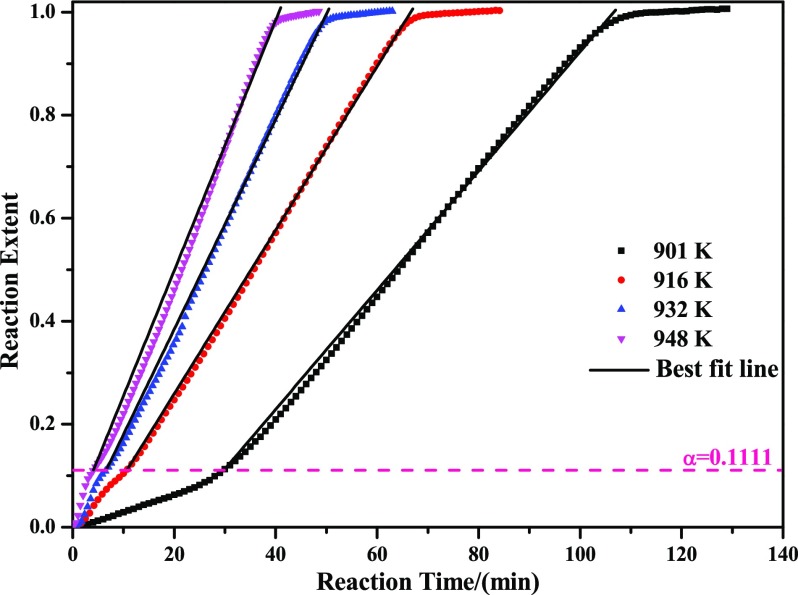
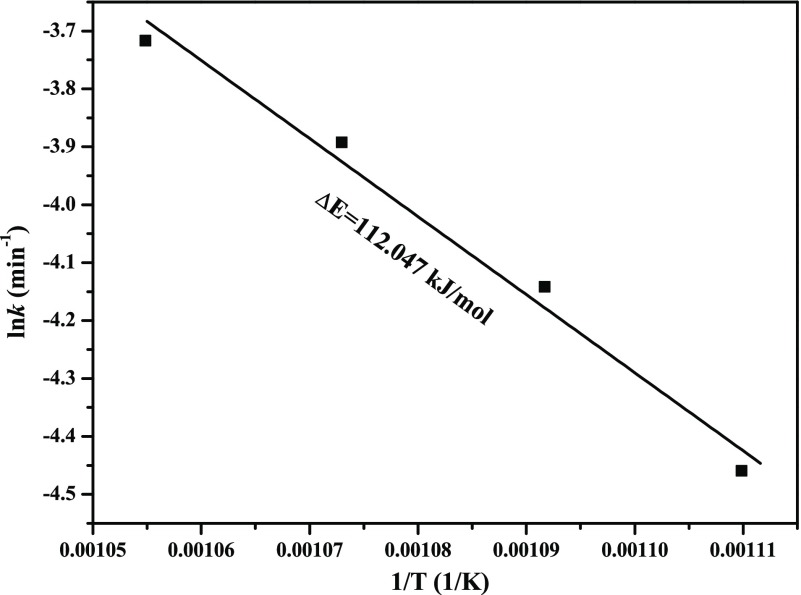
From Figure 10C, it can be found that pores still existed in this period of time. As reaction proceeds, pores gradually disappeared. Thereafter, many small liquid drops are formed on the surface, which will hinder the diffusion of gases seriously. However, according to the linear kinetics curves shown in Figure 3, it may be deduced that chemical reaction is still the dominating rate-controlling step (diffusion may also work in the very latter period). Similarly, it is found that eq 12 can also best fit the experimental data at the reaction extent between 0.1111 and 1 (from Mo9O26 to MoO2; herein, the last two steps are analyzed together due to the well linear kinetic curves and no obvious demarcation point appears), as shown in Figure 16. In the meantime, substituting different slopes obtained from Figure 16 into eq 14, the corresponding Arrhenius plot can also be calculated, as displayed in Figure 17, from which activation energy of 112.047 kJ/mol is easily extracted. Therefore, the algebraic expression of the reaction extent α in the range of 0.1111–1 can be obtained as shown in eq 16
| 16 |
where t0 is the time related to the reaction extent of 0.1111 at a desired temperature.
Figure 16.
Plot of reaction extent α vs reaction time t (α in the range of 0.1111–1).
Figure 17.
Arrhenius plot for the reduction of Mo9O26 to MoO2.
The activation energies extracted for the reduction reaction from MoO3 to Mo9O26 is much larger than that from Mo9O26 to MoO2 (318.326 vs 112.047 kJ/mol), from which it may be mistaken for a lower reaction rate in the former. However, from the kinetics curve (see Figure 3), it can be found that the reaction rate in the range of 0–0.1111 is also very fast, especially at higher temperatures. In this case, it can also be observed that the preexponential factors obtained in the range of 0–0.1111 is much larger than that obtained in the range of 0.1111–1 (1.14 × 10¹⁶ vs 3.75 × 10⁴), which indicates that the collision frequency in the primary period is more intense and then improves the reaction rate in turn, which is in good agreement with the kinetic compensation effect.31
4. Conclusions
In this work, reduction of high-purity MoO3 with CO–15 vol % CO2 mixed gases is investigated by the nonisothermal and isothermal thermogravimetric experiments. The following conclusions can be drawn:
-
1.
Temperature has a significant influence on the product composition: when the temperature is low, the main product is MoO2; on increasing the reaction temperature, the main product will turn to be Mo2C; on further increasing the temperature (T > T4 = 1443 K), metallic Mo will be generated.
-
2.
Reduction of MoO3 to MoO2 by the CO–15 vol % CO2 mixed gases is proceeded following a three-step reaction processes with the formation of intermediate products of Mo9O26 and Mo4O11. The reaction sequences of MoO3 → Mo9O26 → Mo4O11 → MoO2 are proposed.
-
3.
The final products always keep the same platelet shape and smooth morphology as the MoO3 raw material. However, the particle size of products will be increased due to the formation of lower-melting-point eutectic and the sticking of particles.
-
4.
The rate-controlling step for the reduction of MoO3 to Mo9O26 and Mo9O26 to MoO2 (mainly from Mo4O11 to MoO2) is both interfacial chemical reactions. The extracted activation energies are 318.326 and 112.047 kJ/mol, respectively.
5. Materials and Experimental Procedures
5.1. Materials
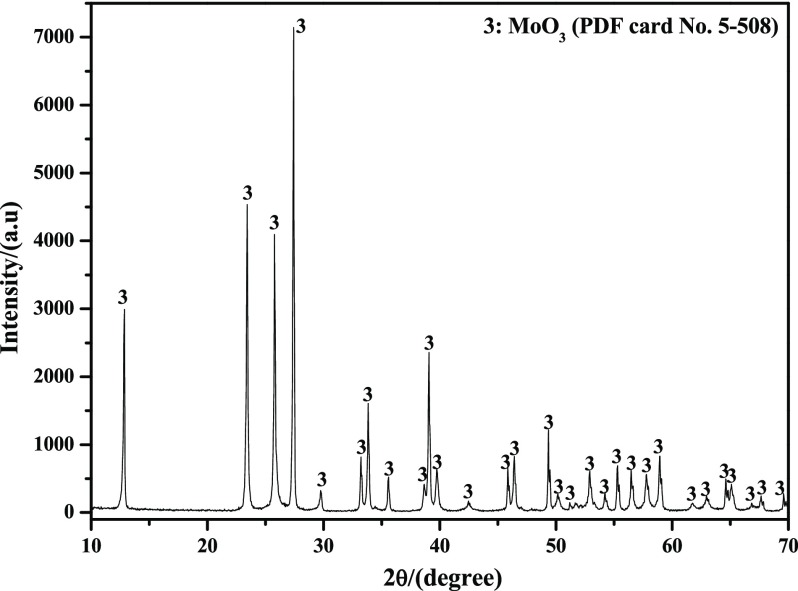
High-purity MoO3 purchased from Jinduicheng Molybdenum Co., Ltd., Xi′an, China, was used for the experiments. Figure 18 shows the X-ray diffraction patterns of the studied raw material. As can be easily seen, the material has a very high purity without any impurities. The studied MoO3 powder belongs to the thermodynamically stable orthorhombic phase, α-MoO3, which can also be deduced according to the information of PDF card No. 5-508. The images of the raw materials are presented in Figure 19, from which it can be known that the powders are composed of many platelet-shaped particles with some small ones attached on the smooth surface. In addition, most of the small particles are agglomerated together with each other to form a big block.
Figure 18.
XRD pattern of studied MoO3 powder.
5.2. Experimental Procedures
To monitor the weight loss continuously during the reduction process, a thermal analysis system (HTC-3, Beijing Hengjiu Instrument Ltd., Beijing), which includes a thermogravimetry (TG) microbalance with a precision of ±0.1 μg, was used. The corresponding schematic diagram of the experimental apparatus is shown in the literature.18 To establish the potential isothermal experimental temperatures, a series of nonisothermal thermogravimetry differential thermal analysis (TG-DTA) experiments were carried out first. During the nonisothermal experimental processes, about 40 mg of MoO3 powder was loaded into an alumina crucible (ϕ7 mm × 2 mm) and placed into a furnace. The CO–15 vol % CO2 mixed gases were then introduced into the reaction tube to drive the air out before the furnace was heated from ambient temperature (about 298 K) to 1550 K at different heating rates (5, 10, 15, and 20 K/min). When the temperature reached 1550 K, the furnace was cooled down to room temperature again in the same gas atmosphere (CO–15 vol % CO2 mixed gases).
After establishing the potential isothermal experimental temperatures according to the nonisothermal TG-DTA curves, the isothermal experiments were conducted subsequently. In each experimental run, about 40 mg of MoO3 powder was filled into the alumina crucible and then placed in a flat temperature zone of the furnace. Due to the stability of high-purity α-MoO3 at low temperature (α-MoO3 will not evaporate or sublimate when the temperature is below 973 K),32,33 air gas was selected to be introduced into the system first. When the furnace was heated from room temperature to the desired temperatures (901, 916, 932, and 948 K) at a heating rate of 10 K/min, air gas switched to the reducing gases (CO–15 vol % CO2 mixed gases) to start the reduction reaction. After reacting for a suitable period of time or completely, the furnace was cooled down to room temperature again under the same gas atmosphere. The samples were then collected for further characterization.
In all of the experimental runs, a constant gas flow rate of 100 mL/min was maintained during the reaction process. CO–15 vol % CO2 mixed gases were synthesized by Wuhan Minghui Gas Technology. Co., Ltd., Wuhan, China. X-ray powder diffraction (XRD; D8 Advance, AXS Corporation, Bruker, Germany, Cu Kα filtered radiation, and operated at 30 kV and 20 mA at a scanning speed of 10°/min) was used to identify the phase compositions. Field emission scanning electron microscopy (FE-SEM; Nova 400 NanoSEM, FEI Corporation, and with an acceleration voltage of 15 kV) was used to observe the evolution laws of product morphologies during the reduction processes.
Acknowledgments
The authors gratefully acknowledge the financial support for this work from the National Natural Science Foundation of China (51874214), the Special Project of Central Government for Local Science and Technology Development of Hubei Province (2019ZYYD076), National Postdoctoral Program for Innovative Talents-funded project (BX20180023), and China Postdoctoral Science Foundation-funded project (2019M650424).
The authors declare no competing financial interest.
References
- Kahruman C.; Yusufoglu I.; Oktay E. Kinetics of oxidation of MoO2 to MoO3 by oxygen at elevated temperatures. Trans. Inst. Min. Metall., Sect. C 1999, 108, C8–C14. [Google Scholar]
- Utigard T. Oxidation mechanism of molybdenite concentrate. Metall. Mater. Trans. B. 2009, 40, 490–496. 10.1007/s11663-009-9245-z. [DOI] [Google Scholar]
- Lessard J. D.; Shekhter L. N.; Gribbin D. G.; McHugh L. F. Thermodynamic Analysis of Looping Sulfide Oxidation Production of MoO2 from Molybdenite for Energy Capture and Generation. JOM 2013, 65, 1566–1572. 10.1007/s11837-013-0765-2. [DOI] [Google Scholar]
- Chychko A.; Teng L.; Seetharaman S. MoO3 evaporation studies from binary systems towards choice of Mo precursors in EAF. Steel Res. Int. 2010, 81, 784–791. 10.1002/srin.201000055. [DOI] [Google Scholar]
- Wang L.; Zhang G. H.; Xue Z. L.; Song C. M. Shape-controlled Preparation of Mo Powder by Temperature-programmed Reduction of MoO3 by NH3. Chem. Lett. 2019, 48, 475–478. 10.1246/cl.190001. [DOI] [Google Scholar]
- Dang J.; Zhang G. H.; Chou K. C.; Reddy R. G.; He Y.; Sun Y. Kinetics and mechanism of hydrogen reduction of MoO3 to MoO2. Int. J. Refract. Met. Hard Mater. 2013, 41, 216–223. 10.1016/j.ijrmhm.2013.04.002. [DOI] [Google Scholar]
- Wang L.; Zhang G. H.; Chou K. C. Mechanism and kinetic study of hydrogen reduction of ultra-fine spherical MoO3 to MoO2. Int. J. Refract. Met. Hard Mater. 2016, 54, 342–350. 10.1016/j.ijrmhm.2015.09.003. [DOI] [Google Scholar]
- Blanco E.; Sohn H. Y.; Han G.; Hakobyan K. Y. The kinetics of oxidation of molybdenite concentrate by water vapor. Metall. Mater. Trans. B 2007, 38, 689–693. 10.1007/s11663-006-9001-6. [DOI] [Google Scholar]
- Hakobyan K.; Sohn H.; Hakobyan A.; Bryukvin V.; Leontiev V.; Tsibin O. The oxidation of molybdenum sulphide concentrate with water vapour Part 2–Macrokinetics and mechanism. Miner. Process. Extr. Metall. 2007, 116, 155–158. 10.1179/174328507X163968. [DOI] [Google Scholar]
- Wang L.; Bu C. Y.; Zhang G. H.; Jiang T.; Chou K. C. Preparation of MoO2 by the Solid State Reaction Between MoS2 and MoO3. JOM 2016, 68, 1031–1036. 10.1007/s11837-015-1681-4. [DOI] [Google Scholar]
- Wilkomirsky I.; Sáez E. Kinetics and mechanism of formation of MoO2 by solid state reaction between MoS2 and MoO3. Can. Metall. Q 2019, 1–10. 10.1080/00084433.2019.1653541. [DOI] [Google Scholar]
- Wang L.; Bu C. Y.; Zhang G. H.; Wang J. S.; Chou K. C. Study of the Reduction of Industrial Grade MoO3 Powders with CO or CO-CO2 Gases to Prepare MoO2. Metall. Mater. Trans. B 2017, 48, 2047–2056. 10.1007/s11663-017-0979-8. [DOI] [Google Scholar]
- Lemaître J.; Vidick B.; Delmon B. Control of the catalytic activity of tungsten carbides: I. Preparation of highly dispersed tungsten carbides. J. Catal. 1986, 99, 415–427. 10.1016/0021-9517(86)90366-0. [DOI] [Google Scholar]
- Valendar H. M.; Rezaie H.; Samim H.; Barati M.; Razavizadeh H. Reduction and carburization behavior of NiO–WO3 mixtures by carbon monoxide. Thermochim. Acta 2014, 590, 210–218. 10.1016/j.tca.2014.07.003. [DOI] [Google Scholar]
- Alonso F. N.; Morales M. Z.; Salas A. U.; Becerril J. B. Tungsten trioxide reduction-carburization with carbon monoxide-carbon dioxide mixtures: kinetics and thermodynamics. Int. J. Miner. Process. 1987, 20, 137–151. 10.1016/0301-7516(87)90022-6. [DOI] [Google Scholar]
- Wu Y.; Dang J.; Lv Z.; Zhang R. The preparation of tungsten carbides and tungsten powders by reaction of tungsten trioxide with methanol. Int. J. Refract. Met. Hard Mater. 2018, 76, 99–107. 10.1016/j.ijrmhm.2018.06.002. [DOI] [Google Scholar]
- Dang J.; Zhang G. H.; Wang L.; Chou K. C.; Pistorius P. C. Study on reduction of MoO2 powders with CO to produce Mo2C. J. Am. Ceram. Soc. 2016, 99, 819–824. 10.1111/jace.14042. [DOI] [Google Scholar]
- Wang L.; Zhang G. H.; Chou K. C. Preparation of Mo2C by reducing ultrafine spherical β-MoO3 powders with CO or CO-CO2 gases. J. Aust. Ceram. Soc. 2018, 54, 97–107. 10.1007/s41779-017-0131-x. [DOI] [Google Scholar]
- Schulmeyer W. V.; Ortner H. M. Mechanisms of the hydrogen reduction of molybdenum oxides. Int. J. Refract. Met. Hard Mater. 2002, 20, 261–269. 10.1016/S0263-4368(02)00029-X. [DOI] [Google Scholar]
- Ressler T.; Jentoft R. E.; Wienold J.; Günter M. M.; Timpe O. In situ XAS and XRD studies on the formation of Mo suboxides during reduction of MoO3. J. Phys. Chem. B 2000, 104, 6360–6370. 10.1021/jp000690t. [DOI] [Google Scholar]
- Majumdar S.; Sharma I.; Samajdar I.; Bhargava P. Kinetic studies on hydrogen reduction of MoO3 and morphological analysis of reduced Mo powder. Metall. Mater. Trans. B 2008, 39, 431–438. 10.1007/s11663-008-9152-8. [DOI] [Google Scholar]
- Lalik E. Kinetic analysis of reduction of MoO3 to MoO2. Catal. Today. 2011, 169, 85–92. 10.1016/j.cattod.2010.09.013. [DOI] [Google Scholar]
- Bale C.; Bélisle E.; Chartrand P.; Decterov S.; Eriksson G.; Hack K.; Jung I. H.; Kang Y. B.; Melançon J.; Pelton A. FactSage thermochemical software and databases—recent developments. Calphad 2009, 33, 295–311. 10.1016/j.calphad.2008.09.009. [DOI] [Google Scholar]
- Hanif A.; Xiao T.; York A. P.; Sloan J.; Green M. L. Study on the structure and formation mechanism of molybdenum carbides. Chem. Mater. 2002, 14, 1009–1015. 10.1021/cm011096e. [DOI] [Google Scholar]
- Xiao T. C.; York A. P.; Williams V. C.; Al-Megren H.; Hanif A.; Zhou X. Y.; Green M. L. Preparation of molybdenum carbides using butane and their catalytic performance. Chem. Mater. 2000, 12, 3896–3905. 10.1021/cm001157t. [DOI] [Google Scholar]
- Wang X. H.; Hao H. L.; Zhang M. H.; Li W.; Tao K. Y. Synthesis and characterization of molybdenum carbides using propane as carbon source. J. Solid State Chem. 2006, 179, 538–543. 10.1016/j.jssc.2005.11.009. [DOI] [Google Scholar]
- Wang L.; Zhang G. H.; Chou K. C. Study on reduction reaction of MoO2 powder with NH3. J. Am. Ceram. Soc. 2017, 100, 1368–1376. 10.1111/jace.14740. [DOI] [Google Scholar]
- Ebrahimi-Kahrizsangi R.; Abbasi M. H.; Saidi A. Mechanochemical effects on the molybdenite roasting kinetics. Chem. Eng. J. 2006, 121, 65–71. 10.1016/j.cej.2006.04.011. [DOI] [Google Scholar]
- Vyazovkin S.; Wight C. A. Model-free and model-fitting approaches to kinetic analysis of isothermal and nonisothermal data. Thermochim. Acta. 1999, 340, 53–68. 10.1016/S0040-6031(99)00253-1. [DOI] [Google Scholar]
- Kim B. S.; Kim E. Y.; Jeon H. S.; Lee H. I.; Lee J. C. Study on the reduction of molybdenum dioxide by hydrogen. Mater. Trans. 2008, 49, 2147–2152. 10.2320/matertrans.MER2008103. [DOI] [Google Scholar]
- Zsakó J. The kinetic compensation effect. J. Therm. Anal. Calorim. 1976, 9, 101–108. 10.1007/BF01909271. [DOI] [Google Scholar]
- Norman J.; Staley H. G. Thermodynamics of the dimerization and trimerization of gaseous tungsten trioxide and molybdenum trioxide. J. Chem. Phys. 1965, 43, 3804–3086. 10.1063/1.1696565. [DOI] [Google Scholar]
- Wang L.; Zhang G. H.; Dang J.; Chou K. C. Oxidation roasting of molybdenite concentrate. Trans. Nonferrous Met. Soc. China 2015, 25, 4167–4174. 10.1016/S1003-6326(15)64067-5. [DOI] [Google Scholar]


