Abstract
Poor initial stability at the first four weeks after surgery is becoming the major causes for metal implant failure. Previous attempts neglected the control release of insulin for the bone regeneration among nondiabetic subjects. The major reason may lie in the adverse effects, such as attenuated bone formation, hypoglycemia or hyperinsulinemia, that caused by the excessive insulin. Thus, spatiotemporal release of insulin may serve as the promising strategy. To address this, through solvent extraction (EMS), solvent evaporation (SMS) and cosolvent methods (CMS), we prepared three types of PLGA microspheres with various internal structures, but similar size distribution. The effects of the preparation methods on the properties of the microspheres, such as their release behavior, degradation of molecular weight, and structural evolution, were investigated. Human bone marrow mesenchymal stromal cells (BMSCs) and rabbit implant models were used to test the bioactivity of the microspheres in vitro and in vivo, respectively. The result demonstrated that these three preparation methods did not influence the polymer degradation but instead affected the internal structural evolution, which plays a crucial role in the release behavior, osteogenesis and peri-implant bone regeneration. Compared with EMS and CMS microspheres, SMS microspheres exhibited a relatively steady release rate in the first four weeks, which evidently stimulated the osteogenic differentiation of the stem cells and peri-implant bone regeneration. Meanwhile, SMS microspheres significantly enhanced the stability of the implant at Week 4, which is promising to reduce early failure rate of the implant without inducing adverse effects on the serum biochemical indices.
Keywords: Insulin, osseointegration, PLGA, microspheres, bone regeneration
1. Introduction
Over the past several decades, the quality of life of elderly or injured people has been improved by metal implants and these implants have various uses, such as fracture fixation and the replacement of shoulders, hips, knees, spine and teeth. Metal implants cost more than $300 billion in the United States, and their cost is increasing by 20% annually (Qian et al., 2014). However, the rates of incidence of unpleasant side effects such as delayed union or the loosening of metal implants in the early stage remain very high, and the treatments for these problems are also difficult to implement (Masuzaki et al., 2010; Goriainov et al., 2014). These problems may be attributed to poor initial stability of the implant, subsequent excessive fretting, presence of soft tissue growth in the implant-bone interface, and peri-implant bone resorption, eventually leading to an early failure of the implant (Brånemark et al., 1983; Fournier et al., 2018).
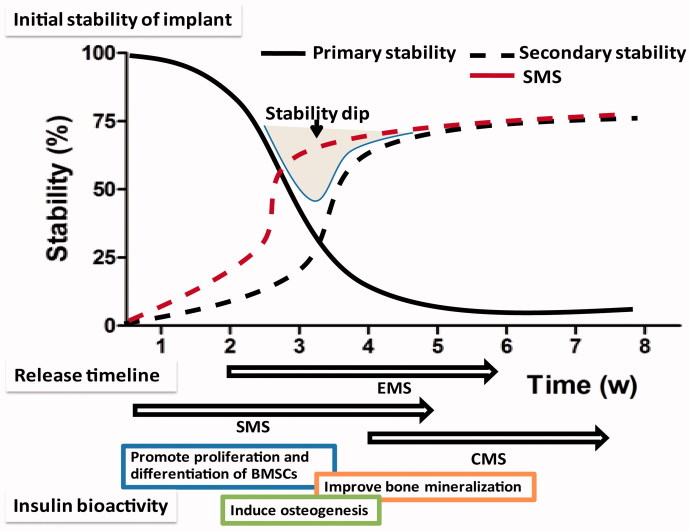
The initial stability of an implant can be divided into two parts: the primary stability, which depends on the thread friction, and the secondary stability, which depends on the peri-implant bone regeneration (Smeets et al., 2016). First, a high level of initial stability is achieved by friction. However, the primary stability is quickly decreased due to necrosis of the neighboring bone, although the regeneration of a new bone slowly leads to secondary stability. After 2–4 weeks, the implant stability is the lowest during a phase that is called the implant stability dip (Coelho et al., 2015). When the sum of the initial stability is lower than 5 N/cm, an early failure of the implant is almost inevitable (Uribe et al., 2005). Thus, an urgent need to improve the peri-implant bone regeneration exists at the early stage.
It is well-known that bone regeneration is a multistage process, and the beneficial effects of different growth factors may be limited to distinct periods (Lock et al., 2012; Malekzadeh et al., 2013). Thus, an ideal strategy involves accurate regulation of the drug release of the microspheres. Microspheres are tiny spherical entities formed by dissolving or dispersing drugs in the matrix of polymer materials, which was used for locally sustained-release growth factors. In vitro, the release profile of the microspheres is related to many factors, such as particle size, molecular weight, and preparation method. The broad size distribution that is obtained using the conventional method will result in the microspheres with poor reliability and reproducibility (Qi et al., 2013). While uniform particles may be produced in the same size, microspheres that are prepared by different methods may have different release behaviors and effects on osteogenesis in the body (Qi et al., 2014).
Recently, the roles played by insulin in bone development and physiology have attracted considerable attention (Contaldo et al., 2014). However, previous attempts neglected the control release of insulin for the peri-implant bone regeneration among nondiabetic subjects. The major reason may lie in the adverse effects, such as attenuated bone regeneration, hypoglycemia or hyperinsulinemia, that caused by the excessive insulin (Wang et al., 2011, 2013). Therefore, we hypothesized that spatiotemporal release of insulin may serve as the promising strategy to harness the cell differentiation, osteogenesis and bone regeneration in a controlled manner.
In this study, we aim to obtain more detailed information on accurate regulation of the release profile of insulin-loaded microsphere in vitro and in vivo. Herein, three types of insulin microspheres were prepared using the solvent extraction, solvent evaporation and cosolvent methods based on SPG premix membrane emulsification. Then, we investigated the effects of the preparation methods on the characteristics of the microspheres, including their structural evolution, release behavior, and molecular weight degradation. Moreover, we tested the bioactivity of different microspheres in vitro with human BMSCs. When these three types of microspheres were injected around titanium implants in rabbits, we observed the effects of these microspheres on peri-implant bone regeneration, biomechanical fixation and serum biochemistry. This study could provide more detailed information on accurate regulation of the release profile of microspheres, which is the key to optimize the beneficial effects of growth factors.
2. Materials and methods
2.1. Materials
PLGA (D, L-lactide/glycolide 75/25, Mw13 kDa) was purchased from Lakeshore Biomaterials (Birmingham, AL, USA). Shirasu porous glass (SPG) membranes were provided by SPG Technology Co. Ltd. (Miyazaki, Japan). Human recombinant insulin was provided by Wako Industries, Ltd. (Osaka, Japan). Poly vinyl alcohol-217 (PVA-217, polymerization of 1700, hydrolysis of 88.5%) was obtained from Kuraray (Tokyo, Japan). Titanium implant (length of 7 mm, diameter of 3 mm) and titanium disks (diameter of 10 mm, thickness of 1 mm) were provided by Fullerton Technology Co. Ltd. (Beijing, China).
2.2. Preparation of insulin microspheres
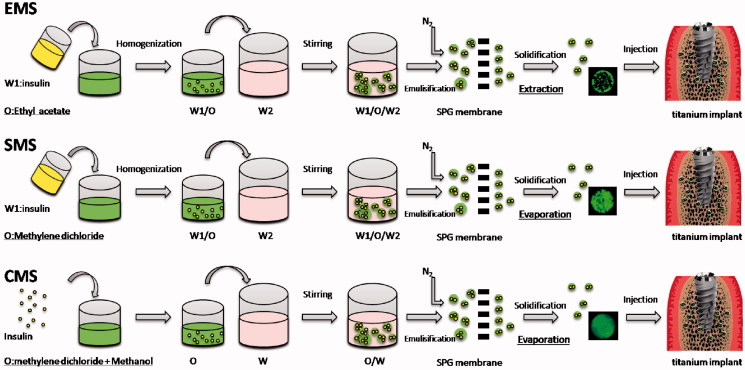
As shown in Figure 1, the PLGA microspheres were prepared by the solvent extraction, solvent evaporation and the cosolvent methods, which are abbreviated as EMS, SMS and CMS, respectively.
Figure 1.
Preparation process of EMS, SMS and CMS.
For the EMS preparation: 1 mL of insulin solution (3%, w/v, W1) was homogenized (T18, IKA, Germany) with 8 mL of ethyl acetate containing PLGA (10%, w/v) at 18,000 rpm for 60 s to form the primary emulsions (W1/O). Then, the W1/O emulsions were mixed with an external aqueous phase (W2) containing PVA (2%, w/v) and NaCl (0.5%, w/v) to form the coarse double emulsions (W1/O/W2) via stirring. Afterward, the W1/O/W2 emulsions were poured into a premix reservoir, passed through a 50.2 μm SPG membrane by N2 under 5 kPa to generate uniform-sized droplets, and were quickly poured into solidification solution (1.6 L containing NaCl (0.9%, w/v) under magnetic stirring at 250 rpm for 4 h to solidify. Finally, the microspheres were collected after being washed 5 times with distilled water via centrifugation (300 g)
For the SMS preparation: preparation of uniform-sized W1/O/W2 was same as above but using methylene dichloride instead of ethyl acetate. Then, the emulsion droplets were stirred for 12 h at room temperature to solidify, and collected using same method as above.
For the CMS preparation: insulin powder (30 mg) was dissolved in a mixed organic solvent containing methylene chloride and methanol at volume ratio of 6:2 and PLGA (10%, w/v). The other steps in the preparation procedure were the same as SMS.
2.3. Surface morphology and particle size distribution
The surface morphology was observed by a scanning electron microscope (JEOL, Tokyo, Japan). The particle sizes and size distributions of the microspheres were tested by Mastersizer laser diffraction (Malvern, UK). The size uniformity is expressed as the Span value, which was calculated as follows (Hu et al., 2012; Kazazi-Hyseni et al., 2014):
where Dv, 90%, Dv, 50% and Dv, 10% are the volume size diameters of the particles at 90%, 50% and 10% of the cumulative volume, respectively. The volume distributions are the default choice for many ensemble light scattering techniques including laser diffraction (Lai et al., 2014).
2.4. Loading efficiency and encapsulation efficiency
PLGA microspheres (5 mg) were dispersed in NaOH (0.04 M, 10 mL) and shaken at 110 rpm for 12 h. After all the microspheres were degraded, the amount of insulin that was loaded in the PLGA microspheres was measured using Mercodia insulin ELISA Kit (Uppsala, Sweden). Blank PLGA microspheres were used as the control. The insulin encapsulation efficiency (EE) and loading efficiency (LE) of the particles were calculated as follows (Qi et al., 2014):
2.5. In vitro drug release
Insulin PLGA microspheres (1 mg) were incubated in a phosphate-buffered saline (1 mL, pH 7.4) and shaken at 30 rpm under 37 °C for 60 days in an incubator. At 6 hours, 1,2,5,7 and 10 days…until 60 days (every 5 days interval), the supernatant was collected by centrifugation for 3 minutes at 300 g and replaced with fresh buffer of equal volume. The insulin concentration in the supernatant was measured using Mercodia insulin ELISA Kit (Uppsala, Sweden), and the supernatant was used in the cell culture.
To observe the drug distribution in the microspheres, insulin labeled with Super Fluor 488 SE (Fanbo Biochemicals, Beijing, China). At each time point, the insulin-loaded microspheres were observed by confocal laser scanning microscopy (Leica, Germany).
2.6. Polymer degradation
To determine the polymer degradation of the microspheres during the incubation, the samples were collected after they were centrifuged for 3 minutes at 300 g and lyophilized. At 10, 20, 30, 40, 50 and 60 days, the molecular weight (Mw) was determined by gel permeation chromatography (GPC) (UltiMate 3000, DIONEX, USA) using THF as the mobile phase.
The decrease in the Mw was calculated as follows:
where Mw0 is the initial Mw of the polymer and kd is the pseudo-first-order degradation rate constant of the polymer.
2.7. In vitro bioactivity assessment
2.7.1. Cell culture
Human BMSCs were isolated from alveolar bone marrow specimens and cultured as previously described (Wang et al., 2016). These experiments were approved by the Shanxi Medical University Stomatological Hospital Review Board. To minimize other possible impacts on the BMSCs, the exclusion criteria were as follows: periodontitis, periapical inflammation, osteoporosis or diabetes, age over 50 or less than 30. A total of 32 subjects (18 men and 16 women) were included in this study. BMSCs were cultured in a basic culture medium (αMEM with 15% fetal bovine serum) (Gibco, USA).
After the collected cells were pooled, the P4 BMSCs were seeded dropwise onto titanium disk (105 cells/cm2). All samples were divided into four groups: Blank, EMS, SMS and CMS groups. BMSCs were cultured in αMEM containing 15% FBS at 37 °C. 0.1 mL of supernatant from the EMS, SMS and CMS groups in the in vitro release study was added in the αMEM medium respectively. For example, on Day 0.5, 0.1 mL of the supernatant was added into cells. On Day 1, the cell medium was discarded, and replaced with fresh medium. Then, 0.1 mL of the collected supernatant was added. At the rest time points, same operation was done in the same manner. For the Blank group, 0.1 mL of blank release medium was added each time. The medium replacement was performed in each group (including blank group) at same time. Insulin concentration was detected using ELISA kit.
2.7.2. MTS proliferation assay
3-(4,5-dimethylthiazol-2-yl)-5-3-carboxymethoxyphenyl)-2-(4-sulfophenyl)-2H-tetrazolium (MTS, Promega, WI, USA) was used following the manufacturer’s instructions. At Days 3, 7 and 14, the samples were washed with PBS and transferred to a new 24-well polystyrene culture plate with 1 mL of culture medium in each well. Then, 200 μL of MTS (5 mg/mL, Sigma) was added, and the absorbance was tested using a microplate spectrophotometer at 490 nm (Wang et al., 2016).
2.7.3. Osteogenic differentiation
Alkaline phosphatase (ALP) and osteocalcin (OCN) activity of the BMSCs were detected using Roche Diagnostics kits (Mannheim, Germany). The culture was similar as described in Section 2.7.1, but sampled at different time points. ALP activity in medium was measured on Days 3, 7 and 14. The OCN activity was measured using N-MID Osteocalcin kits (Mannheim, Germany).
After the BMSCs were cultured for 21 days, they were washed three times with PBS, fixed and stained with Alizarin Red. The cell monolayers were washed with distilled water until no color appeared, and the images were photographed. The deposits were extracted using 10% (w/v) cetylpyridinium chloride in 10 mM sodium phosphate (pH 7.0) for 2 hours at room temperature to quantify the amount of Alizarin Red. The content of Alizarin Red was determined by its optical density (OD) (Tang et al., 2016).
2.8. In vivo experiment
2.8.1. Animals
Ninety-six male New Zealand white rabbits (6 months) with weights 2.90 ± 0.32 kg were used to establish mandible implant model. All rabbits were divided into four groups according to the different injected microspheres (Section 2.8.3). Thirty-two rabbits were used for histological analysis and Micro CT (n = 5 in Micro CT), and the other 64 rabbits were used in removal torque (RTQ) analysis (n = 4 for each time point). All operations were approved by the Shanxi Medical University Stomatological Hospital Review Board.
2.8.2. Implantation operation
Two percent pentobarbital sodium (30 mg/kg) was used to intravenously anesthesia. Then, a 10 mm incision was made along the inferior border of right mandible. Then, a titanium implant with smooth surface was implanted from buccal side to lingual side, perpendicular to bone surface using an Astra implant system (Mannheim, Germany) (Anderson et al., 2011).
2.8.3. Microspheres injection
Before implantation of titanium implants, microspheres were injected into the bone trabeculae around the implant socket. Twenty-four rabbits were injected with 10 mg of EMS microsphere (EMS group). Twenty-four rabbits were injected with the 10 mg of SMS microspheres (SMS group). Twenty-four rabbits were injected with 10 mg of CMS microspheres (CMS group). Same volume of microspheres was used in the EMS, SMS and CMS group. Twenty-four rabbits without injecting microspheres were used as the control (Blank group).
2.8.4. Serum biochemistry and bone metabolism markers
To assess the systemic influence of the insulin-loaded microspheres, a serum biochemistry assessment was performed. To ensure no significant difference between groups before surgery, the glucose concentration, the insulin concentration, OCN and TRAP level in each rabbits were measured twice before surgery. After the implant surgery, all of the rabbits had an uneventful postoperative recovery, and blood samples were collected from the central ear artery at 1, 6, 12, and 24 h, as well as on Days 3, 7, 14, 21 and 28. The blood fasting glucose and the insulin levels of the rabbits were analyzed using a Roche Diagnostics platform (Mannheim, Germany). At Weeks 2 and 4 after surgery, the serum osteocalcin (OCN) levels were measured using Osteocalcin ELISA kits (CUSABIO Biotech Co., Wuhan, China) and analyzed using a cobas 8000 platform (Roche Diagnostics). The tartrate-resistant acid phosphatase (TRAP) activity was assessed using a TRACP & ALP Assay Kit (CUSABIO Biotech Co., Wuhan, China). The measurements were performed in triplicate.
2.8.5. Micro-CT
At Week 4, the mandible blocks (1.5 × 1 × 1 cm3) were observed using a Micro CT (Caliper, USA). Ninety-six samples were scanned with a micro CT scanner. To determine the tissue volume (TV), a standard cylinder (5 mm diameter and 8 mm length) was then placed parallel to the long axis of the implant so that the threaded parts of the implant were covered. To discriminate the bone and implant, the bone thresholds were set between 1500 and 4000. The bone volume/tissue volume within this cylinder was calculated by the Micro-CT computer program and is expressed as a percentage. The bone volume per tissue volume (BV/TV), trabecular number (Tb.N), trabecular thickness (Tb.Th), and trabecular separation (Tb.Sp) values were calculated (Wang et al., 2017).
2.8.6. Histological analysis
At Week 4 after surgery, all rabbits were sacrificed and the mandible samples (32 rabbits were used in the histomorphometry; n = 8) were resected, fixed, dehydrated and embedded in methyl methacrylate. Along the long axis of the implant, tissue slices were chopped, ground to 15 micron thickness and stained with methylene blue/acid fuchsin. Ten successive sections were observed in each implant and the histological evaluation was performed using a Leica microscope (Wetzlar, Germany) (Gundersen et al., 1988). The central cross section of the implant was selected for analysis. The amount of peri-implant bone that had formed was determined in each section by the bone-to-implant contact ratio (BIC, %) (Abtahi et al., 2013). To avoid the influence of cortical bone and rabbit mandibular incisors on the analysis of bone around the implant, cancellous bone area in the edentulous side was selected for BIC analysis of implant osteogenesis.
2.8.7. Removal torque (RTQ) analysis
At Weeks 1, 2, 3 and 4 after surgery, the mandible specimens (sixty-four rabbits were used in the biomechanical testing; n = 4 for each time point and each group) containing the implants were harvested using AG-IS universal testing machine (Kyoto, Japan). The peak torque value of sampling was recorded until the implants had turned 90 degrees (Abtahi et al., 2013).
2.9. Statistical analysis
ANOVAs with Bonferroni post hoc analyses were used to determine the statistical significance and p < .05 was considered to indicate a significant difference. The data were analyzed using SPSS 19.0 software (SPSS, Chicago, IL, USA) and are expressed as the means ± standard deviation.
3. Results
3.1. Characterization of microspheres
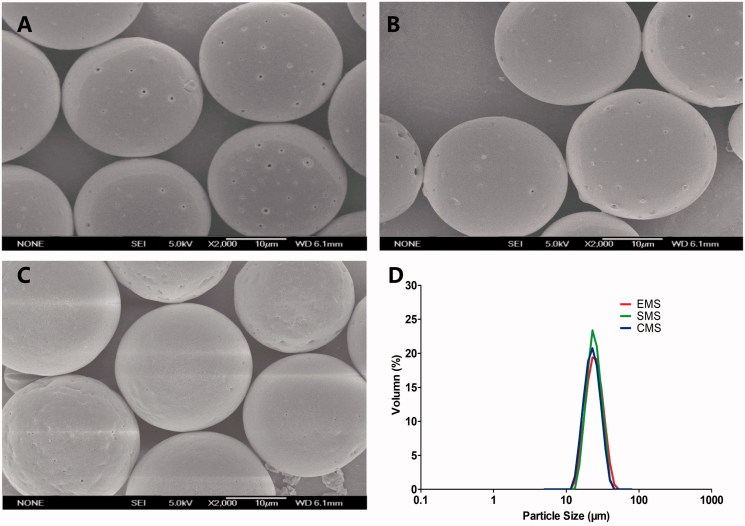
Based on the previous optimization, insulin-loaded PLGA microspheres with a narrow size distribution were successfully prepared by the solvent evaporation, solvent extraction and cosolvent methods (Abtahi et al., 2013). All of the microspheres were spherical with a smooth surface (Figure 2), and the particle sizes of the EMS, SMS and CMS microspheres were 22.91 ± 0.19 μm, 22.73 ± 0.23 μm and 22.45 ± 0.32 μm, respectively (Table 1). Additionally, the span was less than 0.7, indicating a narrow particle size distribution.
Figure 2.
SEM images of (A) EMS, (B) SMS and (C) CMS; (D) size distribution of microspheres. Scale bar: 10 μm.
Table 1.
Physical characterization of microspheres.
| Sample name | Particle diameter (μm) | Size distribution | Loading efficiency (%) | Encapsulation efficiency (%) |
|---|---|---|---|---|
| EMS | 22.91 ± 0.19 | Span = 0.593 | 3.27 ± 0.21 | 84.67 ± 4.13 |
| SMS | 22.73 ± 0.23 | Span = 0.623 | 3.40 ± 0.15 | 90.25 ± 2.13 |
| CMS | 22.45 ± 0.32 | Span = 0.676 | 3.54 ± 0.18 | 95.34 ± 4.30 |
3.2. In vitro release
Release profiles and insulin concentrations of the EMS, SMS and CMS were found to be different (Figure 3(A)). The EMS exhibited an approximate triphasic profile, with the highest initial burst (approximately 40% within 24 h) followed by a low drug release phase, and the rate of release increased in the third week. The SMS exhibited a lower initial release (approximately 19% within 24 h) and a longer release profile (over 50 days). The CMS microspheres exhibited a release behavior that was similar to that of the EMS microspheres but showed the lowest initial burst (approximately 15% within 24 h).
Figure 3.
(A) In vitro release profiles (B) Mw/Mw0 (%, Mw at each sampling time/initial Mw0) vs. time profiles of EMS, SMS and CMS (n = 3, mean ± SD). Mw/Mw0 is the change ratio of molecular weight.
3.3. Polymer degradation
As shown in Figure 3(B), the EMS, SMS and CMS microspheres exhibited a similar Mw degradation profile. The Mw of all of the polymers decreased linearly overtime, and the calculated kd values of the EMS, SMS and CMS microspheres were 0.0137, 0.0139, and 0.0142, respectively.
3.4. Interior structural evolution
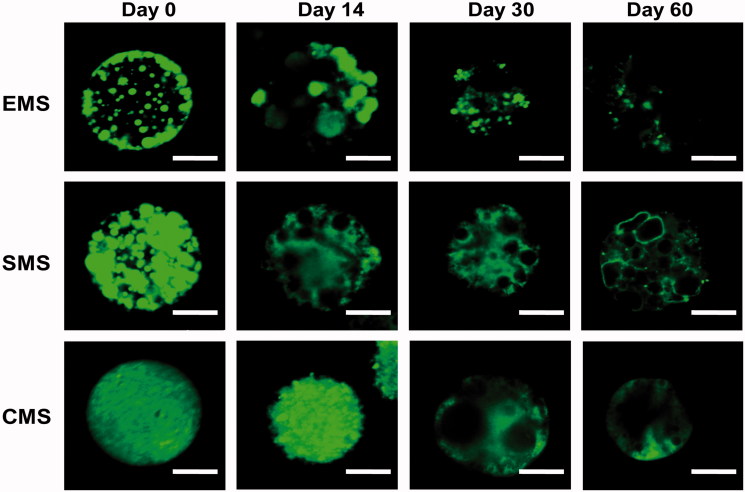
In addition to performing the in vitro release experiment, we also visualized the interior structural evolution of the microspheres using CLSM (confocal Laser scanning microscope) (Figure 4). At Day 0, the EMS microspheres exhibited an uneven distribution of drugs (green), and there were more drugs on or near the surfaces of the microspheres; in contrast, the SMS microspheres also displayed many large nonhomogeneous aggregations, but there was no significant difference between the surface and the core within the microspheres. Insulin is uniformly distributed inside the CMS microspheres.
Figure 4.
CLSM images for inner structural (drug distribution) evolutions of EMS, SMS and CMS at different incubation times. Scale bar: 10 μm.
As incubation proceeded, all of the microspheres gradually degraded. In the EMS microspheres, the peptides near the surface were quickly released, and at Day 14, many pores were in contact with the external phase, showing a higher initial burst release. In the SMS microspheres, the drug domains gradually changed into aqueous pores showing no green color. At Days 30 and 60, the internal structural evolution of the SMS microspheres was almost the same as that of the EMS microspheres. In the CMS microspheres, the drug distribution was still relatively uniform at Day 14, indicating the lowest initial burst. At Day 30, some aqueous pores appeared, and more than half of the drug remained in the CMS microspheres, indicating that before Day 30 the release rate was very slow. At Day 60, a large amount of the peptide diffused out of the microspheres, leaving many large pores inside.
3.5. In vitro bioactivity of microspheres
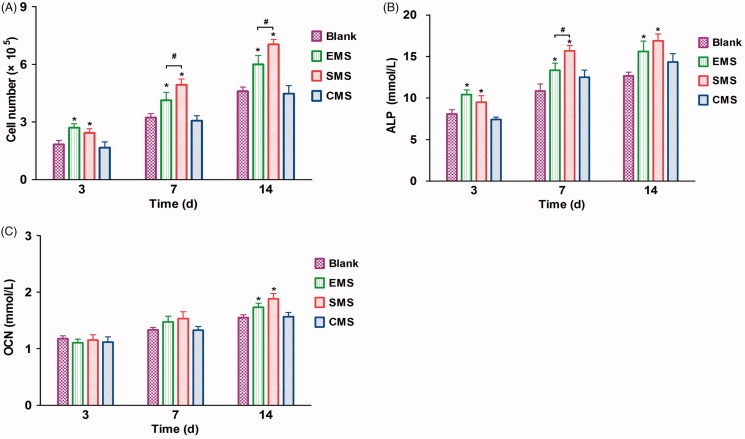
During the 14-day culture, the number of cells increases in all four groups (Figure 5(A)). Compared to the cells that were cultured in the Blank and CMS groups, the numbers in the EMS and SMS groups increased significantly after 3 days. At Days 7 and 14, the cell proliferation in the SMS group was significantly higher than that in the other groups. The cell proliferation in the EMS groups was higher than that in CMS and Blank groups. No significant difference was observed between the Blank and CMS groups.
Figure 5.
In vitro bioactivity of the microspheres (A) The MTS proliferation assay of BMSCs, ALP (B) and OCN concentration (C) in different groups were examined (n = 5, mean ± SD). *Compared to the Blank group. # Compared to the EMS and SMS groups. Differences are significant at p < .05.
As shown in Figure 5(B), compared to the other groups, the ALP concentration in the EMS and SMS groups were significantly higher at Days 3 and 14. At Day 7, the ALP concentration in the SMS group was significantly higher than that in the other groups; and the ALP concentration in the EMS was significantly higher than that in the CMS and Blank group. At Days 3 and 7, no significant difference in OCN expression was observed between the different groups (Figure 5(C)). At Day 14, the OCN expression levels in the SMS and CMS groups were significantly higher than other groups.
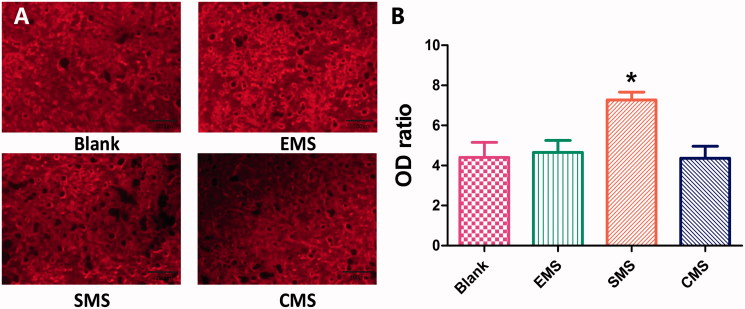
At Day 21, the mineralized formation was observed by Alizarin Red (Figure 6). Calcium accumulation was quantified to determine the extent of osteogenic differentiation. The optical density (OD) ratio values in the four groups were different (Blank: 4.40 ± 2.38, EMS: 4.27 ± 1.90, SMS: 7.02 ± 1.25 and CMS: 4.45 ± 1.90). The optical density in the SMS group is significantly higher than those in the other groups (Summary p value = .0034; Blank vs SMS, t = 3.369, Secondary p < .05; EMS vs SMS, t = 3.076, Secondary p < .05; SMS vs CMS, t = 3.416, Secondary p < .05). No significant differences were observed between the Blank, EMS and CMS groups.
Figure 6.
The mineralized formation in vitro was examined by Alizarin Red staining at Day 21. (A) The optical densities in the Blank, EMS and CMS groups were lower than in the SMS group. (B) Quantification levels of calcium accumulation (n = 10, mean ± SD). *Compared to the Blank group. Differences are significant at p < .05.
3.6. Serum biochemistry in vivo
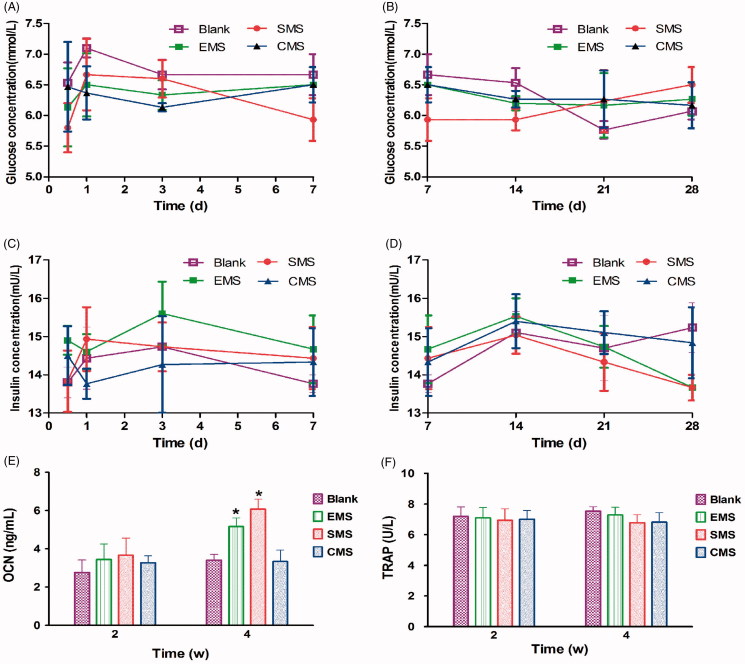
The body weights of all of the rabbits did not significantly change over 8 weeks, and no inflammation or adverse tissue reaction was observed. Although blood glucose levels fluctuate daily, there were no significant differences between the groups (Figure 7(A,B)). Compared to the Blank groups, the serum levels of insulin in the EMS, SMS and CMS groups did not exhibit any significant differences during the four-week observation period (Figure 7(C,D)). The serum OCN levels were significantly higher in the EMS and SMS groups than those in the other groups at Week 4 after surgery (Blank vs EMS, t = 2.510, Secondary p < .05; Blank vs SMS, t = 3.126, Secondary p < .05; Figure 7(E)). However, no significant differences were observed in the serum TRAP activity between the groups (Figure 7(F)).
Figure 7.
Measurement of serum biochemistry (A,B) The fasting blood glucose levels, (C,D) serum levels of insulin, (E) OCN and (F) TRAP activities were detected in different groups. *Compared to the Blank group. Differences are significant at p < .05.
3.7. Morphometric findings in Micro-CT
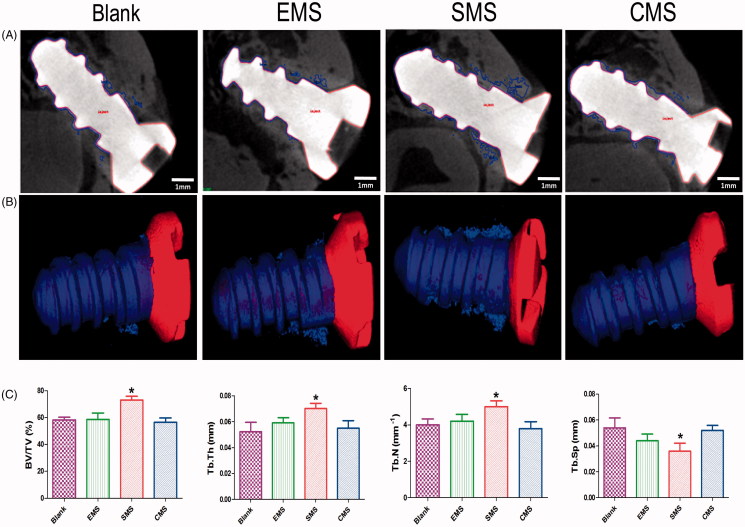
At Week 4 after surgery, bone regeneration around the implants was assessed by micro-CT scanning (Figure 8). Bone regeneration was observed surrounding the implants in all of the groups. The micro-CT results showed a large number of bones were identified in the SMS group. On the other hand, a small amount of bone around the implants in the marrow space in the other groups. In the 3 D reconstruction images, the implant surfaces were covered with thin porous trabecular and discontinuous bone in the EMS, Blank and CMS groups. In the SMS group, plenty of lamellar bones were formed on the implant surfaces.
Figure 8.
Peri-implant bone formation observed by micro-CT (A) At Week 4 after surgery, the peri-implant bone formation was observed. (B) 3 D reconstructed views of the newly formed bone (blue) and titanium implant (Red). (C) Quantitative data were obtained by micro-CT analysis including BV/TV, TB.Th, TB.N, and TB.Sp (n = 5, mean ± SD). *Compared to the Blank group. Differences are significant at p < .05.
3.8. Histological analysis and histomorphometry
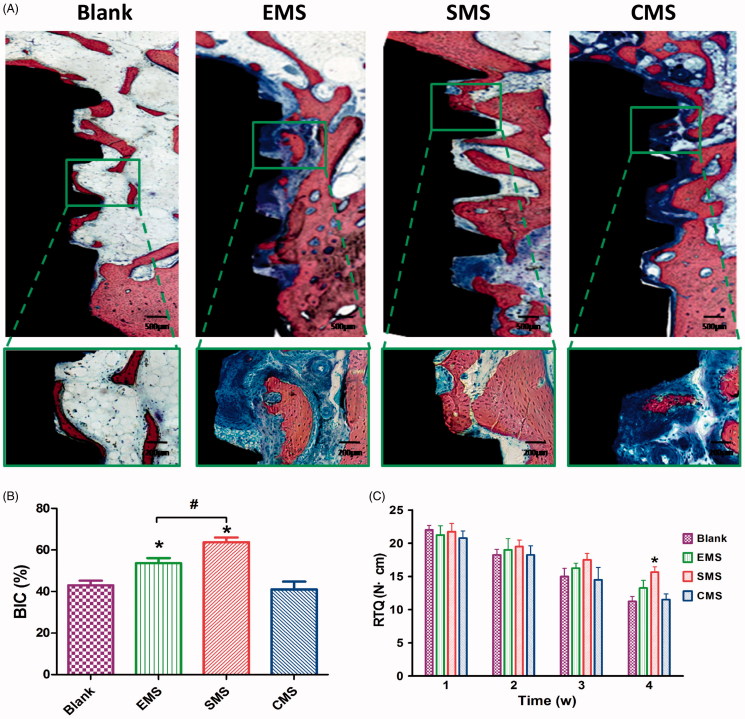
At Week 4, different levels of peri-implant bone regeneration in the Blank, EMS, SMS and CMS groups (Figure 9(A)) were observed using the methylene blue/acid fuchsin. In the SMS group, massive levels of mineralized bones were in contact with the implant surface. By contrast, a thinner bone trabecula structure was observed in the other groups. Based on the methylene blue/acid fuchsin staining results, significant differences in bone regeneration were revealed with histomorphometric measurements. At Week 4, the ratios of BIC in the Blank, EMS, SMS and CMS groups were 43.3 ± 3.2%, 54.7 ± 4.1%, 62.3 ± 4.3% and 41.6 ± 6.2%, respectively (Figure 9(B)). The ratio of BIC in the SMS group was significantly higher than those in the other groups (SMS vs Blank, t = 8.360, Secondary p < .05; SMS vs EMS, t = 4.370, Secondary p < .05; SMS vs CMS, t = 9.169, Secondary p < .05). The BIC ratio in the EMS group was significantly higher than those in the Blank groups (Blank vs EMS, t = 3.928, Secondary p < .05). No significant difference was found in the ratio of BIC between the CMS and Blank groups (Blank vs CMS, t = 0.449, Secondary p > 0.05).
Figure 9.
Histological evaluation of peri-implant bone formation (A) The titanium implant (black staining), bone (red staining) and osteoid (blue staining) were effectively distinguished using methylene blue/acid fuchsin. (B) The ratio of bone-to-implant contact (BIC) at Week 4 (n = 8, mean ± SD). (C) Quantification data for RTQ (n = 4, mean ± SD). *Compared to the Blank group. #Compared to the EMS and SMS groups. Differences are significant at p < .05.
The BV/TV values in the Blank, EMS, SMS and CMS groups were 42.3 ± 3.5%, 48.7 ± 5.3%, 59.3 ± 4.1%, and 40.2 ± 3.8%, respectively. The trabecular thickness values (Tb.Th) for the Blank, EMS, SMS and CMS groups were 0.050 ± 0.016 mm, 0.059 ± 0.009 mm, 0.074 ± 0.008 mm, and 0.055 ± 0.012 mm, respectively. The trabecular numbers (Tb.N) for the Blank, EMS, SMS and CMS groups were 3.90 ± 0.72 mm-1, 4.20 ± 0.80 mm-1, 5.34 ± 0.51 mm-1, and 3.80 ± 0.83 mm-1, respectively. The trabecular separation (Tb.Sp) values for the Blank, EMS, SMS and CMS groups were 0.055 ± 0.015 mm, 0.044 ± 0.011 mm, 0.031 ± 0.011 mm, and 0.052 ± 0.008 mm, respectively. In the bone of the SMS group, significantly higher values were observed for many parameters that are used for indicators of bone quantity, such as BV/TV (Summary p value = .0040; Blank vs SMS, t = 4.482, Secondary p < .05), trabecular thickness (Summary p value = .03; Blank vs SMS, t = 3.207, Secondary p < .05), and trabecular number (Summary p value = .017; Blank vs SMS, t = 3.078, Secondary p < .05). However, the value of trabecular separation (Summary P value = 0.024; Blank vs SMS, t = 3.230, Secondary p < .05) was significantly lower. No significant differences were observed among the Blank, EMS and CMS groups.
3.9. Removal torque (RTQ) analysis
The remove torque (RTQ) values were measured for the Blank, EMS, SMS and CMS groups. As illustrated in Figure 9(C), during the first 4 weeks of observation the RTQ values decreased gradually in all of the groups. At Weeks 1, 2 and 3, there were no statistically significant differences in the mean RTQ values among the Blank, EMS, SMS and CMS groups. At Week 4, the mean RTQ value in the SMS group was significantly higher than that in the Blank group (Blank vs EMS, t = 3.290, Secondary p < .05), indicating that the SMS could delay the loosening of the implant. At Week 4, there is no statistically significant differences were observed among the Blank, EMS and CMS groups.
4. Discussion
Titanium implants play a very important role in patient recovery from orthopedic, dental and maxillofacial surgery. During implant fixation, sufficient peri-implant bone regeneration and high initial stability are urgently needed at the early stage. To obtain more detailed information on accurate regulation of the release behavior of the microspheres, three types of uniform-sized insulin-loaded microspheres were prepared in this study.
We first hypothesized that certain local concentration of insulin would have a potentially beneficial clinical outcome on the peri-implant bone. In previous studies, some evidence exists to suggest that insulin has an effect on bone metabolism. Diabetes mellitus type I is associated with bone loss and osteoporotic fractures (Pramojanee et al., 2014). Skeletal abnormalities in insulinopenic animals can be recovered by insulin therapy (Thrailkill et al., 2005). However, in clinical use, the half-life of insulin is only 5–15 min, so repeated injections are always necessary during a course of treatment (which can last several weeks), but this requirement can greatly reduce the patients’ compliance. PLGA Microspheres are very frequently used as a carrier for insulin delivery in the clinic (Kang & Singh, 2005; Andreas et al., 2011). Local insulin delivery using a fibrin gel with PLGA microspheres improved the implant–bone contact and ameliorated the biomechanical retention of titanium implants in type 1 diabetic rats (Han et al., 2012). However, very few studies have explored the influence of insulin that is released in a sustained manner on the peri-implant bone regeneration in nondiabetic subjects. The major reason may lie in the adverse effects, such as attenuated bone regeneration, hypoglycemia or hyperinsulinemia, that caused by the excessive insulin (Qi et al., 2013, 2014). Thus, spatiotemporal release of insulin may serve as the promising strategy to harness the cell differentiation, osteogenesis and bone mineralization in a controlled manner (Haggag et al., 2018).
To overcome these limitations, the second crucial factor that was considered in this study was the controlled size of the microspheres. In earlier studies, the double emulsification method is widely used in producing insulin microspheres. Since the double emulsion was typically prepared through a mechanical dispersion process, the size and size distribution of the insulin microspheres were not well-controlled (Han et al., 2012). In the present study, three types of insulin-loaded PLGA microspheres with narrow size distributions were prepared using an SPG premix membrane emulsification. The highest encapsulation efficiency and loading capacity were achieved in the CMS preparation because the two miscible organic solvents dissolve insulin more uniformly and are favorable for polymer precipitation. Moreover, this study demonstrated that these three preparation methods did not influence the polymer degradation but instead affected the internal structural evolution, which plays a crucial role in the in vitro release behavior.
Since the release of the microspheres depends on the gradual erosion of the matrix, the inner structural evolution of the microspheres can reflect their degradation status and release behavior (Yushu & Venkatraman, 2006). In the CLSM images, the EMS microspheres exhibited more drug distributed on or near the surfaces at Day 0 because the EMS microspheres were exposed to large volumes of water during their preparation, resulting in fast diffusion. When the drug diffused rapidly into the medium, a high initial release burst (40% within 24 h) was observed. In the SMS microspheres, the CLSM images showed a nonuniform drug distribution with many large nonhomogeneous aggregations. As incubation proceeded, the peptide was dissolved, and more pores were gradually generated inside the SMS microspheres, resulting in a constant release over 50 days. Since the drug was dissolved in the oil phase, the drug distribution in the CMS microspheres was relatively uniform. At Day 30, some amount of the drug remained in the core of microspheres, leading to the lowest release in the first four weeks. After this period, a large amount of the drugs diffused out of the microspheres between Days 30 and 60, leaving many large pores. In summary, this study confirmed that for particles of the same size, the drug release was controlled by the inner structural evolution of the microspheres and the decrease in the polymer MW.
To further optimize the microspheres for peri-implant bone regeneration, the third main feature of this article is the comparison of the bioactivity of the microspheres in vitro and in vivo (Figure 10). At 0-2 weeks, a high level of primary stability is initially achieved by friction. However, the primary stability is quickly degraded due to the necrosis of the neighboring bone. Additionally, the cytokines and growth factors that are secreted from the inflammatory cells at the implant site modulate the proliferation and osteogenic differentiation of BMSCs (Lauzon et al., 2012). In this study, the insulin that was released from the microspheres exhibited good biocompatibility to facilitate osteogenic differentiation of the BMSCs. Considering that insulin induces the osteogenesis in a dose-dependent manner, we believe that the discrepancies in cell experiments are due to the different release characteristics of the microspheres.
Figure 10.
Initial stability of the implant and the release timeline of the three types of insulin-loaded microspheres.
During the secondary stability stage (2–4 weeks), osteoblasts rapidly produce osteoid, and weak woven bone is gradually formed (Deschaseaux et al., 2009). The implant stability is the lowest in the phase known as the implant stability dip. Therefore, there is an urgent need to improve bone regeneration exists at this early stage. A lot of research conducted on this region and demonstrated that insulin and its downstream MAPK and PI3K pathways play a vital role in bone remodeling (Goodman & Hori, 1984). In this study, the results of the histological and micro CT showed different levels of osseointegration. In the SMS group, massive mineralized bones contacted the implants with higher values for bone quantity parameters such as BV/TV, trabecular thickness, and trabecular number. At Week 4, the BIC ratio in the EMS and SMS group was significantly higher than those in the CMS and Blank groups. These results are in good agreement with the previous theoretical and experimental studies that report that insulin not only promotes the osteogenic differentiation of BMSCs at the initial stage but is also essential for bone regeneration and remodeling (Abtahi et al., 2013). To further study the insulin microspheres on the titanium implant clinical survival rate, the RTQ value was tested. At Week 4, compared to Blank group, the RTQ value was significantly higher in the SMS group, indicating that the SMS microspheres could delay the loosening of the implant.
In the present study, two reasons exist why the insulin-loaded PLGA microspheres are applied for local treatment. First, the local concentration of insulin around the titanium implant could be higher (at least initially) than that in the surrounding tissues. Recently studies have developed insulin-loaded tissue engineering approaches based on the covalent binding of insulin to polymeric scaffolds, which could stimulate cartilage regeneration and inhibit inflammatory mediators locally (Wang et al., 2017). Second, adverse effects such as hypoglycemia or hyperinsulinemia may be avoided through local treatment. To assess the systemic influence of the insulin-loaded PLGA microspheres, a serum biochemistry assessment was performed. Although the blood glucose fluctuated daily, no significant differences were observed between the groups. Compared to the Blank groups, the serum levels of insulin in the EMS, SMS and CMS groups did not exhibit any significant differences during the four-week observation period. These results suggest that the risk of hypoglycemia or hyperinsulinemia is low when these microspheres are injected locally. Moreover, the serum OCN levels were significantly higher in the EMS and SMS groups than those in the other groups at Week 4 after surgery. However, no significant differences in the serum TRAP activities were observed between the groups, indicating that the osteoclast levels were stable in all groups (Gerstenfeld et al., 2009). All of these results are consistent with the studies by Thomas et al., who found that insulin favors bone regeneration rather than bone resorption by influencing osteoblast development (Thomas et al., 1998). In diabetic animal models, the TRAP activities and osteoclast number increased significantly, but this could be reversed by local insulin treatment (Kayal et al., 2009).
As mentioned above, this article focused primarily on the regulation of local insulin concentrations at specific stages and the optimization of insulin stimulation for peri-implant bone regeneration. This study could provide more detailed information on accurate regulation of the release behavior of the microspheres, which is the key to optimize the beneficial effects of growth factors. However, although the role of insulin in osteogenesis has been described in many studies, the mechanism is still unclear. Additionally, in different animal species, the optimal concentration and timing of different growth factors for bone regeneration may vary. Therefore, more in-depth studies are required to explore the specific mechanism of different growth factors on bone regeneration, which is promising to facilitate the development of dental implant, fracture and nonunion bone defect.
5. Conclusion
These three preparation methods (solvent extraction, solvent evaporation or cosolvent methods) affected the internal structural evolution of the microspheres and their release behaviors in vitro without impacting the particle size and polymer degradation. Compared to the EMS and CMS microspheres, the SMS microspheres exhibited a relatively steady release rate in the first four weeks that was more beneficial to the osteogenic differentiation of BMSCs and peri-implant bone regeneration in vivo. Moreover, the in vivo results indicate that the SMS microspheres could evidently enhance the stability of the implant at Week 4, which is promising to reduce early failure rate of the implant without inducing any adverse effects on the serum biochemical indices.
Funding Statement
This study was supported by the Beijing Natural Science Foundation [grant numbers 7184247], the National Natural Science Foundation of China [grant numbers 81801004, 81271144], the Shanxi Applied Basic Research Program Science-Youth Technology Research Fund [grant numbers 201701D221160] and the Startup Foundation for Doctors of Shanxi Medical University [grant numbers BS03201639]. Research Fund of Shanxi Medical University School and Hospital of Stomatology KY201602.
Author contributions
Conceptualization, xing wang; Data curation, Xiaoxuan Zhang and Chunxiang Lu; Formal analysis, Helin Xing and Jiajia Zheng; Funding acquisition, xing wang and Xiuyun Ren; Investigation, Chunxiang Lu; Methodology, feng qi, Helin Xing and Jiajia Zheng; Project administration, Xiuyun Ren; Software, Helin Xing; Supervision, Jiajia Zheng and Xiuyun Ren; Writing – original draft, xing wang and feng qi; Writing – review & editing, Xiaoxuan Zhang, Chunxiang Lu and Xiuyun Ren.
Disclosure statement
No potential conflict of interest was reported by the authors.
References
- Abtahi J, Agholme F, Sandberg O, Aspenberg P (2013). Effect of local vs systemic bisphosphonate delivery on dental implant fixation in a model of osteonecrosis of the Jaw. J Dent Res 92:279–83. [DOI] [PubMed] [Google Scholar]
- Anderson J, Patterson J, Vines J, et al. (2011). Biphasic peptide amphiphile nanomatrix embedded with hydroxyapatite nanoparticles for stimulated osteoinductive response. ACS Nano 5:9463–79. [DOI] [PMC free article] [PubMed] [Google Scholar]
- Andreas K, Zehbe R, Kazubek M, et al. (2011). Biodegradable insulin-loaded PLGA microspheres fabricated by three different emulsification techniques: investigation for cartilage tissue engineering. Acta Biomater 7:1485–95. [DOI] [PubMed] [Google Scholar]
- Brånemark P, Adell R, Albrektsson T, et al. (1983). Osseointegrated titanium fixtures in the treatment of edentulousness. Biomaterials 4:25–8. [DOI] [PubMed] [Google Scholar]
- Coelho P, Jimbo R, Tovar N, Bonfante E (2015). Osseointegration: hierarchical designing encompassing the macrometer, micrometer, and nanometer length scales. Dent Mater 31:37–52. [DOI] [PubMed] [Google Scholar]
- Contaldo C, Myers T, Zucchini C, et al. (2014). Expression levels of insulin receptor substrate-1 modulate the osteoblastic differentiation of mesenchymal stem cells and osteosarcoma cells. Growth Factors 32:41–52. [DOI] [PubMed] [Google Scholar]
- Deschaseaux F, Sensébé L, Heymann D (2009). Mechanisms of bone repair and regeneration. Trends Mol Med 15:417–29. [DOI] [PubMed] [Google Scholar]
- Fournier SB, D’Errico JN, Stapleton PA (2018). Engineered nanomaterial applications in perinatal therapeutics. Pharmacol Res 130:36–43. [DOI] [PMC free article] [PubMed] [Google Scholar]
- Gerstenfeld L, Sacks D, Pelis M, et al. (2009). Comparison of effects of the bisphosphonate alendronate versus the RANKL inhibitor denosumab on murine fracture healing. J Bone Miner Res 24:196–208. [DOI] [PMC free article] [PubMed] [Google Scholar]
- Goodman W, Hori M (1984). Diminished bone formation in experimental diabetes. Relationship to osteoid maturation and mineralization. Diabetes 33:825–31. [DOI] [PubMed] [Google Scholar]
- Goriainov V, Cook R, Latham J, et al. (2014). Bone and metal: an orthopaedic perspective on osseointegration of metals. Acta Biomater 10:4043–57. [DOI] [PubMed] [Google Scholar]
- Gundersen H, Bendtsen T, Korbo L, et al. (1988). Some new, simple and efficient stereological methods and their use in pathological research and diagnosis. Apmis 96:379–94. [DOI] [PubMed] [Google Scholar]
- Haggag Y, Faheem A, Tambuwala M, et al. (2018). Effect of poly(ethylene glycol) content and formulation parameters on particulate properties and intraperitoneal delivery of insulin from PLGA nanoparticles prepared using the double-emulsion evaporation procedure. Pharm Dev Technol 23:370–81. [DOI] [PubMed] [Google Scholar]
- Han Y, Zeng Q, E L, et al. (2012). Sustained topical delivery of insulin from fibrin gel loaded with poly(lactic-co-glycolic Acid) microspheres improves the biomechanical retention of titanium implants in type 1 diabetic rats. J Oral Maxillofac Surg 70:2299–308. [DOI] [PubMed] [Google Scholar]
- Hu C, Feng H, Zhu C (2012). Preparation and characterization of rifampicin-PLGA microspheres/sodium alginate in situ gel combination delivery system. Colloids Surface B 95:162–9. [DOI] [PubMed] [Google Scholar]
- Kang F, Singh J (2005). Preparation, in vitro release, in vivo absorption and biocompatibility studies of insulin-loaded microspheres in rabbits. AapsPharmscitech 6:E487–494. [DOI] [PMC free article] [PubMed] [Google Scholar]
- Kayal R, Alblowi J, Mckenzie E, et al. (2009). Diabetes causes the accelerated loss of cartilage during fracture repair which is reversed by insulin treatment. Bone 44:357–63. [DOI] [PMC free article] [PubMed] [Google Scholar]
- Kazazi-Hyseni F, Landin M, Lathuile A, et al. (2014). Computer modeling assisted design of monodisperse PLGA microspheres with controlled porosity affords zero order release of an encapsulated macromolecule for 3 months. Pharm Res 31:2844–56. [DOI] [PubMed] [Google Scholar]
- Lai P, Daear W, Lobenberg R, Prenner E (2014). Overview of the preparation of organic polymeric nanoparticles for drug delivery based on gelatine, chitosan, poly(D,L-lactide-co-glycolic acid) and polyalkylcyanoacrylate. Colloid Surface B 118:154–63. [DOI] [PubMed] [Google Scholar]
- Lauzon M, Bergeron É, Marcos B, Faucheux N (2012). Bone repair: new developments in growth factor delivery systems and their mathematical modeling. J Control Release 162:502–20. [DOI] [PubMed] [Google Scholar]
- Lock J, Nguyen T, Liu H (2012). Hydroxyapatite and poly (lactide-co-glycolide) composites promote human mesenchymal stem cell adhesion and osteogenic differentiation in vitro. J Mater Sci Mater Med 23:2543–452. [DOI] [PubMed] [Google Scholar]
- Malekzadeh B, Tengvall P, Ohrnell L, et al. (2013). Effects of locally administered insulin on bone formation in non-diabetic rats. J Biomed Mater Res 101:132–7. [DOI] [PubMed] [Google Scholar]
- Masuzaki T, Ayukawa Y, Moriyama Y, et al. (2010). The effect of a single remote injection of statin-impregnated poly (lactic-co-glycolic acid) microspheres on osteogenesis around titanium implants in rat tibia. Biomaterials 31:3327–34. [DOI] [PubMed] [Google Scholar]
- Pramojanee S, Phimphilai M, Chattipakorn N, Chattipakorn S (2014). Possible roles of insulin signaling in osteoblasts. Endocr Res 39:144–51. [DOI] [PubMed] [Google Scholar]
- Qi F, Wu J, Fan Q, et al. (2013). Preparation of uniform-sized exenatide-loaded PLGA microspheres as long-effective release system with high encapsulation efficiency and bio-stability. Collid Surface B 112:492–8. [DOI] [PubMed] [Google Scholar]
- Qi F, Wu J, Yang T, et al. (2014). Mechanistic studies for monodisperse exenatide-loaded PLGA microspheres prepared by different methods based on SPG membrane emulsification. Acta Biomater 10:4247–56. [DOI] [PubMed] [Google Scholar]
- Qian S, Qiao Y, Liu X (2014). Selective biofunctional modification of titanium implants for osteogenic and antibacterial applications. J Mater Chem 2:7475–87. [DOI] [PubMed] [Google Scholar]
- Smeets R, Stadlinger B, Schwarz F, et al. (2016). Impact of dental implant surface modifications on osseointegration. BioMed Res Int 2:6285620. [DOI] [PMC free article] [PubMed] [Google Scholar]
- Tang W, Lin D, Yu Y, et al. (2016). Bioinspired trimodal macro/micro/nano-porous scaffolds loading rhBMP-2 for complete regeneration of critical size bone defect. Acta Biomater 32:309–23. [DOI] [PubMed] [Google Scholar]
- Thomas D, Udagawa N, Hards D, et al. (1998). Insulin receptor expression in primary and cultured osteoclast-like cells. Bone 23:181–6. [DOI] [PubMed] [Google Scholar]
- Thrailkill K, Liu L, Wah E, et al. (2005). Bone formation is impaired in a model of type 1 diabetes. Diabetes 54:2875–81. [DOI] [PubMed] [Google Scholar]
- Uribe R, Peñarrocha M, Balaguer J, Fulgueiras N (2005). Immediate loading in oral implants. present situation. Med Oral Patol Oral 10:E143–E153. [PubMed] [Google Scholar]
- Wang B, Song Y, Wang F, et al. (2011). Effects of local infiltration of insulin around titanium implants in diabetic rats. Br J Oral Maxillofac Surg 49:225–9. [DOI] [PubMed] [Google Scholar]
- Wang L, Xu X, Huo N, et al. (2013). A combination of insulin and ubiquitin A20 promotes osteocalcin expression in adipose-derived stem cells. Biochem Cell Biol 91:513–8. [DOI] [PubMed] [Google Scholar]
- Wang X, Wu X, Xing H, et al. (2017). Porous nano-hydroxyapatite/collagen scaffolds loading insulin PLGA particles for restoration of critical size bone defect. ACS Appl Mater Interfaces 13:11380–91. [DOI] [PubMed] [Google Scholar]
- Wang X, Zhang G, Qi F, et al. (2017). Enhanced bone regeneration using an insulin-loaded nano-hydroxyapatite/collagen/plga composite scaffold. IJN 13:117–27. [DOI] [PMC free article] [PubMed] [Google Scholar]
- Wang X, Zou X, Zhao J, et al. (2016). Site-specific characteristics of bone marrow mesenchymal stromal cells modify the effect of aging on the skeleton. Rejuv Res 5:351–61. [DOI] [PubMed] [Google Scholar]
- Yushu H, Venkatraman S (2006). The effect of process variables on the morphology and release characteristics of protein-loaded PLGA particles. J Appl Polym Sci 101:3053–61. [Google Scholar]


