Abstract
TFEB is a basic helix-loop-helix transcription factor that confers protection against metabolic diseases such as atherosclerosis by targeting a network of genes involved in autophagy-lysosomal biogenesis and lipid catabolism. In this study, we sought to characterize the role of TFEB in adipocyte and adipose tissue physiology and evaluate the therapeutic potential of adipocyte-specific TFEB overexpression in obesity. We demonstrated that mice with adipocyte-specific TFEB overexpression (Adipo-TFEB) were protected from diet-induced obesity, insulin resistance, and metabolic sequelae. Adipo-TFEB mice were lean primarily through increased metabolic rate, suggesting a role for adipose tissue browning and enhanced nonshivering thermogenesis in fat. Transcriptional characterization revealed that TFEB targeted genes involved in adipose tissue browning rather than those involved in autophagy. One such gene encoded PGC-1α, an established target of TFEB that promotes adipocyte browning. To dissect the role of PGC-1α in mediating the downstream effects of TFEB overexpression, we generated mice with adipocyte-specific PGC-1α deficiency and TFEB overexpression. Without PGC-1α, the ability of TFEB overexpression to brown adipose tissue and to elicit beneficial metabolic effects was blunted. Overall, these data implicate TFEB as a PGC-1α–dependent regulator of adipocyte browning and suggest its therapeutic potential in treating metabolic disease.
INTRODUCTION
Adipose tissue browning, a process in which adipocyte mitochondria are thermogenically uncoupled, is a promising target in the search for physiological mechanisms that can combat the obesity-diabetes epidemic. Both classical brown and convertible beige adipocytes contribute to physiological thermogenic uncoupling and are capable of increasing whole-body basal metabolic rate. Thus, a major area of interest is in how adipocyte function can be harnessed to combat metabolic disease (1). Transcription factor EB (TFEB) is a basic helix-loop-helix transcription factor originally characterized as a regulator of autophagy-lysosome biogenesis. In response to various stress-related stimuli (2–5), TFEB translocates to the nucleus and binds coordinated lysosome expression and regulation (CLEAR) elements in the promoter of target genes to enhance their transcription (6). Because of these initial studies, the set of TFEB targets has been more fully characterized and is appreciated to include genes involved in immunity (7), lipid catabolism (4), and mitochondrial biogenesis (8). In turn, TFEB overexpression or deficiency can markedly affect cellular phenotype with physiological relevance in settings including atherosclerosis (3, 9), fatty liver disease (4), cancer (10), and neurodegeneration (11). However, it remains unknown how TFEB might regulate adipocyte phenotype through transcriptional functions related to autophagy-lysosome biogenesis or otherwise. Autophagy has numerous functions that are relevant to the adipocyte phenotype including the degradation of mitochondria and other cellular cargo (12, 13). In addition, it is unknown whether TFEB targeting of genes related to lipid and mitochondrial metabolism could have relevance to adipose tissue browning. Of particular interest, the peroxisome proliferator–activated receptor (PPAR) coactivator-1α (PGC-1α) is a central regulator of adipose tissue browning (14) and has been identified as a direct TFEB target in other systems (4). In the present study, we sought to characterize the transcriptional and physiological impact of adipocyte-specific TFEB overexpression.
RESULTS
Adipocyte-specific TFEB overexpression protects against diet-induced obesity
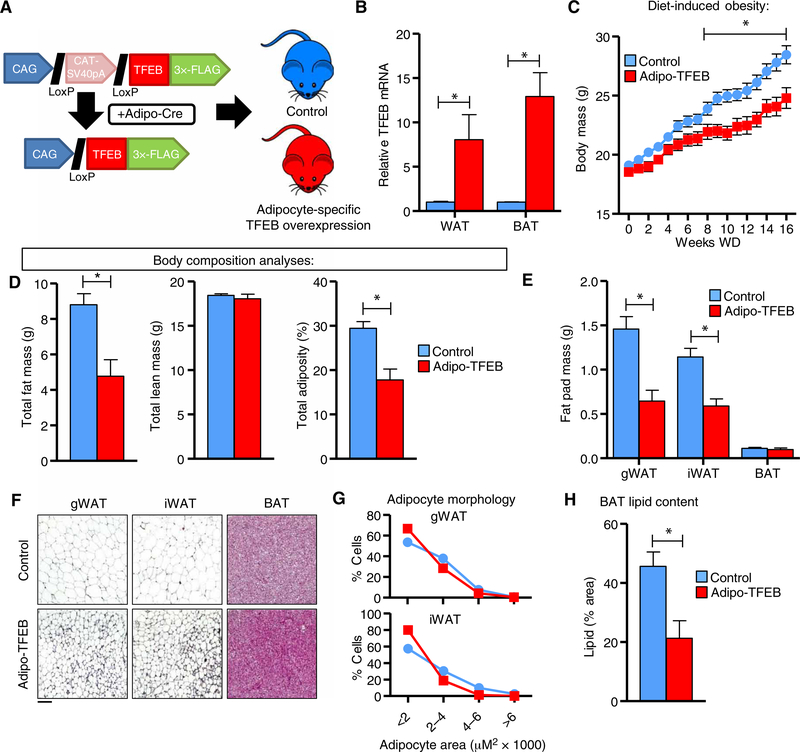
Because of the therapeutic effects of driving autophagy and TFEB in many other contexts, we sought to assess the functional impact of driving the autophagy-lysosome system in adipocytes. Mice carrying an adiponectin-Cre transgene were bred with mice carrying a previously described TFEB transgene (4) to generate adipocyte-specific TFEB transgenic (Adipo-TFEB) mice and littermate controls (Fig. 1A) with overexpression in both white and brown adipose (Fig. 1B). Female Adipo-TFEB mice gained less weight in response to diet-induced obesity (Fig. 1C), an effect that was nearly entirely driven by a specific reduction in adiposity (Fig. 1D). This pattern was also observed in male mice (fig. S1, A and B). Consistent with these data, gonadal and inguinal white adipose tissue (gWAT and iWAT, respectively) masses were reduced but not brown adipose tissue (BAT; Fig. 1E). Adipose tissue appeared histologically normal (Fig. 1F) with reduced mean adipocyte size (Fig. 1G). Overall BAT mass was similar, with substantially reduced lipid content (Fig. 1H).
Fig. 1. Adipocyte-specific TFEB overexpression attenuates diet-induced obesity.
(A) Experimental strategy outlining adiponectin-Cre–driven TFEB transgene expression to generate Adipo-TFEB mice. (B) mRNA levels of TFEB in WAT and BAT in 8-week-old, chow-fed female mice (n = 4 control and 5 Adipo-TFEB mice). (C to H) Various metabolic parameters were measured in female mice fed a Western diet for 16 weeks. (C) Body mass response to diet-induced obesity (n = 22 control and 13 Adipo-TFEB mice). (D) Total fat mass, lean mass, and adiposity (n = 16 control, 9 Adipo-TFEB mice). (E) Fat pad masses upon sacrifice (n = 16 control and 9 Adipo-TFEB mice). (F) Representative H&E staining of gWAT, iWAT, and BAT. Scale bar, 100 μm. (G) gWAT and iWAT adipocyte size distributions (pooled from n = 6 control and 4 Adipo-TFEB mice). (H) BAT lipid content (n = 11 control and 7 Adipo-TFEB mice). All data are presented as means ± SEM. Student’s two-tailed t test, *P < 0.05.
Adipocyte-specific TFEB overexpression preserves glucose dynamics and protects against hepatic steatosis
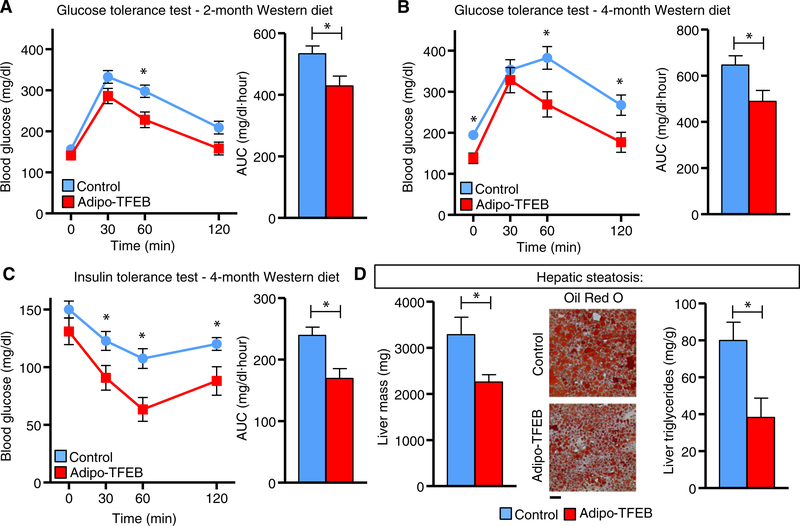
Given that Adipo-TFEB mice were protected against diet-induced obesity and displayed trends for reductions in serum glucose and lipids (fig. S2, A to D), we sought to study its potential in ameliorating diet-induced metabolic pathology. Adipo-TFEB mice had lower blood glucose during a glucose tolerance test (GTT) after 2 and 4 months on a Western diet (WD) (Fig. 2, A and B) and improved insulin sensitivity as assessed by an insulin tolerance test (ITT) (Fig. 2C). Further, we showed that adipocyte-TFEB overexpression conferred protection against hepatic steatosis. The livers from Adipo-TFEB mice fed a WD featured reduced mass and lipid content as indicated by both Oil Red O staining and total liver triglyceride content (Fig. 2D). We did not observe improved insulin or glucose tolerance in young, chow-fed mice (fig. S2, E to F), suggesting that these changes were secondary to the differences in adiposity and TFEB overexpression in adipocytes may not directly regulate these phenotypes.
Fig. 2. Adipocyte TFEB improves glucose and insulin tolerance and hepatic steatosis.
All analyses were performed in male mice fed a Western diet for the indicated duration. (A) Glucose tolerance test (GTT) and area under the curve (AUC) after 2 months on a Western diet (n = 16 control and 8 Adipo-TFEB mice). (B) Glucose tolerance test (GTT) and AUC after 4-month WD (n = 16 control and 8 Adipo-TFEB mice). (C) Insulin tolerance test and AUC in male mice fed WD for 4 months (n = 16 control and 8 Adipo-TFEB mice). (D) Liver mass, representative Oil Red O staining, and liver triglycerides in male mice fed WD for 4 months (n = 3 to 5 mice for each genotype). Scale bar, 100 μm. All data are presented as means ± SEM. Student’s two-tailed t test, *P < 0.05.
TFEB enhances metabolic rate and adipose tissue browning with minimal functional impact on autophagy and lysosomes
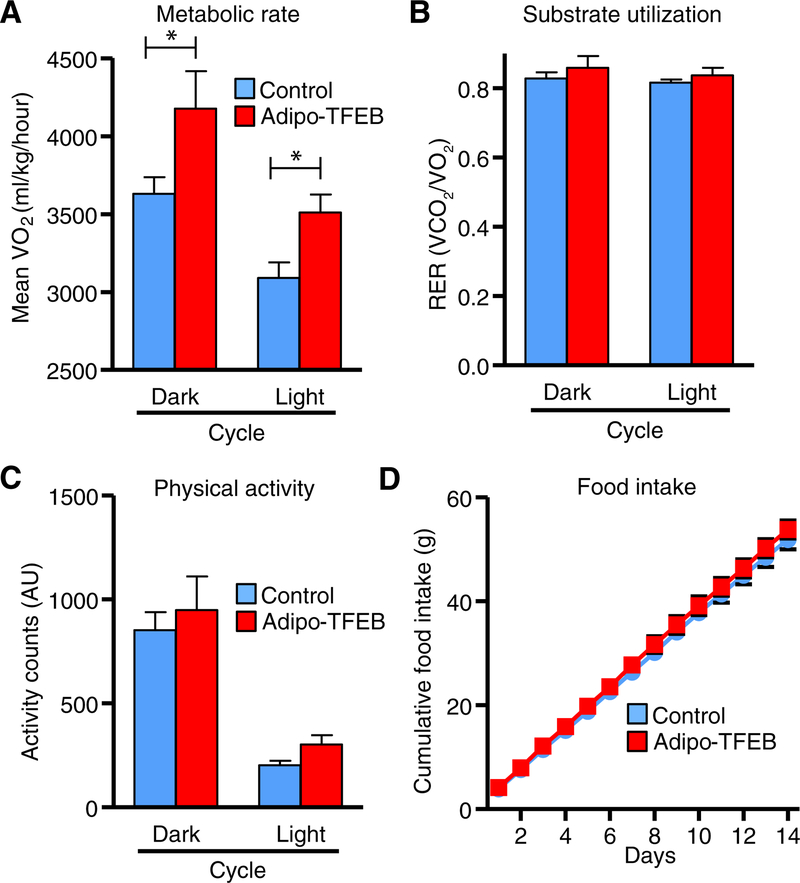
Next, we sought to assess the physiological and molecular mechanisms by which TFEB might confer protection against diet-induced obesity. Adipo-TFEB mice on a WD displayed elevated metabolic rate compared to controls (Fig. 3A) with no differences in substrate utilization, physical activity, or food intake (Fig. 3, B to D). We also observed trends toward higher metabolic rate in young mice fed a chow diet (fig. S2G) in the absence of overt differences in body mass (fig. S2H). Overall, this pattern of increased resting energy expenditure was suggestive of enhanced nonshivering thermogenesis and adipose tissue browning. Thus, we transcriptionally characterized iWAT and BAT for genes related to both classical autophagy-lysosome targets and adipose tissue browning.
Fig. 3. TFEB overexpression increases metabolic rate in diet-induced obesity.
Metabolic cage analyses were averaged over dark (active) and light (inactive) cycles (n = 9 control and 5 Adipo-TFEB female mice after 4 months on a Western diet). (A) Oxygen consumption. (B) Respiratory exchange ratio (RER). (C) Physical activity. (D) Cumulative chow food intake was measured daily over 14 days (n = 8 control and 6 Adipo-TFEB male mice). Data are presented as means ± SEM. Student’s two-tailed t test, *P < 0.05.
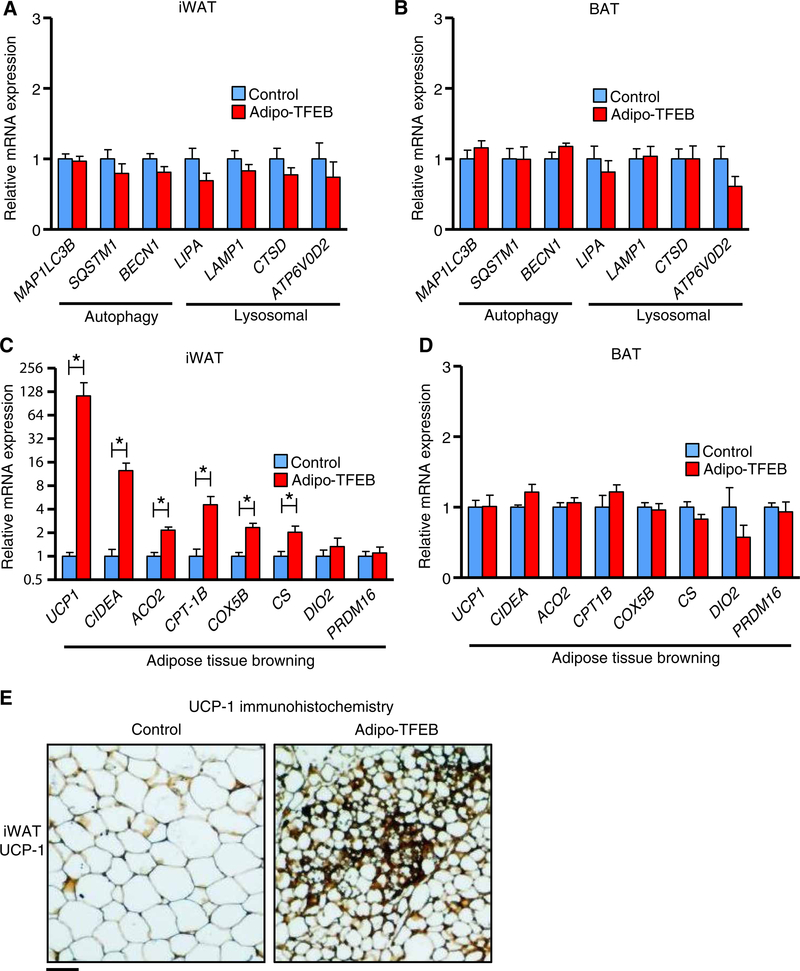
Unexpectedly, TFEB overexpression had no clear impact on autophagy or lysosome genes in iWAT (Fig. 4A) or BAT (Fig. 4B) from WD-fed mice. We considered the possibility that secondary factors related to differences in adiposity between WD-fed Adipo-TFEB and control mice might mask the true ability of TFEB to drive the expression of autophagy and lysosome genes in adipocytes. Thus, we characterized the autophagy-lysosome system in adipose from young, 8-week-old chow-fed mice in which overt differences in adiposity were absent. In these mice, TFEB induced modest, ~25 to 50% increases in several known target genes (fig. S3A). As a complementary and cell-autonomous model, we also studied differentiated stromal vascular cells isolated from iWAT and noted modest or no change for most genes (fig. S3B). The degree of TFEB overexpression in this model was similar to that in vivo (fig. S4A), and TFEB overexpression did not affect adipogenic efficiency as assessed by the expression of several mRNA markers in differentiated cells (fig. S4B). Functionally, the relevance of these changes is ultimately contingent on their ability to increase autophagic flux, the gold standard measure of overall autophagy-lysosome system function. We assessed autophagic flux as the accumulation of the mature autophagosome marker LC3-II in the presence of chloroquine, a lysosome inhibitor that prevents their degradation. TFEB overexpression modestly increased LC3 expression at baseline but did not obviously increase autophagic flux assessed as the increase in LC3 expression with starvation and chloroquine (fig. S3C). The abundance of TFEB target lysosomal proteins Lamp-1 and CtsD in iWAT and the enzymatic activity of lysosomal acid lipase did not differ between chow-fed control and Adipo-TFEB mice (fig. S3, D and E). One way in which changes in the autophagy-lysosome system that could lead to the leanness we observed in Adipo-TFEB mice is enhanced lipophagy, the autophagic degradation of lipid droplets (15, 16). However, we noted no changes in lipolysis in WAT explants (fig. S3F), and there is little precedence for the relevance of adipocyte lipophagy to overall lipolysis in the literature. We found that in stromal-vascular adipocytes, TFEB overexpression did not induce the expression of genes related to mitochondrial dynamics and mitophagy (fig. S3G) or the recruitment of LC3 to mitochondria as a functional index of mitophagy (fig. S3, H and I).
Fig. 4. TFEB transcriptionally drives browning in iWAT.
Transcriptional characterization in fat pads from female mice fed a Western diet for 4 months. (A) Autophagy and lysosomal genes in iWAT (n = 9 control and 7 Adipo-TFEB mice). (B) Autophagy and lysosomal genes in BAT (n = 9 control and 7 Adipo-TFEB mice). (C) Adipose tissue browning genes in iWAT (n = 9 control and 7 Adipo-TFEB mice). (D) Adipose tissue browning genes in BAT (n = 9 control and 7 Adipo-TFEB mice). (E) Representative UCP-1 immunohistochemistry of iWAT (n = 5 control and 5 Adipo-TFEB mice). Scale bar, 100 μm. Data are presented as means ± SEM. Mann-Whitney U (for UCP-1 only) and Student’s two-tailed t test, *P < 0.05.
In contrast to the overall modest functional effects of TFEB overexpression in driving the autophagy-lysosome system in adipose tissue, we noted a clear induction of adipose tissue browning–related genes in iWAT including uncoupling protein 1 (UCP1), which encodes a key thermogenic protein, and mitochondrial and lipid metabolism genes such as CIDEA, ACO2, CPT1B, COX5B, and CS (Fig. 4C). These genes were not induced in the BAT of Adipo-TFEB mice (Fig. 4D). Immunohistochemistry showed substantial regions of UCP-1–positive beige adipocytes exclusively in the iWAT of Adipo-TFEB mice (Fig. 4E and fig. S5A), thus indicating that the increased UCP1 mRNA expression resulted in increased UCP-1 protein abundance.
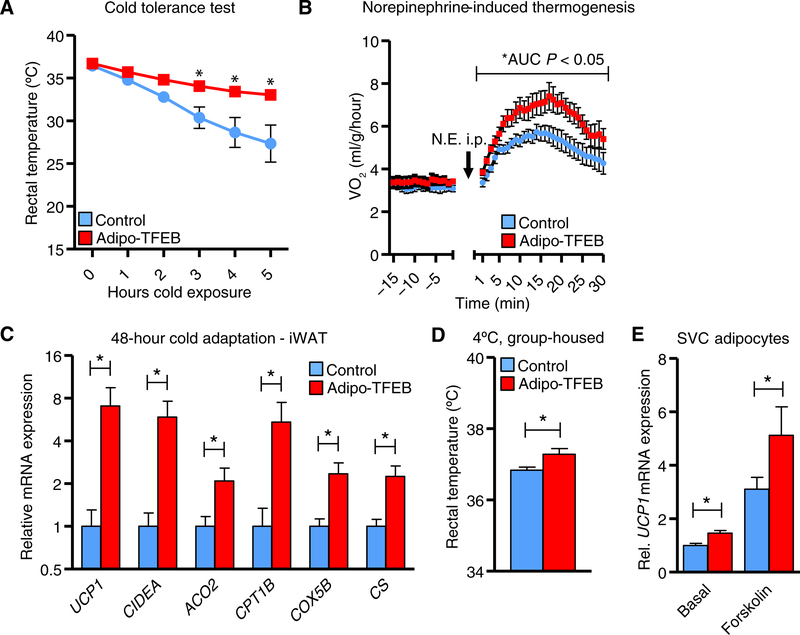
To assess whether these observations were functionally meaningful for thermogenesis, mice were subjected to a cold tolerance test. Adipo-TFEB mice maintained their core temperature at a level higher than control mice, suggesting enhanced thermogenic capacity (Fig. 5A). In addition, injection of mice with the β-adrenergic agonist norepinephrine to induce thermogenesis resulted in a higher increase in VO2 in Adipo-TFEB mice than control mice (Fig. 5B). After cold adaptation, after which browning genes are already markedly induced, TFEB mice still displayed higher expression of UCP1 and other browning genes in iWAT (Fig. 5C) but not in BAT (with the exception of CIDEA; fig. S5B) and significant elevation in core temperature (Fig. 5D). Last, we observed a significant cell-autonomous induction of UCP1 expression in stromal vascular cell (SVC)–derived adipocytes, which was synergistic with forskolin-induced cyclic adenosine monophosphate production (Fig. 5E). These changes were likely more modest than in vivo because cells were differentiated using a beige adipogenesis protocol in which basal UCP1 expression is already fairly high.
Fig. 5. TFEB drives PGC-1α, and PGC-1α deficiency limits TFEB-induced browning.
(A) Core (rectal) temperatures assessed hourly during a cold tolerance test at 4°C (n = 6 control and 7 Adipo-TFEB 8-week-old, chow-fed male mice). (B) Oxygen consumption in response to norepinephrine (N.E.) injection (1 mg/kg ip; n = 6 control and 5 Adipo-TFEB 10-week-old female mice). (C) Adipose tissue browning genes in iWAT (n = 8 control and 6 Adipo-TFEB 3-month-old male mice) after 48 hours of group housing at 4°C. (D) Rectal (core) temperature in the mice from (C). (E) UCP1 mRNA in differentiated primary iWAT SVC adipocytes treated with vehicle or forskolin (10 μM) (n = 3 biological replicates for each group and representative of at least two independent experiments). Data are presented as means ± SEM. Student’s two-tailed t test, *P < 0.05 compared to respective control.
Mice housed at typical room temperatures (~21°C) are subject to some basal degree of thermal stress because this is below their preferred housing temperature. We addressed whether TFEB overexpression could increase the expression of mitochondrial and lipid metabolic genes in the absence of this thermogenic demand by housing mice at thermoneutrality (30°C) for 2 weeks and still observed increased gene expression in iWAT (fig. S5C) but not BAT (fig. S5D).
Metabolic phenotypes of TFEB overexpression are PGC-1α dependent
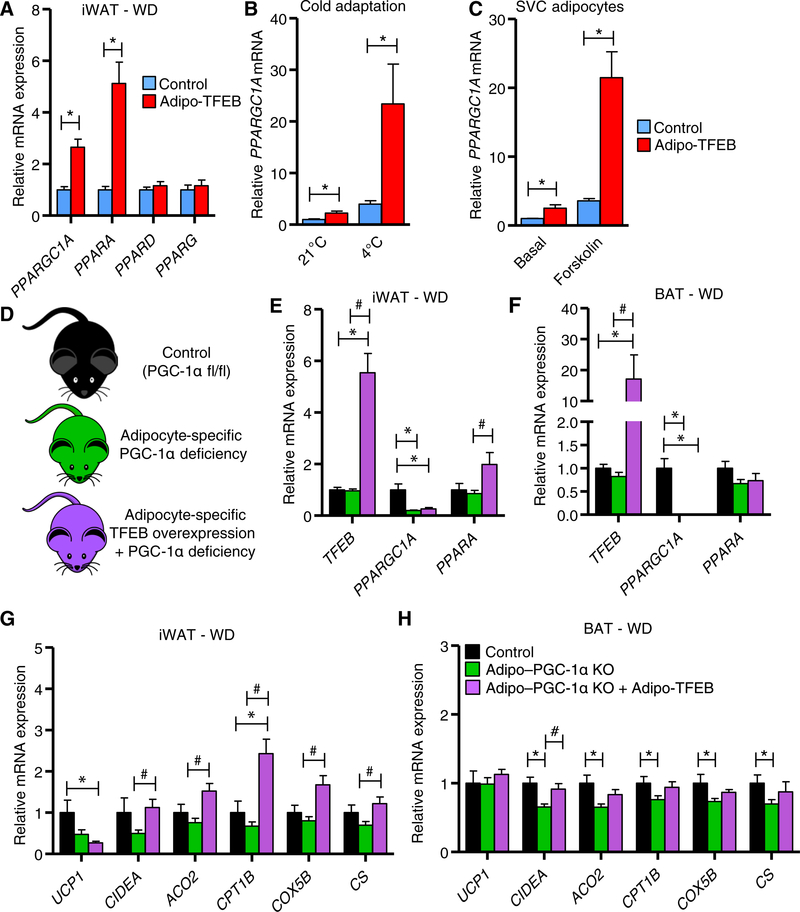
An attractive possibility for how TFEB might target genes involved in adipose tissue browning is through its established ability to target several members of the PPAR–PGC-1 family of transcription factors and transcriptional coactivators (4, 8, 17). This family of genes mediates adipose tissue browning through the coordinated induction of UCP1 and other mitochondrial and lipid oxidation genes in adipocytes (18). Thus, we assessed mRNA expression of this family of genes and observed increased expression of PPARGC1A and PPARA but not PPARD or PPARG with TFEB overexpression in iWAT from WD-fed mice (Fig. 6A). PPARGC1A expression was also increased in iWAT from chow-fed mice housed at room temperature and further increased synergistically by cold temperature (Fig. 6B). Furthermore, PPARGC1A expression was increased in a cell-autonomous manner in untreated SVC adipocytes or those treated with forskolin (Fig. 6C). PPARA expression was also induced in the iWAT of chow-fed mice (fig. S6A) and in SVC adipocytes (fig. S6B) but not in BAT (fig. S6C). Last, PPARGC1A mRNA was still potently induced by TFEB overexpression under thermoneutral conditions in iWAT (fig. S6D) but not in BAT (fig. S6E).
Fig. 6. TFEB drives PGC-1α, and PGC-1α deficiency limits TFEB-induced browning.
(A) Transcriptional characterization of PPARGC1A and PPAR isoforms in iWAT (n = 9 control and 7 Adipo-TFEB female mice fed a Western diet for 4 months). (B) iWAT PPARGC1A mRNA in chow-fed mice with or without cold adaptation (n = 6 control and 5 Adipo-TFEB for 21°C and n = 8 control and 6 Adipo-TFEB for 4°C 3-month-old male mice). (C) PPARGC1A mRNA in differentiated primary iWAT SVC adipocytes treated with vehicle or forskolin (10 μM) (n = 3 biological replicates for each group and representative of at least two independent experiments). (D) Experimental strategy to test whether TFEB-induced transcriptional changes are PGC-1α dependent. (E and F) mRNA expression of TFEB, PPARGC1A, and PPARA in iWAT and BAT [n = 5 control, 16 Adipo–PGC-1α KO (knockout), and 9 Adipo–PGC-1α KO + Adipo-TFEB female mice fed a Western diet for 4 months]. (G and H) Mitochondrial and lipid oxidation gene expression in iWAT and BAT (n = 5 control, 16 Adipo–PGC-1α KO, and 9 Adipo–PGC-1α KO + Adipo-TFEB female mice fed a Western diet for 4 months). Data are presented as means ± SEM. Student’s two-tailed t test, *P < 0.05 compared to respective control for two-group comparisons. For (E) to (H), one-way ANOVA and Tukey’s multiple comparison test, *P < 0.05 compared to control, # compared to respective Adipo–PGC-1α KO.
CLEAR sites and TFEB binding have been documented for the PPARGC1A promoter (4); the PPARA promoter has not been assessed. Because PGC-1α seemed to be a strong candidate to mediate TFEB-driven browning, we sought to study whether TFEB induction of browning genes was PGC-1α dependent in vivo (Fig. 6D). Compared to control mice, adipocyte-specific knockout of PGC-1α resulted in depletion of PPARGC1A mRNA in iWAT and BAT as expected. Further, PGC-1α deficiency mostly blocked the ability of TFEB to increase PPARA expression relative to control mice (Fig. 6, E and F), suggesting that PPARA induction was at least partially downstream of PGC-1α. Adipocyte-specific PGC-1α deficiency also markedly blocked the effects of TFEB overexpression on the induction of browning genes in iWAT, especially UCP1 (Fig. 6G), although a slight PGC-1α–independent trend was still observed. Modest reductions in PGC-1α target gene expression were seen in BAT, which mostly could not be rescued with TFEB overexpression (Fig. 6H).
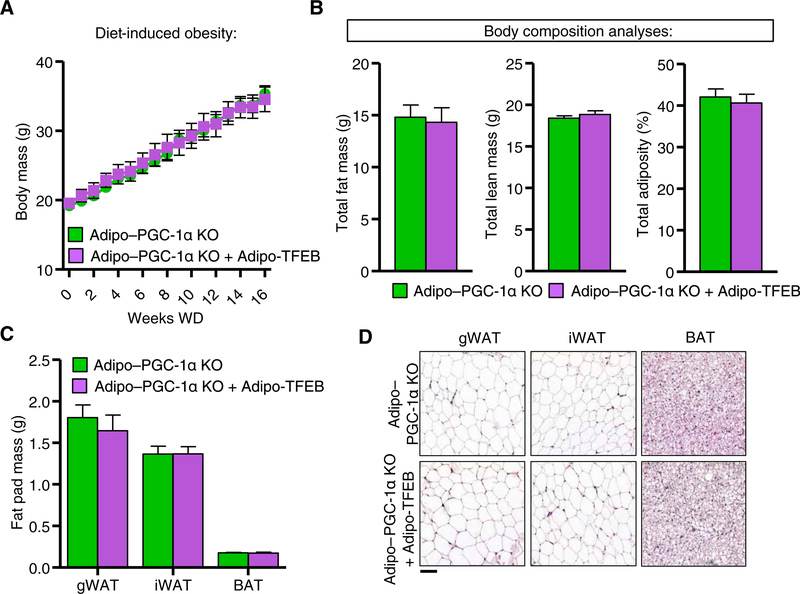
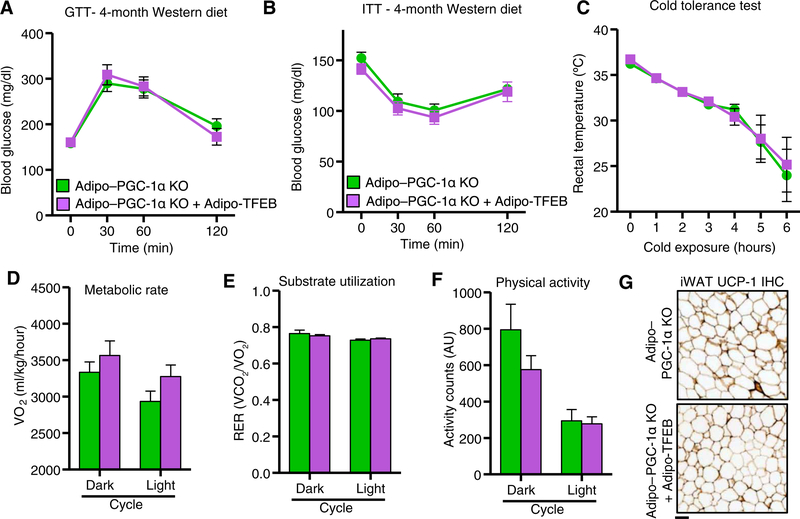
We next tested whether the physiological effects of TFEB overexpression were PGC-1α dependent. PGC-1α deficiency completely blocked the previously observed effects of TFEB overexpression on diet-induced weight gain and adiposity in both female (Fig. 7, A and B) and male (fig. S7, A and B) mice. Fat pad weights (Fig. 7C) and histological appearance of fat pads (Fig. 7D; quantified in fig. S7C) were also unchanged. Consistent with these findings, TFEB did not improve glucose tolerance (Fig. 8A) or insulin sensitivity (Fig. 8B). In the absence of PGC-1α, TFEB overexpressing mice succumbed similarly to a cold tolerance test (Fig. 8C) and had no significant changes in metabolic rate (Fig. 8D), substrate utilization (Fig. 8E), or physical activity (Fig. 8F). We also observed no immunohistochemical evidence of beige adipocytes (Fig. 8G and fig. S7D).
Fig. 7. TFEB requires PGC-1α for protection against diet-induced obesity.
Analyses in female mice fed a Western diet for 4 months. (A) Body mass (n = 19 Adipo–PGC-1α KO and 11 Adipo–PGC-1α KO + Adipo-TFEB mice). (B) Total fat mass, lean mass, and total adiposity (n = 16 Adipo–PGC-1α KO and 9 Adipo–PGC-1α KO + Adipo-TFEB mice). (C) Fat pad masses upon sacrifice (n = 16 Adipo–PGC-1α KO and 9 Adipo-PGC-1α KO + Adipo-TFEB mice). (D) Representative H&E staining of gWAT, iWAT, and BAT (n = 6 Adipo–PGC-1α KO and 6 Adipo–PGC-1α KO + Adipo-TFEB mice). Scale bar, 100 μm. Data are presented as means ± SEM. Student’s two-tailed t test, *P < 0.05.
Fig. 8. Physiological metabolic effects of TFEB overexpression are PGC-1α dependent.
(A) Glucose tolerance test (GTT) (n = 10 Adipo–PGC-1α KO and 9 Adipo–PGC-1α KO + Adipo-TFEB male mice fed a Western diet for 4 months). (B) Insulin tolerance test (n = 10 Adipo–PGC-1α KO and 8 Adipo–PGC-1α KO + Adipo-TFEB male mice fed a Western diet for 4 months). (C) Core (rectal) temperatures assessed hourly during a cold tolerance test at 4°C (n = 7 Adipo–PGC-1α KO and 5 Adipo–PGC-1α KO + Adipo-TFEB 6-month-old male mice fed a chow diet). (D) Metabolic cage analyses averaged over dark (active) and light (inactive) cycle (n = 8 Adipo–PGC-1α KO and 8 Adipo-PGC-1α KO + Adipo-TFEB female mice fed a Western diet for 4 months): oxygen consumption. (E) Respiratory exchange ratio. (F) Physical activity. (G) Representative iWAT UCP-1 immunohistochemistry (IHC) from n = 6 Adipo–PGC-1α KO and 6 Adipo–PGC-1α KO + Adipo-TFEB female mice fed a Western diet. Scale bar, 100 μm. Data are presented as means ± SEM. Student’s two-tailed t test, *P < 0.05.
DISCUSSION
In this study, we provide evidence that the transcription factor TFEB can physiologically regulate adipose tissue to protect against diet-induced metabolic dysfunction. Using a murine model of adipocyte-specific TFEB overexpression, we demonstrated that TFEB potently reduced diet-induced weight gain and adiposity. These reductions in adiposity translated to multiple beneficial metabolic consequences including improved glucose tolerance and insulin sensitivity along with reduced hepatosteatosis. Physiologically, leanness in these mice was driven by an increase in metabolic rate without alterations in physical activity or food intake. To mechanistically explain these findings, we characterized adipose tissue for both classic autophagy-lysosome targets of TFEB, along with markers of adipose tissue browning that could explain differences in metabolic rate and adiposity. Unexpectedly, TFEB had minimal functional effects on the autophagy-lysosome system in adipocytes yet was able to markedly induce browning of WAT and improve cold tolerance in mice. We characterized the thermogenic transcriptional coactivator PGC-1α as a key target of TFEB in adipocytes and demonstrated that TFEB-induced metabolic improvements were nearly entirely PGC-1α dependent. Overall, our results highlight beneficial consequences of TFEB function in adipose tissue and emphasize the relative importance of non–autophagy-lysosome targets in this physiological setting.
Several unanswered questions remain regarding the functions of TFEB in adipocytes. First, how is endogenous adipocyte TFEB regulated during physiological scenarios such as cold exposure, adipogenesis, fasting, or mitochondrial stress? Some precedence in other systems suggests that TFEB is a sensor of various cellular and physiological stresses (2, 3, 5), and our results hint that TFEB could be a crucial intermediate upstream of PGC-1α or other targets in adipocytes. It is unexpected that TFEB did not robustly drive the autophagy-lysosome system in adipocytes. The modest mRNA and protein level increases we observed in mice and primary cells suggest that these are legitimate TFEB targets but some other aspect may be required to truly drive autophagic flux and degradation of specific targets such as lipid droplets or mitochondria in adipose. Further, it is possible that repressive transcriptional and epigenetic mechanisms that block autophagy and lysosome gene transcription may hamper functional effects of TFEB (19, 20). Our findings seem to preclude TFEB overexpression as a reasonable model to study the functional effects of specifically enhancing adipocyte autophagy, some of which may include increased lipophagy or mitophagy (16). Perhaps overexpression of other similar transcription factors that regulate autophagy such as melanocyte-inducing transcription factor (MITF) or transcription factor E3 (TFE3) would enable the investigation of the effects of enhancing adipocyte autophagy. In addition, if TFEB were to potently induce mitophagy, then there may be adverse metabolic effects associated with excessive mitophagy-dependent mitochondrial clearance as others have observed (12, 21).
However, our findings do not rule out the possibility that endogenous TFEB regulates autophagic flux. Endogenous TFEB could serve an elegant role in transcriptionally coupling autophagy-mediated organelle turnover with PGC-1α–mediated biogenesis. One study suggests that TFEB and the related transcription factors TFE3 and MITF regulate autophagy-lysosome gene expression in a redundant fashion (5).
The analyses we performed suggested that TFEB induced PGC-1α–dependent browning in iWAT, thereby inducing leanness and increasing whole-body metabolic rate. Although the analysis and expression of energy expenditure data are controversial and difficult to give appropriate statistical power (22), we noted increases in energy expenditure in WD-fed mice and trends for an increase in chow-fed mice before weight divergence. We also noted obvious increases in cold tolerance and response to norepinephrine, which indicate an increase in thermogenic capacity. Given that food intake was not affected by adipocyte-specific TFEB overexpression, we conclude that a small increase in energy expenditure is the likely mechanism for leanness in this mouse model.
BAT is commonly held to be the dominant site of thermogenesis in mice, at least based on its high UCP-1 abundance relative to other depots (23, 24). TFEB may have functionally driven an aspect of BAT function not captured in the transcriptional targets we assessed, and it remains possible that BAT activity contributed to the increased metabolic rate, cold tolerance, and response to norepinephrine we observed. The expression of UCP1 in iWAT is likely only a small part of an overall transcriptional program relevant to thermogenic activity that includes many more mitochondrial and lipid metabolic genes. Several other groups have also begun to explore relevant mechanisms of beige fat thermogenesis, which are often independent of UCP-1 (25, 26).
Our results demonstrated that the physiological effects of adipocyte-specific TFEB overexpression depended largely on PGC-1α. As a transcriptional coactivator, PGC-1α partners with many transcription factors including PPARα, interferon regulatory factor 4, and PPARα to regulate genes involved in browning (18, 27, 28). We also noted a tendency for increased expression of browning genes driven by TFEB independently of PGC-1α. This finding is consistent with others’ observations in skeletal muscle, in which TFEB does not explicitly require PGC-1α to induce beneficial metabolic phenotypes. However, it was never specifically examined whether these effects were attenuated by PGC-1α deficiency (8). In contrast, our data suggest that the modest PGC-1α–independent transcriptional effects of TFEB are insufficient to affect physiological phenotypes in adipose tissue. Overall, TFEB appears to be a promising target for driving browning and oxidative metabolism in adipose tissue with intriguing implications for treating metabolic disease.
MATERIALS AND METHODS
Animals
Animal protocols were approved by the Washington University Animal Studies Committee. All mice used in this study were on C57BL/6J background (backcrossed at least seven generations). Mice carrying a TFEB transgene allele were as previously described (3, 4, 9). These mice were crossed with Cre-recombinase transgenic mice under the control of the adiponectin promoter to generate Adipo-TFEB mice. For studies examining mice with concurrent adipocyte-specific PGC-1α deficiency, these alleles were crossed into a homozygous PGC-1α flox background (29). TFEB transgene, Cre, and PGC-1α flox allele genotyping was performed using standard polymerase chain reaction (PCR) techniques (table S1). Mice housed in a specific pathogen–free barrier facility were weaned at 3 weeks of age to a standard mouse chow providing 6% calories as fat. All mice were housed at 21°C unless otherwise specified. For diet-induced obesity experiments, mice were fed starting at ~2 months of age with WD: 0.15% cholesterol, 42% calories as fat, and 15% calories as protein (TD 88137, Harlan). In each experiment, only samples from the same sex and similar age were compared.
Statistics
Results are expressed as mean ± SEM. All data were examined for normality using the Shapiro-Wilk test and for equal variances using an F test. Mann-Whitney U tests and Welch’s corrections, respectively, were used where appropriate. Normally distributed two-group data were compared using two-tailed unpaired t tests. Three-group data were compared using one-way analysis of variance (ANOVA) with Tukey’s post hoc comparisons.
Real-time PCR
Total RNA was extracted using the Ambion PureLink RNA Kit (Invitrogen) and reverse transcribed using the SuperScript VILO cDNA synthesis kit (Invitrogen). Real-time PCR was performed using a ViiA-7 real-time PCR system and SYBR-Select Master Mix (Applied Biosystems). Prevalidated primers spanning introns were used for amplification (table S1). Assays were performed in duplicate and normalized to ribosomal protein 36B4 mRNA levels.
Body composition and morphometric analyses
Body composition of animals was determined after 16 weeks on a WD using EchoMRI-100H (EchoMRI LLC) and presented as fat and lean mass. Total adiposity (%) was calculated as the measured fat mass portion of whole-body mass measured immediately before the body composition scan. Adipose tissue weights are presented as the sum of both fat pads. BAT was dissected of surrounding WAT before weighing and other analyses.
Adipocyte sizing and lipid content analyses
A minimum of two 20× fields per mouse were imaged in inguinal, gonadal, and brown adipose hematoxylin and eosin (H&E)–stained slides by a blinded observer at identical settings. Images were processed identically to remove background using Adobe Photoshop CS5. Adipocyte sizing analyses were performed using the Adiposoft plugin for ImageJ software. BAT lipid content was assessed by identically thresholding grayscale-converted images to match lipid area and presented as the percentage of total area.
Serum metabolic analyses
Mice were fasted for 5 hours in the morning before tail vein bleeding to collect serum. Colorimetric kit assays were used to measure glucose (TR14598, Thermo Fisher Scientific), triglycerides (TR22421, Thermo Fisher Scientific), free fatty acids (NC9517308–12, Wako Diagnostics), and cholesterol (TR13421, Thermo Fisher Scientific).
GTT and ITT
GTT and ITT were performed in mice after 2 or 4 months on a WD or at 8 to 9 weeks of age in chow-fed mice. Mice were weighed, transferred to clean cages, and fasted for 5 hours. Mice were injected with 1 g of glucose/g body mass or insulin (0.75 U/kg) for GTT and ITT, respectively. Blood glucose levels were measured immediately before injection and at 30, 60, and 120 min after injection using a glucometer and tail bleed.
Hepatic steatosis assessment
Oil Red O staining was performed on optimal cutting temperature compound-embedded liver samples as described previously (30). Lipids were extracted from the livers using a modification of the Folch method (31). Liver segments were homogenized in cold 2:1 chloroform: methanol and then centrifuged at 12000 rpm for 10 min at 4°C. A 15-μl aliquot from the lower organic phase was isolated and allowed to evaporate. Triglyceride content was assayed per the manufacturer’s protocols (TR22421, Thermo Fisher Scientific) and normalized to starting wet tissue mass.
Western blotting
Cells or tissues were lysed in a standard radioimmunoprecipitation assay lysis buffer. Standard techniques were used for protein quantification, separation, transfer, and blotting. The following primary antibodies were used: Cathepsin D (1:4000; a gift from S. Kornfeld, Washington University), Lamp-1 (1:2000; sc-19992, Santa Cruz Biotechnology), LC3 (1:1000; NB100–2220, Novus Biologicals).
Adipocyte culture studies
Stromal vascular preadipocytes from inguinal adipose tissue from ~6-week-old mice were isolated and cultured and differentiated as previously described (32). Where indicated, cells were stimulated with 10 μM forskolin (Sigma-Aldrich) for 4 hours. For autophagic flux assays, cells were starved in serum-free Hank’s balanced salt solution and treated with chloroquine (50 μM) or vehicle for the given times.
Mitophagy assay
Differentiated stromal vascular preadipocytes were fixed in 1% paraformaldehyde and stained for the mitochondrial inner membrane protein cytochrome C oxidase subunit 4 (COX4) (ab14744, Abcam) and autophagosome marker LC3 (PM036, MBL International). Confocal images were captured at ×60 magnification, and Mander’s coefficient for colocalization (the portion of COX4 that was also positive for LC3) was calculated for at least 35 cells per group taken from at least 10 different fields and 2 different slides.
Lipolysis assays
Fat pads from 8- to 10-week-old mice were excised and weighed into ~100-mg portions. Pads were then minced into <10-mg pieces and preincubated for 1 hour in Dulbecco’s modified Eagle’s medium containing 2% bovine serum albumin (BSA). Pads were then incubated in 250 μl of Krebs-Ringer HEPES buffer [125 mM NaCl, 5 mM KCl, 1.8 mM CaCl2, 2.6 mM MgSO4, and 5 mM HEPES (pH 7.2)] plus 2% BSA (fatty acid free) with or without isoproterenol (10 μM) for 2 hours at 37°C. Medium was removed and assayed for glycerol (MAK117, Sigma-Aldrich), and release was normalized to fat mass. Lysosomal acid lipase activity was assessed as previously described (3) in iWAT.
Indirect calorimetry, physical activity, and food intake
Mice were placed in metabolic cages (PhenoMaster, TSE Systems) and allowed to acclimate. Mice were tested for 24 hours for O2 consumption, CO2 production, and activity assessed as beam breaks (Systems LabMaster software v4.8.7). Data were analyzed as the average over 12-hour dark or light cycle intervals. Cumulative food intake was assessed daily in individually housed mice for 14 days total, taking into account spilled food. For analysis of norepinephrine-stimulated oxygen consumption, mice were allowed to acclimate for 3 hours in a small, (~2 liters) single-chamber system with water and chow provided. Mice were injected with norepinephrine [1 mg/kg intraperitoneally (ip)], and oxygen consumption was measured (Oxymax system, Columbus Instruments).
Immunohistochemistry
Immunohistochemical staining of inguinal adipose tissues for UCP-1 was performed using the VECTASTAIN Elite ABC-HRP Kit and UCP-1 primary antibody (1:100; UCP11-S, Alpha Diagnostics). Images were captured and analyzed by a blinded observer.
Cold tolerance tests, cold adaptation, and thermoneutrality
Mice were individually housed at 4°C in prechilled cages with minimal bedding and wire cage tops and provided ad libitum access to chow diet and water. Rectal temperatures were recorded just before cold exposure and hourly thereafter with a digital thermometer and probe (EasyView 10, Extech Instruments). For cold adaptation, mice were group-housed in prechilled cages at 4°C (four to five mice per cage) for 48 hours. For thermoneutrality experiments, mice were housed at 30°C for 2 weeks beginning at 8 weeks of age before tissue collection.
Supplementary Material
Fig. S1. WD-induced obesity in male mice.
Fig. S2. Metabolic phenotyping of Adipo-TFEB mice.
Fig. S3. Analyses of the autophagy-lysosome system and mitophagy in Adipo-TFEB mice.
Fig. S4. iWAT stromal vascular adipocyte culture model.
Fig. S5. UCP-1 expression and transcriptional responses in cold and thermoneutrality.
Fig. S6. Transcriptional response of PGC-1α and PPARα to TFEB overexpression.
Fig. S7. Additional analyses in mice with concurrent PGC-1α deficiency.
Table S1. PCR primers used in the present study.
Acknowledgments
We thank A. Ballabio (Telethon Institute of Genetics and Medicine, Italy and Baylor College of Medicine, Houston, TX) for provision of mice carrying the TFEB transgene.
Funding: This work was supported by NIH R01 HL125838 (to B.R.), NIH F31 HL132434 (to T.D.E.), the Washington University Diabetic Cardiovascular Disease Center (P30 DK020579), Veteran’s Administration (I01 BX003415), American Diabetes Association (ADA no. 1–18-IBS-029), and NIH R01 DK115867 (to I.J.L.) grants. We additionally thank David and Deborah Winston, the Washington University Adipocyte Biology and Molecular Nutrition Core (P30 DK056341), and the Diabetes Research Center (P30 DK020579) for support.
Footnotes
Competing interests: The authors declare that they have no competing interests.
Data and materials availability: All data needed to evaluate the conclusions in this paper are present in the paper or the Supplementary Materials.
REFERENCES AND NOTES
- 1.Bartelt A, Heeren J, Adipose tissue browning and metabolic health. Nat. Rev. Endocrinol. 10, 24–36 (2014). [DOI] [PubMed] [Google Scholar]
- 2.Martina JA, Diab HI, Brady OA, Puertollano R, TFEB and TFE3 are novel components of the integrated stress response. EMBO J. 35, 479–495 (2016). [DOI] [PMC free article] [PubMed] [Google Scholar]
- 3.Emanuel R, Sergin I, Bhattacharya S, Turner JN, Epelman S, Settembre C, Diwan A, Ballabio A, Razani B, Induction of lysosomal biogenesis in atherosclerotic macrophages can rescue lipid-induced lysosomal dysfunction and downstream sequelae. Arterioscler. Thromb. Vasc. Biol. 34, 1942–1952 (2014). [DOI] [PMC free article] [PubMed] [Google Scholar]
- 4.Settembre C, de Cegli R, Mansueto G, Saha PK, Vetrini F, Visvikis O, Huynh T, Carissimo A, Palmer D, Jürgen Klisch T, Wollenberg AC, di Bernardo D, Chan L, Irazoqui JE, Ballabio A, TFEB controls cellular lipid metabolism through a starvation-induced autoregulatory loop. Nat. Cell Biol. 15, 647–658 (2013). [DOI] [PMC free article] [PubMed] [Google Scholar]
- 5.Nezich CL, Wang C, Fogel AI, Youle RJ, MiT/TFE transcription factors are activated during mitophagy downstream of Parkin and Atg5. J. Cell Biol. 210, 435–450 (2015). [DOI] [PMC free article] [PubMed] [Google Scholar]
- 6.Settembre C, Malta CD, Polito VA, Arencibia MG, Vetrini F, Erdin S, Erdin SU, Huynh T, Medina D, Colella P, Sardiello M, Rubinsztein DC, Ballabio A, TFEB links autophagy to lysosomal biogenesis. Science 332, 1429–1433 (2011). [DOI] [PMC free article] [PubMed] [Google Scholar]
- 7.Pastore N, Brady OA, Diab HI, Martina JA, Sun L, Huynh T, Lim J-A, Zare H, Raben N, Ballabio A, Puertollano R, TFEB and TFE3 cooperate in the regulation of the innate immune response in activated macrophages. Autophagy 12, 1240–1258 (2016). [DOI] [PMC free article] [PubMed] [Google Scholar]
- 8.Mansueto G, Armani A, Viscomi C, D’Orsi L, de Cegli R, Polishchuk EV, Lamperti C, Di Meo I, Romanello V, Marchet S, Saha PK, Zong H, Blaauw B, Solagna F, Tezze C, Grumati P, Bonaldo P, Pessin JE, Zeviani M, Sandri M, Ballabio A, Transcription factor EB controls metabolic flexibility during exercise. Cell Metab. 25, 182–196 (2017). [DOI] [PMC free article] [PubMed] [Google Scholar]
- 9.Sergin I, Evans TD, Zhang X, Bhattacharya S, Stokes CJ, Song E, Ali S, Dehestani B, Holloway KB, Micevych PS, Javaheri A, Crowley JR, Ballabio A, Schilling JD, Epelman S, Weihl CC, Diwan A, Fan D, Zayed MA, Razani B, Exploiting macrophage autophagy-lysosomal biogenesis as a therapy for atherosclerosis. Nat. Commun. 8, 15750 (2017). [DOI] [PMC free article] [PubMed] [Google Scholar]
- 10.Fang L, Hodge J, Saaoud F, Wang J, Iwanowycz S, Wang Y, Hui Y, Evans TD, Razani B, Fan D, Transcriptional factor EB regulates macrophage polarization in the tumor microenvironment. Oncoimmunology 6, e1312042 (2017). [DOI] [PMC free article] [PubMed] [Google Scholar]
- 11.Tsunemi T, Ashe TD, Morrison BE, Soriano KR, Au J, Roque RAV, Lazarowski ER, Damian VA, Masliah E, La Spada AR, PGC-1α rescues Huntington’s disease proteotoxicity by preventing oxidative stress and promoting TFEB function. Sci. Transl. Med. 4, 142ra97 (2012). [DOI] [PMC free article] [PubMed] [Google Scholar]
- 12.Altshuler-Keylin S, Shinoda K, Hasegawa Y, Ikeda K, Hong H, Kang Q, Yang Y, Perera RM, Debnath J, Kajimura S, Beige adipocyte maintenance is regulated by autophagy-induced mitochondrial clearance. Cell Metab., 402–419 (2016). [DOI] [PMC free article] [PubMed] [Google Scholar]
- 13.Zhang Y, Goldman S, Baerga R, Zhao Y, Komatsu M, Jin S, Adipose-specific deletion of autophagy-related gene 7 (atg7) in mice reveals a role in adipogenesis. Proc. Natl. Acad. Sci. U.S.A. 106, 19860–19865 (2009). [DOI] [PMC free article] [PubMed] [Google Scholar]
- 14.Seale P, Transcriptional regulatory circuits controlling brown fat development and activation. Diabetes 64, 2369–2375 (2015). [DOI] [PMC free article] [PubMed] [Google Scholar]
- 15.Zhang X, Evans TD, Jeong S-J, Razani B, Classical and alternative roles for autophagy in lipid metabolism. Curr. Opin. Lipidol. 29, 203–211 (2018). [DOI] [PMC free article] [PubMed] [Google Scholar]
- 16.Evans TD, Sergin I, Zhang X, Razani B, Target acquired: Selective autophagy in cardiometabolic disease. Sci. Signal. 10, eaag2298 (2017). [DOI] [PMC free article] [PubMed] [Google Scholar]
- 17.Salma N, Song JS, Kawakami A, Devi SP, Khaled M, Cacicedo JM, Fisher DE, Tfe3 and Tfeb transcriptionally regulate peroxisome proliferator-acitvated receptor y2 expression in adipocytes and mediate adiponectin and glucose levels in mice. Proc. Natl. Acad. Sci. U.S.A. 37, e00608–16 (2017). [DOI] [PMC free article] [PubMed] [Google Scholar]
- 18.Puigserver P, Wu Z, Park CW, Graves R, Wright M, Spiegelman BM, A cold-inducible coactivator of nuclear receptors linked to adaptive thermogenesis. Cell 92, 829–839 (1998). [DOI] [PubMed] [Google Scholar]
- 19.Seok S, Fu T, Choi S-E, Li Y, Zhu R, Kumar S, Sun X, Yoon G, Kang Y, Zhong W, Ma J, Kemper B, Kemper JK, Transcriptional regulation of autophagy by an FXR-CREB axis. Nature 516, 108–111 (2014). [DOI] [PMC free article] [PubMed] [Google Scholar]
- 20.Byun S, Kim Y-C, Zhang Y, Kong B, Guo G, Sadoshima J, Ma J, Kemper B, Kemper JK, A postprandial FGF19-SHP-LSD1 regulatory axis mediates epigenetic repression of hepatic autophagy. EMBO J. 36, 1755–1769 (2017). [DOI] [PMC free article] [PubMed] [Google Scholar]
- 21.Lu X, Altshuler-Keylin S, Wang Q, Chen Y, Sponton CH, Ikeda K, Maretich P, Yoneshiro T, Kajimura S, Mitophagy controls beige adipocyte maintenance through a Parkin-dependent and UCP1-independent mechanism. Sci. Signal. 11, eaap8526 (2018). [DOI] [PMC free article] [PubMed] [Google Scholar]
- 22.Meyer CW, Reitmeir P, Tschöp MH, Exploration of energy metabolism in the mouse using indirect calorimetry: Measurement of daily energy expenditure (DEE) and basal metabolic rate (BMR). Curr. Protoc. Mouse Biol. 5, 205–222 (2015). [DOI] [PubMed] [Google Scholar]
- 23.Shabalina I, Petrovic N, de Jong JMA, Kalinovich AV, Cannon B, Nedergaard J, UCP1 in brite/beige adipose tissue mitochondria is functionally thermogenic. Cell Rep. 5, 1196–1203 (2013). [DOI] [PubMed] [Google Scholar]
- 24.Kalinovich AV, de Jong JMA, Cannon B, Nedergaard J, UCP1 in adipose tissues: Two steps to full browning. Biochimie 134, 127–137 (2017). [DOI] [PubMed] [Google Scholar]
- 25.Ikeda K, Kang Q, Yoneshiro T, Camporez JP, Maki H, Homma M, Shinoda K, Chen Y, Lu X, Maretich P, Tajima K, Ajuwon KM, Soga T, Kajimura S, UCP1-independent signaling involving SERCA2b-mediated calcium cycling regulates beige fat thermogenesis and systemic glucose homeostasis. Nat. Med. 23, 1454–1465 (2017). [DOI] [PMC free article] [PubMed] [Google Scholar]
- 26.Bertholet AM, Kazak L, Chouchani ET, Bogaczyńska MG, Paranjpe I, Wainwright GL, Bétourné A, Kajimura S, Spiegelman BM, Kirichok Y, Mitochondrial patch clamp of beige adipocytes reveals UCP1-positive and UCP1-negative cells both exhibiting futile creatine cycling. Cell Metab. 25, 811–822.e4 (2017). [DOI] [PMC free article] [PubMed] [Google Scholar]
- 27.Barberá MJ, Schlüter A, Pedraza N, Iglesias R, Villarroya F, Giralt M, Peroxisome proliferator-activated receptor α activates transcription of the brown fat uncoupling protein-1 gene. J. Biol. Chem. 276, 1486–1493 (2001). [DOI] [PubMed] [Google Scholar]
- 28.Kong X, Banks A, Liu T, Kazak L, Rao RR, Cohen P, Wang X, Yu S, Lo JC, Tseng Y-H, Cypess AM, Xue R, Kleiner S, Kang S, Spiegelman BM, Rosen ED, IRF4 is a key thermogenic transcriptional partner of PGC-1α. Cell 158, 69–83 (2014). [DOI] [PMC free article] [PubMed] [Google Scholar]
- 29.Kleiner S, Mepani RJ, Laznik D, Ye L, Jurczak MJ, Jornayvaz FR, Estall JL, Chatterjee Bhowmick D, Shulman GI, Spiegelman BM, Development of insulin resistance in mice lacking PGC-1α in adipose tissues. Proc. Natl. Acad. Sci. U.S.A. 109, 9635–9640 (2012). [DOI] [PMC free article] [PubMed] [Google Scholar]
- 30.Razani B, Feng C, Coleman T, Emanuel R, Wen H, Hwang S, Ting JP, Virgin HW, Kastan MB, Semenkovich CF, Autophagy links inflammasomes to atherosclerotic progression. Cell Metab. 15, 534–544 (2012). [DOI] [PMC free article] [PubMed] [Google Scholar]
- 31.Folch J, Lees M, Stanley GHS, A simple method for the isolation and purification of total lipides from animal tissues. J. Biol. Chem. 226, 497–509 (1957). [PubMed] [Google Scholar]
- 32.Lodhi IJ, Dean JM, He A, Park H, Tan M, Feng C, Song H, Hsu F-F, Semenkovich CF, PexRAP inhibits PRDM16-mediated thermogenic gene expression. Cell Rep. 20, 2766–2774 (2017). [DOI] [PMC free article] [PubMed] [Google Scholar]
Associated Data
This section collects any data citations, data availability statements, or supplementary materials included in this article.
Supplementary Materials
Fig. S1. WD-induced obesity in male mice.
Fig. S2. Metabolic phenotyping of Adipo-TFEB mice.
Fig. S3. Analyses of the autophagy-lysosome system and mitophagy in Adipo-TFEB mice.
Fig. S4. iWAT stromal vascular adipocyte culture model.
Fig. S5. UCP-1 expression and transcriptional responses in cold and thermoneutrality.
Fig. S6. Transcriptional response of PGC-1α and PPARα to TFEB overexpression.
Fig. S7. Additional analyses in mice with concurrent PGC-1α deficiency.
Table S1. PCR primers used in the present study.


