Abstract
PURPOSE
Variation in contouring quality by radiation oncologists is common and can have significant clinical consequences. Image-based guidelines can improve contour accuracy but are underused. We sought to develop a free, online, easily accessible contouring resource that allows users to scroll through cases with 3-dimensional images and access relevant evidence-based contouring information.
MATERIALS AND METHODS
eContour (http://econtour.org) was developed using modern Web technologies, primarily HTML5, Python, and JavaScript, to display JPEGs generated from DICOM files from real patient cases. The viewer has standard tools for image manipulation as well as toggling of contours and overlayed images and radiation dose distributions. Brief written content references published guidelines for contour delineation. Mixpanel software was used to collect Web page usage statistics.
RESULTS
In the first 3 years of operation (March 8, 2016 to March 7, 2019), a total of 13,391 users from 128 countries registered on the Web site, including 2,358 physicians from the United States. High-frequency users were more likely to be physicians (P < .001) and from the United States (P < .001). In one 6-month period, there were 68,642 individual case page views, with head-and-neck the most commonly viewed disease site (32%). Users who accessed a head-and-neck case were more likely to be high-frequency users, and 67% of repeat users accessed the same case more than once.
CONCLUSION
The large, diverse user base and steady growth in Web site traffic over the first 3 years of eContour demonstrate its strong potential to address the unmet need for dissemination and use of evidence-based contouring information at the point of care.
INTRODUCTION
Safe and effective radiation therapy relies on precise delineation of the area to be targeted by radiation (gross tumor and areas of potential microscopic spread) as well as nearby organs at risk, which should be avoided to minimize toxicity. This process is commonly referred to as contouring or segmentation. Unfortunately, studies have shown a high degree of interobserver variability in contouring by radiation oncologists across cancer types throughout the body.1,2 Furthermore, evidence from clinical trials suggests a link between poor contouring quality—a common cause of protocol deviations—and inferior patient outcomes.3,4
Efforts to reduce variation in contouring have included atlases developed for clinical trials and guideline publications for routine practice.5-11 Such efforts have been demonstrated to both reduce variation12 and predict clinical outcomes,13 when used. A recent review concluded that strict use of reference guidelines is advisable for both research and routine patient care.1 However, historically, clinical practice guidelines have proven difficult to translate into clinical practice due in part to poor modes of delivery and infrequent use.1,15 In radiation oncology, 3-dimensional (3D) image-based atlases are most often published in journals and shared via a PDF. A recent survey of practicing radiation oncologists demonstrated that lack of awareness of guideline publication was a major barrier to use, with generalists correctly recognizing the existence of guidelines only 42% of the time.17
We thus sought to develop an image-based reference tool to assist with clinical decision making for contouring in radiation oncology that could be easily accessed at the point of care. We modeled this effort after UpToDate, a Web site that synthesizes large amounts of medical information into a Web-based clinically useful format and has been shown to improve patient outcomes.18,19 The main goals of the project therefore included:
CONTEXT
Key Objective
The goal of this study was to describe the development and real-world use of a free, online 3-dimensional image-based contouring reference for radiation oncology professionals.
Knowledge Generated
In the first 3 years, 13,391 users from 128 countries registered on eContour.org, including 2,358 radiation oncology resident or practicing physicians from the United States, who are more likely to be high-frequency users. There was increased usage over time, particularly among high-frequency users. On a 6-month subset analysis, 68,642 case pages were viewed, with head-and-neck the most commonly visited disease site (32% of all case views).
Relevance
Prior research has found that contouring guidelines can improve contour quality but are poorly disseminated and difficult to access at the point of care. The large, diverse user base and steadily increasing rate of access to contouring information among radiation oncology professionals in the current study suggest this Web-based interactive platform is helping to fill this gap.
The reference should allow users to scroll through patient imaging in 3D.17
The cases should be accessible and easy to navigate with few clicks, no downloads, and minimal text.
Key elements of evidence-based contouring guidelines should be highlighted.
The reference should be comprehensive, incorporating expert contours of multiple example cases that represent various common clinical presentations.
The reference should be free and online to maximize accessibility.
The resulting contouring resource is called eContour (accessible for free at econtour.org). Before public release, this Web site was tested in a randomized controlled trial among resident physicians and was found to improve contour accuracy.20
Development of an effective contouring resource does not ensure that it will reach the target audience.1,15,16 Analyzing real world usage data is the first step to determining whether this new platform addresses the unmet clinical need. Correlating characteristics of users and information content with frequency of use can provide additional insights into contouring practices and potential barriers and facilitators to contouring information decision support. We thus sought to assess the dissemination and usage of the eContour platform. Here we report usage statistics for the first 3 years of operation.
MATERIALS AND METHODS
Content Development
Reference cases were selected with a focus on disease sites where consensus guidelines exist, as well as less common sites that are still routinely tested on oral board certification examinations. Representative teaching cases were selected by a disease site expert, defined as an individual who specializes in < 3 disease sites and practices in an academic setting. Expert peer review was performed by ≥ 1 other disease site expert before publishing the case on the Web site. Each case references ≥ 1 consensus guideline, clinical trial protocol, or publication demonstrating patient clinical outcomes, with the presented contours designed to reflect best available contouring guidance. The leaders of the expert team for each disease site are listed publicly on the eContour Web site on the “About” page.
Platform and Privacy
We developed eContour using modern Web technologies, primarily HTML5, Python, and JavaScript. To read, manipulate, and display DICOM images, we used several open source libraries, including Pydicom, Insight Segmentation and Registration Toolkit (ITK), CornerstoneJS, and CornerstoneToolsJS. For each case, the simulation computed tomography (CT) scan and any fused diagnostic images were de-identified and anonymized under a new medical record number to enable editing and storage on a secure Health Insurance Portability and Accountability Act–compliant server (MIMcloud; MIM Software, Cleveland, OH). Cornerstone is an open-source Web-based medical imaging platform that supports the HTML5 Canvas. Hence, we could make it work seamlessly to provide standard DICOM functionality, including scrolling through axial images, zooming, panning, and toggling of individual contours using the HTML5 Canvas Application Programmer Interface. We also used the HTML5 Canvas Application Programmer Interface to display overlays, such as radiation dose and diagnostic imaging (such as positron emission tomography/CT, magnetic resonance imaging), on top of the DICOM images. For determining the optimal Window/Level values on the overlays, we used SimpleITK (a simplified, open-source interface built on top of ITK) with Python. We also used SimpleITK with Python to convert the contour coordinates from the DICOM file into pixels to display the contours (and corresponding DICOM images converted into JPEG format, without any visual or written patient identifiers) accurately on top of an HTML5 Canvas of size 512 pixels × 512 pixels. This project has been certified as exempt by the Institutional Review Board at the University of California San Diego.
Web Site Design
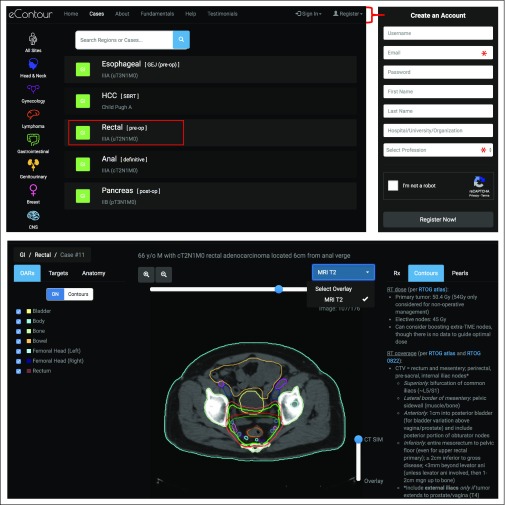
Figure 1 shows an overview of the Web site design and user experience when accessing cases. The main Web site page and list of available cases are publicly accessible; however, opening specific case images requires the user to register and log in (which is free). At the time of registration, users are asked for their name, e-mail address, organization, and profession (radiation oncologist, resident physician, medical student, medical physicist, dosimetrist, radiation therapist, other).
FIG 1.
Overview of the eContour site layout, including the case index page, registration process, and example case page (Stage IIIA Rectal Cancer).
The guiding principle of the design framework was to ensure the layout addressed deficiencies in currently available resources (as discussed above), including access to 3D imaging, easy navigability, and quick access to evidence-based reference information. A focus group was conducted with 10 radiation oncology residents in October 2015, which assisted with refinements to help meet these goals. The Web site also provides contact information for technical support and encourages user feedback.
The center of each case page is the patient’s CT simulation, which loads automatically and includes all standard DICOM functionality as mentioned above, including scroll, zoom, and pan. The case contains contours of gross tumor and areas of possible microscopic spread of disease (called target volumes) as well as organs at risk. When appropriate, cases also include contours of relevant radiographic anatomy. When fused diagnostic imaging is recommended for contour delineation, this information is included with a slider bar to toggle between the simulation CT image and fused image. The right one-third of the screen displays additional information about the radiation dose and treatment technique for the presented case (Rx), high-yield information from relevant contouring guidelines with a hyperlink to primary publications (Contours), and any additional Pearls for safe and effective radiation treatment planning. Each case has a unique URL to facilitate content sharing and reference.
Content Release
When eContour originally launched, 19 cases were available from 2 disease sites (head-and-neck [H&N] and lymphoma). Cases and new disease sites were added periodically throughout the first 3 years of operation (gynecologic [GYN] and GI in April 2016, genitourinary [GU] in June 2016, breast in February 2017, CNS in August 2018, thoracic in September 2018). There were a total of 47 cases available across 8 disease sites by the end of the 3-year period.
User Recruitment
The dissemination of the eContour Web site has been an organic process relying on invited presentations at national conferences and communication between individuals including through social media. A complete listing of dissemination events is included in the Data Supplement. A small number of residents (n = 24) were recruited as part of the previously published randomized controlled trial.20 Approximately 350 radiation professionals were introduced to the Web site during contouring workshops by the American College of Radiation Oncology17 and the Russian Society of Clinical Oncology.21
Usage Statistics
Web site traffic was analyzed using Mixpanel software (San Francisco, CA). This program tracks user activity, including the number and date of Web site sign-ins, geographic location, and browsers/devices used for access by each user. Data on user profession (as obtained at registration) was stored in the internal Web site database and cross-referenced with Mixpanel on the basis of the user ID. Tracking views of individual case pages first became available in September 2018, allowing subset analysis of the latest 6 months of available data; no additional content was released during this time. Statistical testing was conducted with χ2 testing for comparison of categorical data (eg, proportions of users in different groups), analysis of variance for comparison of continuous data (eg, number of sign-ins), and the Wilcoxon signed-rank test to compare sign-ins over time between cohorts.
RESULTS
The eContour Web site launched publicly on March 8, 2016. In the first 3 years of operation (March 8, 2016 to March 7, 2019), a total of 13,391 users registered on the Web site.
User Profession
User profession is available for 99.7% of registered users. The majority of registered users (63%) report their profession as that of a physician, including 6,673 practicing radiation oncologists (50%) and 1,687 resident physicians (13%). This is followed by medical dosimetrists (10%), medical physicists (9%), radiation therapists (8%), and medical students (6%). There are 2,358 users who report being physicians who are geographically located in the United States.
Geography
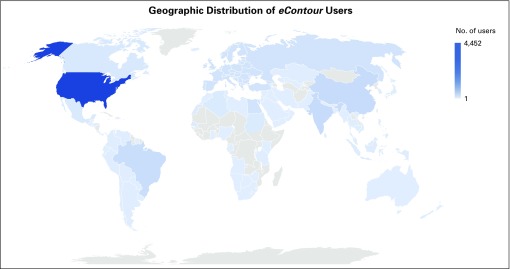
Geographic location is available for 91% of all registered users. Users represented 128 countries, as shown in Figure 2, with the largest cohort from the United States (33%). US users were classified by geographic region according to the US census definitions,22 with 1,049 (24%) users from the Midwest, 884 (20%) from the Northeast, 1,477 (34%) from the South, and 986 (23%) from the West. Other countries with > 500 registered users included India, China, Spain, and Brazil. A complete list of represented countries and user numbers is included in the Data Supplement.
FIG 2.
Global distribution of eContour user base.
Frequency of Usage
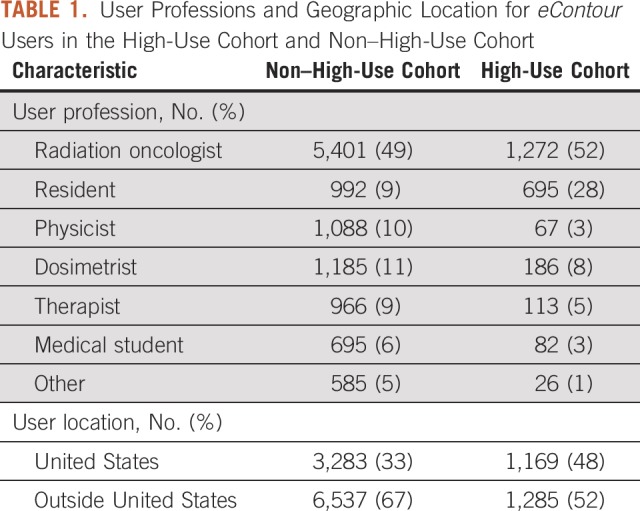
Of the 13,391 registered users, 7,483 (55%) signed in at least twice during the analysis period (March 8, 2016 to March 7, 2019), representing the rate of repeat use—a common Web site statistic.23 A high-use cohort was defined as the top 20% of all users,24 who in our cohort signed in ≥ 8 times during the study period. The geographic and professional breakdown of these cohorts is shown in Table 1. The high-use cohort had a significantly higher proportion of users from the United States (48% v 33%; P < .001). Physicians also make up a greater proportion of the high-use cohort compared with the non–high-use cohort (80% v 58%; P < .001).
TABLE 1.
User Professions and Geographic Location for eContour Users in the High-Use Cohort and Non–High-Use Cohort
Devices and Browsers
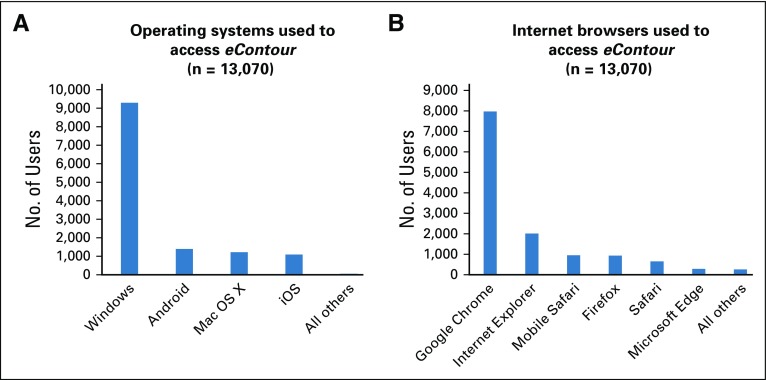
The Web site was most frequently accessed via the Windows Operating System (71%). The remaining users accessed the Web site via Mac OS or mobile devices (Fig 3A). A variety of internet browsers were used to access the site, with the most common being Google Chrome (Fig 3B).
FIG 3.
(A) Operating systems used to access eContour. (B) Browsers used to access eContour.
Case Views
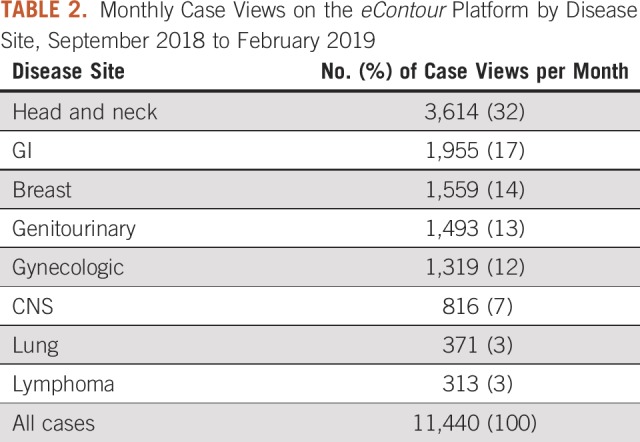
Within the 6-month period during which detailed case view data are available, there were a total of 68,642 unique case views. The most commonly viewed disease site was H&N (32% of all case views) followed by GI, breast, GU, and GYN cancer. Monthly case views for the available disease sites are shown in Table 2. The majority of visitors (64%) viewed ≥ 1 H&N case during the study period. Users from the high-use cohort were more likely to have visited an H&N case (P < .001). The most commonly viewed individual cases were preoperative rectal (http://econtour.org/cases/11), intermediate-risk prostate (http://econtour.org/cases/34), and breast regional nodal radiation (http://econtour.org/cases/74).
TABLE 2.
Monthly Case Views on the eContour Platform by Disease Site, September 2018 to February 2019
The majority of case views (64%) were from the high-use cohort. The median number of cases viewed was 6 (interquartile range [IQR], 2-15) for all users and 13 (IQR, 6-27) for the high-use cohort.
During the 6-month period, 5,278 users visited ≥ 1 case, and 3,554 (67%) of those users visited the same case more than once. The high-use cohort was more likely to visit the same case repeatedly (P < .001).
Usage Over Time
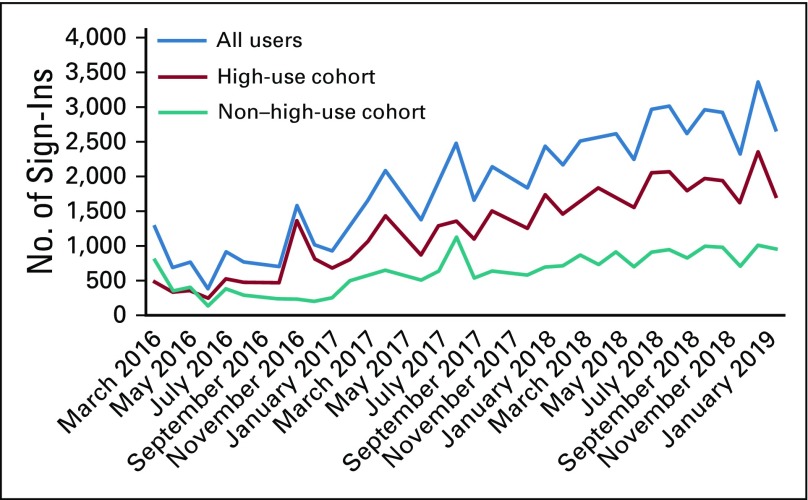
There was a gradual increase in the number of sign-ins per month seen throughout the study period (Fig 4). The mean number of monthly sign-ins increased from 924 in year 1, to 1,958 in year 2, to 2,735 in year 3 (P < .001). Monthly sign-ins increased significantly faster among the high-use cohort than the non–high-use cohort during the study period (P < .001; Fig 4).
FIG 4.
Total user sign-ins to eContour per month, March 2016 to February 2019.
DISCUSSION
This study demonstrates significant real-world use of eContour, which aims to overcome barriers to accessing evidence-based contouring information at the point of care in routine clinical practice. eContour has previously been demonstrated to improve contour accuracy and knowledge of radiographic anatomy among radiation oncology residents,20 as well as knowledge of radiation adverse effects among medical students.25 However, a key challenge to improving contouring quality involves dissemination and use by the target audience.15-17 Web site use has grown significantly over the 3 years since public launch, both in number of users and the rate of individual user sign-ins per month.
The total user base is large, with 13,391 users. With 2,358 US radiation oncologist and resident users and an estimated 4,450 practicing radiation oncologists in the United States,26 we estimate that approximately 50% of US radiation oncologists are registered users. US users reflect a very similar geographic distribution to that of radiation oncologists reported recently in the 2017 ASTRO Workforce Survey.26a Users are also diverse, representing 128 countries, which likely reflects the increasing need internationally for tools to assist with safe and effective radiation treatment planning.27 Physicians were more likely to be in the top 20% of users, which is expected because the site was designed primarily for their use. However, a large number of dosimetrists and physicists are also using the Web site, which reflects their increasing role in contouring normal organs and performing contour quality assurance.
The global reach of eContour was demonstrated in a recent survey of Russian radiation oncologists, which found that 81% of respondents (n = 80) who were familiar with eContour used it in their daily practice.21 In our study, the high-use cohort had a significantly greater proportion of users from the United States. This may reflect that the site is presented in English and there is good internet access nationwide, as language and internet reliability were cited as obstacles to use of eContour internationally.21
Our data show that the majority of visits and visit growth are driven by returning visits from the high-use cohort (Fig 4), which is a phenomenon commonly observed in Web site research.24 It is important to note that in the subset analysis of case views, nearly two-thirds of users visited the same case more than once during the 6-month period. This suggests that users find the information presented relevant and easily accessible for additional reference.
The total number of case views is large (11,440 per month) and comparable to recent publication of a Web site designed for use by medical oncologists, which reported 63,000 visits over a 7-month period (also approximately 2 years after site launch).28 This demonstrates substantial uptake despite radiation oncology representing a much smaller target audience than medical oncology. We hypothesized that cases of H&N cancer, a frequent site of protocol deviations,3 would be frequently visited. As expected, 32% of all case views were for H&N, 64% of users visited ≥ 1 H&N case, and high-frequency users were even more likely to have visited an H&N case.
Nearly 1 out of every 5 users accessed eContour via a mobile operating system (Fig 3A). Mobile usage is particularly encouraging, as recent research shows that mobile phones and applications are becoming a common resource at the point of care29,30 and may help improve adherence to guidelines.31
The online, freely accessible nature of eContour is in contrast with most other currently available contouring resources. These include live contouring sessions held at conferences32 and webinars,33 which offer useful interactive contouring opportunities but can be costly and do not serve as an on-demand reference for providers. One eLearning program called EduMod34 enables users to review content independently online but requires a subscription fee. Finally, mobile apps have been developed, such as RadOnc Reference and Radonculous,35 but they have limited content and geographic availability.
There are several limitations to this user base analysis. We collected only limited information about users at registration, and there is no verification process required to confirm accuracy of this information. Although users can update their profile, this is not mandatory, and therefore the number of resident users may be an overestimate; year in residency was recently added to enable automatic conversion to practicing physician. Data regarding time spent on the site by registered users are lacking; a system to collect these data is now under development. Finally, these data do not demonstrate that site viewership is correlated with change in practice or clinical outcomes. eContour use has previously been demonstrated to improve contouring in a randomized controlled trial among resident physicians,20 although Web site page views may not reflect this same level of engagement. Ongoing work, including user self-report as well as real-world patient case contour review, will further elucidate practice change in response to eContour use.
There are many potential future directions for this Web-based imaging platform, given the established basic reference viewer functionality and user base described in this analysis. Since the impact of guidelines on practice change is often limited by requiring the physician to recognize their knowledge deficiencies, studies are planned to test the efficacy of various implementation strategies (such as clinical pathways and audit-and-feedback) to further promote evidence-based contouring. Ongoing collaborations with companies that facilitate radiation delivery, such as Via Oncology and MIM Software, may assist with long-term sustainability of the eContour platform. Preserving free access to basic content is a priority to uphold the Web site’s mission to improve quality of care.
The large, diverse user base and steady growth in traffic over the first 3 years of eContour demonstrate its strong potential to address the unmet need for dissemination of evidence-based 3D contouring information at the point of care. Approximately 50% of US physicians are registered users, and they are the most frequent users. More than 11,000 cases are viewed per month, with H&N the most-viewed disease site. Further development of the site with additional cases and interactive features should continue to expand the reach and improve the utility of eContour.
Footnotes
Supported by the Radiologic Society of North America Resident Research Seed Grant (E.F.G.), American Society of Clinical Oncology Young Investigator Award (E.F.G.), and National Institutes of Health Award No. R25CA020449 (D.L.).
The content of this article is solely the responsibility of the authors and does not necessarily represent the official views of the National Institutes of Health.
AUTHOR CONTRIBUTIONS
Conception and design: Michael V. Sherer, Diana Lin, Neil Panjwani, James D. Murphy, Erin F. Gillespie
Financial support: Diana Lin, Erin F. Gillespie
Collection and assembly of data: Michael V. Sherer, Diana Lin, Kartikeya Puri, Neil Panjwani, Erin F. Gillespie
Data analysis and interpretation: Michael V. Sherer, Diana Lin, Neil Panjwani, Zhigang Zhang, James D. Murphy, Erin F. Gillespie
Manuscript writing: All authors
Final approval of manuscript: All authors
Accountable for all aspects of the work: All authors
AUTHORS' DISCLOSURES OF POTENTIAL CONFLICTS OF INTEREST
The following represents disclosure information provided by authors of this manuscript. All relationships are considered compensated unless otherwise noted. Relationships are self-held unless noted. I = Immediate Family Member, Inst = My Institution. Relationships may not relate to the subject matter of this manuscript. For more information about ASCO's conflict of interest policy, please refer to www.asco.org/rwc or ascopubs.org/cci/author-center.
Open Payments is a public database containing information reported by companies about payments made to US-licensed physicians (Open Payments).
Neil Panjwani
Research Funding: eContour
James D. Murphy
Consulting or Advisory Role: Boston Consulting Group
Research Funding: eContour
Erin F. Gillespie
Research Funding: eContour
No other potential conflicts of interest were reported.
REFERENCES
- 1.Segedin B, Petric P. Uncertainties in target volume delineation in radiotherapy - are they relevant and what can we do about them? Radiol Oncol. 2016;50:254–262. doi: 10.1515/raon-2016-0023. [DOI] [PMC free article] [PubMed] [Google Scholar]
- 2.Berry SL, Boczkowski A, Ma R, et al. Interobserver variability in radiation therapy plan output: Results of a single-institution study. Pract Radiat Oncol. 2016;6:442–449. doi: 10.1016/j.prro.2016.04.005. [DOI] [PMC free article] [PubMed] [Google Scholar]
- 3.Peters LJ, O’Sullivan B, Giralt J, et al. Critical impact of radiotherapy protocol compliance and quality in the treatment of advanced head and neck cancer: Results from TROG 02.02. J Clin Oncol. 2010;28:2996–3001. doi: 10.1200/JCO.2009.27.4498. [DOI] [PubMed] [Google Scholar]
- 4.Ohri N, Shen X, Dicker AP, et al. Radiotherapy protocol deviations and clinical outcomes: A meta-analysis of cooperative group clinical trials. J Natl Cancer Inst. 2013;105:387–393. doi: 10.1093/jnci/djt001. [DOI] [PMC free article] [PubMed] [Google Scholar]
- 5.Wu AJ, Bosch WR, Chang DT, et al. Expert consensus contouring guidelines for intensity modulated radiation therapy in esophageal and gastroesophageal junction cancer. Int J Radiat Oncol Biol Phys. 2015;92:911–920. doi: 10.1016/j.ijrobp.2015.03.030. [DOI] [PMC free article] [PubMed] [Google Scholar]
- 6.Hong TS, Bosch WR, Krishnan S, et al. Interobserver variability in target definition for hepatocellular carcinoma with and without portal vein thrombus: Radiation therapy oncology group consensus guidelines. Int J Radiat Oncol Biol Phys. 2014;89:804–813. doi: 10.1016/j.ijrobp.2014.03.041. [DOI] [PMC free article] [PubMed] [Google Scholar]
- 7.Brouwer CL, Steenbakkers RJ, Bourhis J, et al. CT-based delineation of organs at risk in the head and neck region: DAHANCA, EORTC, GORTEC, HKNPCSG, NCIC CTG, NCRI, NRG Oncology and TROG consensus guidelines. Radiother Oncol. 2015;117:83–90. doi: 10.1016/j.radonc.2015.07.041. [DOI] [PubMed] [Google Scholar]
- 8.Niyazi M, Brada M, Chalmers AJ, et al. ESTRO-ACROP guideline “target delineation of glioblastomas. Radiother Oncol. 2016;118:35–42. doi: 10.1016/j.radonc.2015.12.003. [DOI] [PubMed] [Google Scholar]
- 9.Cox BW, Spratt DE, Lovelock M, et al. International Spine Radiosurgery Consortium consensus guidelines for target volume definition in spinal stereotactic radiosurgery. Int J Radiat Oncol Biol Phys. 2012;83:e597–e605. doi: 10.1016/j.ijrobp.2012.03.009. [DOI] [PubMed] [Google Scholar]
- 10.Illidge T, Specht L, Yahalom J, et al. Modern radiation therapy for nodal non-Hodgkin lymphoma-target definition and dose guidelines from the International Lymphoma Radiation Oncology Group. Int J Radiat Oncol Biol Phys. 2014;89:49–58. doi: 10.1016/j.ijrobp.2014.01.006. [DOI] [PubMed] [Google Scholar]
- 11.Yahalom J, Illidge T, Specht L, et al. Modern radiation therapy for extranodal lymphomas: Field and dose guidelines from the International Lymphoma Radiation Oncology Group. Int J Radiat Oncol Biol Phys. 2015;92:11–31. doi: 10.1016/j.ijrobp.2015.01.009. [DOI] [PubMed] [Google Scholar]
- 12.Fuller CD, Nijkamp J, Duppen JC, et al. Prospective randomized double-blind pilot study of site-specific consensus atlas implementation for rectal cancer target volume delineation in the cooperative group setting. Int J Radiat Oncol Biol Phys. 2011;79:481–489. doi: 10.1016/j.ijrobp.2009.11.012. [DOI] [PMC free article] [PubMed] [Google Scholar]
- 13.Mavroidis P, Giantsoudis D, Awan MJ, et al. Consequences of anorectal cancer atlas implementation in the cooperative group setting: Radiobiologic analysis of a prospective randomized in silico target delineation study. Radiother Oncol. 2014;112:418–424. doi: 10.1016/j.radonc.2014.05.011. [DOI] [PMC free article] [PubMed] [Google Scholar]
- 14. Reference deleted.
- 15.Grimshaw JM, Russell IT. Effect of clinical guidelines on medical practice: A systematic review of rigorous evaluations. Lancet. 1993;342:1317–1322. doi: 10.1016/0140-6736(93)92244-n. [DOI] [PubMed] [Google Scholar]
- 16.Grol R, Grimshaw J. From best evidence to best practice: Effective implementation of change in patients’ care. Lancet. 2003;362:1225–1230. doi: 10.1016/S0140-6736(03)14546-1. [DOI] [PubMed] [Google Scholar]
- 17.Sherer MV, Bryant AK, Wu AJ, et al. Assessment of contouring resource use and awareness of contouring guidelines among radiation oncologists. J Radiat Oncol. 2018;7:103–109. [Google Scholar]
- 18.Bonis PA, Pickens GT, Rind DM, et al. Association of a clinical knowledge support system with improved patient safety, reduced complications and shorter length of stay among Medicare beneficiaries in acute care hospitals in the United States. Int J Med Inform. 2008;77:745–753. doi: 10.1016/j.ijmedinf.2008.04.002. [DOI] [PubMed] [Google Scholar]
- 19.Isaac T, Zheng J, Jha A. Use of UpToDate and outcomes in US hospitals. J Hosp Med. 2012;7:85–90. doi: 10.1002/jhm.944. [DOI] [PubMed] [Google Scholar]
- 20.Gillespie EF, Panjwani N, Golden DW, et al. Multi-institutional randomized trial testing the utility of an interactive three-dimensional contouring atlas among radiation oncology residents. Int J Radiat Oncol Biol Phys. 2017;98:547–554. doi: 10.1016/j.ijrobp.2016.11.050. [DOI] [PubMed] [Google Scholar]
- 21. doi: 10.1007/s13187-018-1388-7. McClelland S III, Chernykh M, Dengina N, et al: Bridging the gap in global advanced radiation oncology training: Impact of a web-based open-access interactive three-dimensional contouring atlas on radiation oncologist practice in Russia. J Cancer Educ 10.1007/s13187-018-1388-7 [epub ahead of print on June 25, 2018] [DOI] [PubMed] [Google Scholar]
- 22. US Census Bureau: Census regions and divisions of the United States. https://www2.census.gov/geo/pdfs/maps-data/maps/reference/us_regdiv.pdf.
- 23. Harley A: Optimize for return visits, not bounce rate. https://www.nngroup.com/articles/return-visits-not-bounce/?lm=conversion-rates&pt=article.
- 24. Shaw M, Blanning R, Strader T, et al (eds): Handbook on electronic commerce. Berlin, Springer, 2000. [Google Scholar]
- 25.Neppala P, Sherer MV, Larson G, et al. An interactive contouring module improves engagement and interest in radiation oncology among preclinical medical students: Results of a randomized trial. Pract Radiat Oncol. 2018;8:e190–e198. doi: 10.1016/j.prro.2018.01.001. [DOI] [PMC free article] [PubMed] [Google Scholar]
- 26.American Society of Clinical Oncology The state of cancer care in America, 2017: A report by the American Society of Clinical Oncology. J Oncol Pract. 2017;13:e353–e394. doi: 10.1200/JOP.2016.020743. [DOI] [PubMed] [Google Scholar]
- 26a.Fung CY, Chen E, Vapiwala N, et al. The American Society for Radiation Oncology 2017 Radiation Oncologist Workforce Study. Int J Rad Oncol Biol Phys. 2019;103:547–556. doi: 10.1016/j.ijrobp.2018.10.020. https://www.redjournal.org/article/S0360-3016(18)33907-5/fulltext. [DOI] [PubMed] [Google Scholar]
- 27.Zietman A. Bringing radiation therapy to underserved nations: An increasingly global responsibility in an ever-shrinking world. Int J Radiat Oncol Biol Phys. 2014;89:440–442. doi: 10.1016/j.ijrobp.2014.03.046. [DOI] [PubMed] [Google Scholar]
- 28.Warner JL, Cowan AJ, Hall AC, et al. HemOnc.org: A collaborative online knowledge platform for oncology professionals. J Oncol Pract. 2015;11:e336–e350. doi: 10.1200/JOP.2014.001511. [DOI] [PMC free article] [PubMed] [Google Scholar]
- 29.Martínez-Pérez B, de la Torre-Díez I, López-Coronado M, et al. Mobile clinical decision support systems and applications: A literature and commercial review. J Med Syst. 2014;38:4. doi: 10.1007/s10916-013-0004-y. [DOI] [PubMed] [Google Scholar]
- 30.Nerminathan A, Harrison A, Phelps M, et al. Doctors’ use of mobile devices in the clinical setting: A mixed methods study. Intern Med J. 2017;47:291–298. doi: 10.1111/imj.13349. [DOI] [PubMed] [Google Scholar]
- 31.Mickan S, Atherton H, Roberts NW, et al. Use of handheld computers in clinical practice: A systematic review. BMC Med Inform Decis Mak. 2014;14:56. doi: 10.1186/1472-6947-14-56. [DOI] [PMC free article] [PubMed] [Google Scholar]
- 32.Eriksen JG, Salembier C, Rivera S, et al. Four years with FALCON – An ESTRO educational project: Achievements and perspectives. Radiother Oncol. 2014;112:145–149. doi: 10.1016/j.radonc.2014.06.017. [DOI] [PubMed] [Google Scholar]
- 33. American Association of Medical Dosimetrists: 2014 Anatomy and Contouring Webinar Series Registration. https://www.medicaldosimetry.org/foundation-removed/webinars/
- 34.Deraniyagala R, Amdur RJ, Boyer AL, et al. Usability study of the EduMod eLearning Program for contouring nodal stations of the head and neck. Pract Radiat Oncol. 2015;5:169–175. doi: 10.1016/j.prro.2014.10.008. [DOI] [PubMed] [Google Scholar]
- 35.Calero JJ, Oton LF, Oton CA. Apps for radiation oncology. A comprehensive review. Transl Oncol. 2017;10:108–114. doi: 10.1016/j.tranon.2016.08.008. [DOI] [PMC free article] [PubMed] [Google Scholar]


