Abstract
Background
Clear cell renal cell carcinoma (ccRCC) is the most common type of renal cell carcinoma and is characterized by a dysregulation of changes in cellular metabolism. Altered lipid metabolism contributes to ccRCC progression and malignancy.
Method
Associations among survival potential and each gene ontology (GO) term were analyzed by univariate Cox regression. The results revealed that membrane lipid metabolism had the greatest hazard ratio (HR). Weighted gene co-expression network analysis (WGCNA) was applied to determine the key genes associated with membrane lipid metabolism. Consensus clustering was used to identify novel molecular subtypes based on the key genes. LASSO Cox regression was performed to build a membrane lipid metabolism–based signature. The random forest algorithm was applied to find the most important mutations associated with membrane lipid metabolism. Decision trees and nomograms were constructed to quantify risks for individual patients.
Result
Membrane lipid metabolism stratified ccRCC patients into high- and low-risk groups. Key genes were identified by WGCNA. Membrane lipid metabolism–based signatures exhibited higher prediction efficiency than other clinicopathological traits in both whole cohort and subgroup analyses. The random forest algorithm revealed high associations among the membrane lipid metabolism–based signature and BAP1, PBRM1 and VHL mutations. Decision trees and nomograms indicated high efficiency for risk stratification.
Conclusion
Our study might contribute to the optimization of risk stratification for survival and personalized management of ccRCC patients.
Electronic supplementary material
The online version of this article (10.1007/s13167-019-00189-8) contains supplementary material, which is available to authorized users.
Keywords: Clear cell renal cell carcinoma (ccRCC), Membrane lipid metabolism, Gene signature, Somatic mutations, von Hippel-Lindau (VHL), Risk assessment, Overall survival, Patient stratification, Decision tree, Algorithm, Gene co-expression network analysis, Predictive preventive personalized medicine (PPPM)
Introduction
Clear cell renal cell carcinoma (ccRCC) is the most common type of renal cell carcinoma and is characterized by a dysregulation of changes in cellular metabolism [1]. High-frequency biallelic von Hippel-Lindau (VHL) inactivation caused by allelic deletion or loss of heterozygosity on chromosome 3p (> 90%) along with gene mutation (∼ 50%) or promoter hypermethylation (5–10%) is the canonical molecular alteration in ccRCC [2, 3]. VHL inactivation triggers the constitutive activation of HIF1 and HIF2 through the stabilization of oxygen labile HIFα subunits and aberrant cancer metabolism change [4]. Abnormal cancer metabolism leads to changes in fatty acid fates, including shifts in ccRCC towards excessive lipid storage [5]. Thus, ccRCC cells appear as malignant epithelial cells with clear cytoplasm due to the presence of vast lipid and glycogen deposits.
While the overall 5-year survival rate is 60% for kidney cancer, this level drops to 10% in patients with metastatic disease [6]. Therefore, alternative approaches are urgently required to prolong patient survival to replace surgical resection as the only curative treatment for ccRCC. Hence, precise methods for predicting survival time are critical issues in the management of ccRCC patients. Current prognostic methods to evaluate the survival time are based on clinicopathological features, such as AJCC-TNM stage and histologic grade. However, these variables have limited predictive accuracy.
Conventionally, high-throughput techniques, such as RNA-sequencing (RNA-seq) and scRNA seq, have provided new insights into transcriptome profiling. This has facilitated the utilization of molecules as diagnostic and prognostic biomarker [7–10]. Machine learning methods also provide new hints in utilizing high-dimension datasets [8, 11, 12].
In this study, we analyzed the associations among survival potential and each gene ontology (GO) term by ssGSEA method and univariate Cox regression. Membrane lipid metabolism had the greatest HR ratio in the Cox regression. WGCNA was used to determine the hub-genes associated with membrane lipid metabolism. Consensus clustering was applied based on the hub-gene to build novel molecular subtypes in ccRCC. Moreover, we constructed a lipid metabolic signature by LASSO Cox regression to predict the OS of ccRCC patients. A survival decision tree and a binary decision tree were built to stratify the ccRCC patients. Finally, a nomogram was generated with risk score and other important clinicopathological traits as a quantitative tool to predict survival probabilities for individual ccRCC patients during follow-up. These results may facilitate the development of predictive, preventive and personalized medicine (PPPM) in ccRCC patients.
Method
Data download and ssGSEA implementation
TCGA RNA-seq datasets and clinical data for ccRCC were downloaded by UCSC Xena browser (https://xenabrowser.net/). The detailed information of the clinic dataset was in supplementary file 1. The ssGSEA programme was applied to derive the enrichment scores of each GO term using R package “gsva” [13].
WGCNA based on RNA-seq data
The weighted correlation network analysis (WGCNA) was used to apply K-means clustering based on the whole transcriptome [14, 15]. Co-expression similarity si, j was defined as the absolute value of the correlation coefficient between the profiles of nodes i and j:
where xi and xj are expression values for genes i and j, and si, j represents Pearson’s correlation coefficients of genes i and j.
A weighed network adjacency was defined by raising the co-expression similarity to a power β:
with β≥1. We selected the power of β = 9 and scale-free R2 = 0.95 as soft-thresholding parameters to ensure a signed scale-free co-expression gene network. By evaluating the correlations between the membrane lipid metabolism ssGSEA score and the eigenvalue of each module, the yellowgreen module was selected for further analysis. Hub-genes were identified as the genes in the yellowgreen module with gene significance (gene significance: Pearson’s coefficient between genes and ssGSEA score) greater than 0.3 and significantly associated with the OS of ccRCC patients.
Molecular subtype identification
R package “ConsensusClusterPlus” was applied to identify the molecular subtype based on the hub-genes [16]. Consensus CDF and delta area were used to estimate clustering effects.
LASSO regularization
LASSO (least absolute shrinkage and selection operator) is an important regularization in many regression analysis methods (e.g. COX regression and logistic regression) [17]. An L1-norm is used to penalize the weight of the model parameters. Assuming a model has a set of parameters, the LASSO regularization can be defined as:
which can also be expressed as a constraint to the targeted objective function:
An important property of the LASSO regularization term is that it can force the parameter values to be 0, thus generating a sparse parameter space, which is a desirable characteristic for feature selection. A risk score (RS) formula was established by including individual normalized gene expression value weighted by their LASSO Cox coefficients as follows:
Decision tree and random forest construction
Recursive partitioning analysis (RPA) was performed to construct decision trees using “rpart” package. The decision tree was plotted by “rpart.plot” package. KM plot was used to illustrate the survival outcome in different nodes of the survival decision tree. Confusion matrix was calculated to estimate the accuracy of the binary decision tree. “randomForest” and “ranger” packages were applied to determine the key gene mutation associated with risk score. The optimal parameter was calculated by ranger function.
Statistical analysis
P values and hazard ratios for survival outcome analyses were obtained from univariate and multivariate Cox proportional-hazards regression models using the R package “survival”. Multivariate Cox regression was used to calculate the coefficients in the nomogram. The nomogram was plotted by the “rms” package. The time-dependent AUC value was calculated by the “survivalROC” package. One-way ANOVA was applied to obtain the P value for risk score distribution in groups of AJCC-TNM stage and histologic grade. The response to immunotherapy was calculated by TIDE (http://tide.dfci.harvard.edu/).
Result
ssGSEA for ccRCC tumour tissues and the relationship of ssGSEA enrichment with survival of ccRCC patients
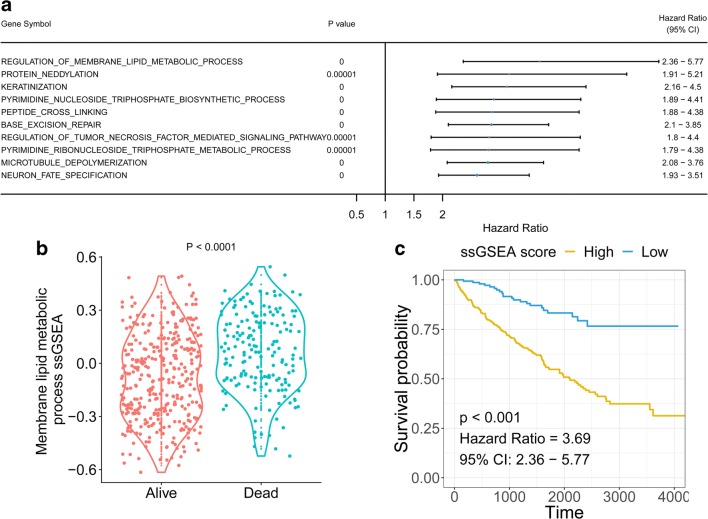
ssGSEA method was applied for each ccRCC tumour tissue. Univariate Cox analysis was performed based on the OS of ccRCC patients and the ssGSEA score of each GO term per patient. The results indicated that membrane lipid metabolism was the most significant term associated with the OS of ccRCC patients (Fig. 1a and Supplementary file 2). The membrane lipid metabolism ssGSEA score was higher in dead patients compared with living patients (Fig. 1b). The KM plot showed that patients with higher membrane lipid metabolism ssGSEA scores had favourable survival outcomes (HR = 3.69, p < 0.0001) (Fig. 1c).
Fig. 1.
Correlation of ssGSEA score and overall survival of ccRCC patients. a Gene ontology term with greatest HR in univariate Cox regression. b Membrane lipid metabolism ssGSEA distribution in living and deceased ccRCC patients. c Kaplan-Meier plot for patients with high and low membrane lipid metabolism ssGSEA scores
Molecular subtype identification in ccRCC patients
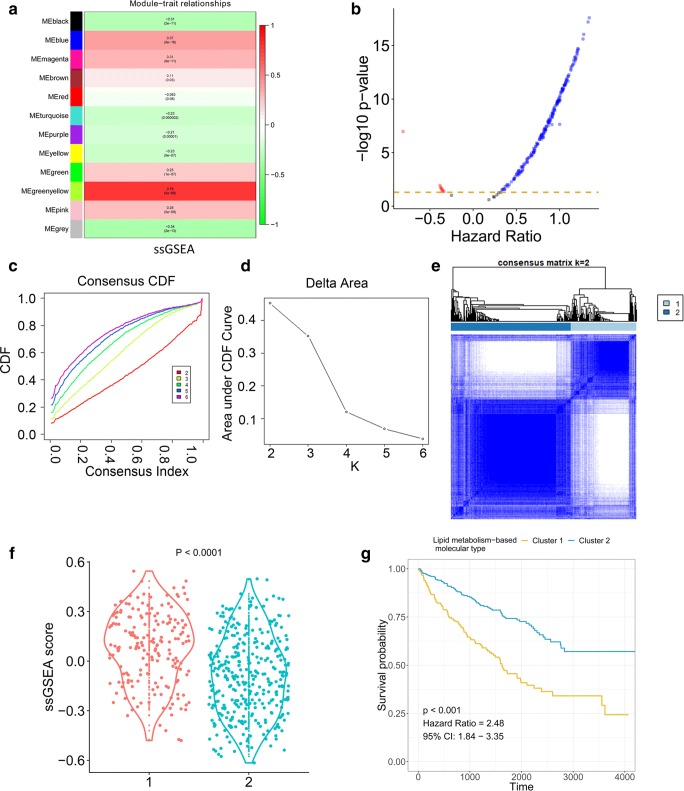
WGCNA was applied on the transcriptome of ccRCC tumour tissues. The correlation between the eigenvalue of each cluster and the membrane lipid metabolism ssGSEA score was analyzed by Pearson’s coefficient, indicating the greenyellow module had the highest correlation with membrane lipid metabolism ssGSEA score (Fig. 2a). The genes in the greenyellow cluster were extracted for further analysis. Univariate Cox analysis was performed for each gene. The genes with gene significance greater than 0.3 and significant association with ccRCC patient survival were defined as the hub-genes (Fig. 2b and supplementary file 3). Based on the transcriptome profiles of the hub-genes, consensus clustering was performed to identify the molecular subtypes of ccRCC tumour tissues (Fig. 2c–e). The results indicated k = 2 was an adequate selection with clustering stability increasing from k = 2 to 6. The consensus matrix showed a similarity in the two subtypes (k = 1 and k = 2). The samples in cluster 1 had a greater membrane lipid metabolism ssGSEA score compared with that of cluster 2 (Fig. 2f). Moreover, the KM plot revealed that cluster 1 had poorer survival probability compared with that of cluster 2 (Fig. 2g). Taking together, these results indicated membrane lipid metabolism and related hub-genes would stratify ccRCC patients into different molecular subtypes and influence their survival.
Fig. 2.
Identification of novel molecular subtypes. a Correlation between modules and ssGSEA score. b Cox coefficients and p values from univariate Cox regression for the genes in the greenyellow module. c Consensus clustering cumulative distribution function (CDF) for k = 2 to 6. d Relative change in the area under the CDF curve for k = 2 to 6. e Consensus matrix similarity for 2 clusters in the ccRCC cohorts. f Membrane lipid metabolism ssGSEA distribution in two clusters. g Kaplan-Meier plot for patients in cluster 1 and cluster 2
Construction of the membrane lipid metabolism–based signature
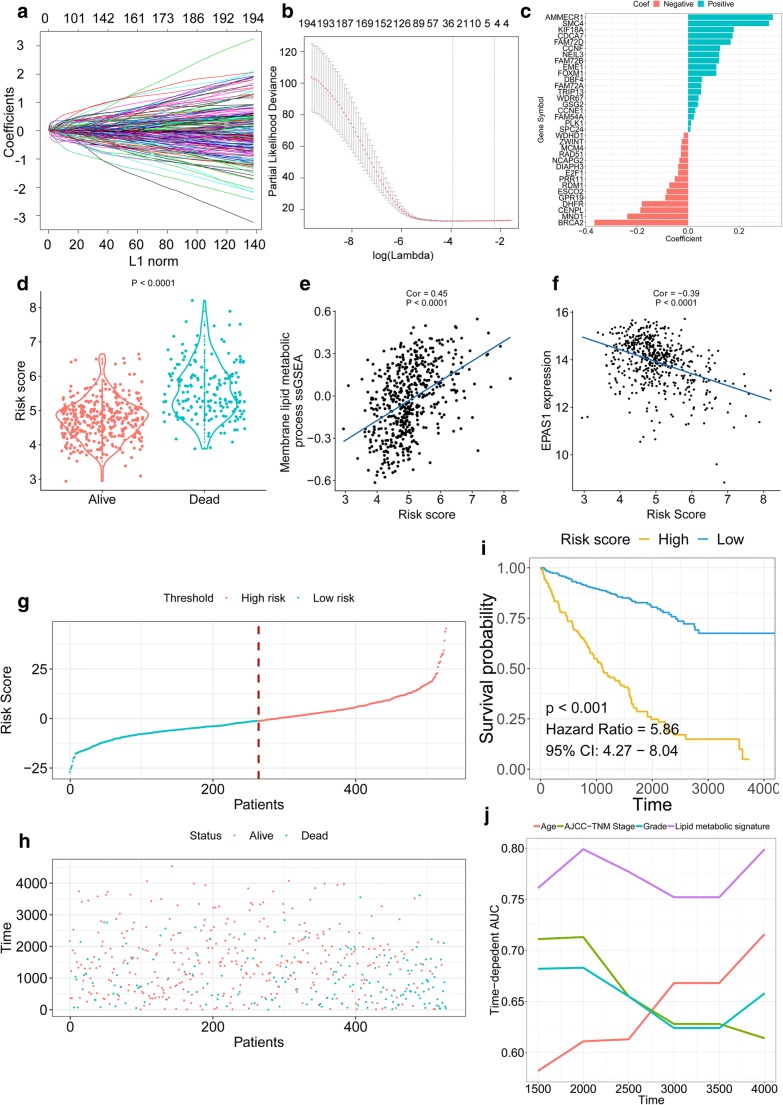
The identified hub-genes were used to build the lipid metabolic signature for predicting the OS of ccRCC patients. By forcing the sum of the absolute values of the regression coefficients to be less than a fixed value, certain coefficients were reduced to exactly zero, and the most powerful prognostic genes were identified with relative regression coefficients (Fig. 3a–c). Cross-validation was applied to prevent over-fitting (Fig. 3b). A 34-gene membrane lipid metabolism–based signature was constructed according to the individual coefficients of the genes. The deceased patients had a greater risk score than that of living patients (Fig. 3d). Moreover, the risk score showed high correlations with the lipid metabolic ssGSEA, suggesting a relationship between the risk score and lipid metabolism (Fig. 3e). The dysregulation of EPAS1 involves the progression and oncogenic lipid metabolism of ccRCC. Hence, we investigated the relationship between risk score and EPAS1 expression. The results revealed that high-risk scores were associated with low EPAS1 expression levels, suggesting a potential correlation between the lipid metabolic signature and VHL pathway (Fig. 3f). Then, we ranked the risk score of each ccRCC patient (Fig. 3g). 263 patients had high-risk scores, and 262 patients had low-risk scores. Figure 3h shows the survival overview of the ccRCC patients. The Kaplan-Meier curve and Cox regression analyses suggested that patients with low-risk scores (n = 262) had significantly better OS than those with high-risk scores (n = 263) (HR = 0.4, p < 0.001) (Fig. 3i). Time-dependent ROC analyses indicated that the lipid metabolic signature had higher prediction accuracy than other clinicopathological traits (Fig. 3j).
Fig. 3.
Signature-based risk score is a promising marker in ccRCC cohort. a, b LASSO Cox analysis identified genes most correlated with overall survival. c Cox coefficients distribution of the gene signature. d Risk score distribution in living and dead patients. e Correlation between membrane lipid metabolism ssGSEA score and signature-based risk score. f Correlation between EPAS1 expression and signature-based risk score. g Risk score distribution. h Survival overview. i Patients in the high-risk group exhibited worse overall survival compared with those in the low-risk group. j AUC(t) of multivariable models indicated the membrane lipid metabolism–based signature had the highest predictive power for overall survival. h Membrane lipid metabolism–based risk score distribution in living and deceased ccRCC patients
Subgroup analysis
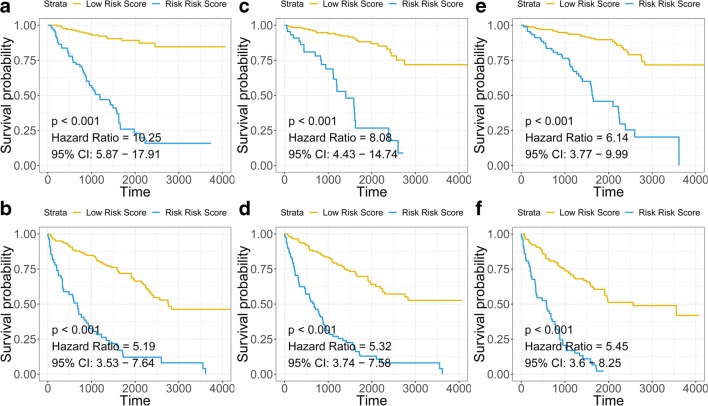
As shown in Fig. 4, the signature-based risk score also serves as a promising marker to predict overall survival in different subgroups, including young (HR = 10.25, p < 0.001) (Fig. 4a), old (HR = 5.19, p < 0.001) (Fig. 4b), histologic grade I–II (HR = 8.08, p < 0.001) (Fig. 4c), histologic grade III–IV (HR = 5.32, p = 0.008) (Fig. 4d), AJCC-TNM stage I–II (HR = 6.14, p < 0.001) (Fig. 4e) and AJCC-TNM stage III–IV (HR = 5.45, p < 0.001) (Fig. 4f) patients, respectively.
Fig. 4.
Survival analysis in subgroups. Signature-based risk score is a promising marker for overall survival in young (a), old (b), low histologic grade (I–II) (c), high histologic grade (III–IV) (d), low AJCC-TNM stage (I–II) (e) and high AJCC-TNM stage (III–IV) (f)
The association of gene mutation and membrane lipid metabolism–based signature
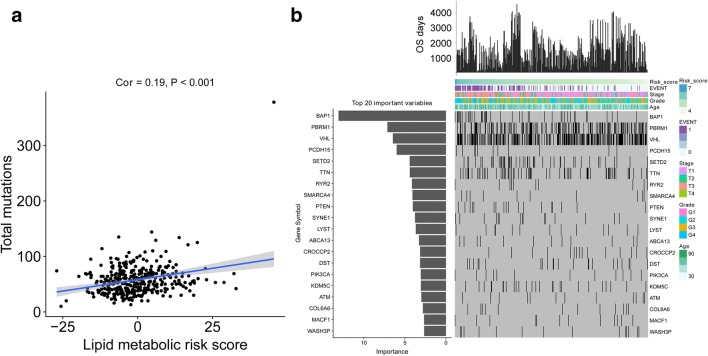
Correlations among total mutations and signature-based risk scores were analyzed. The results revealed a positive correlation between risk scores and total mutations in ccRCC patients (Fig. 5a). Furthermore, the most correlated somatic mutations (BAP1, PBRM1 and VHL) were identified by random forest algorithm (Fig. 5b).
Fig. 5.
Random forest identified the most important gene mutations. a Correlation between the membrane lipid metabolism–based signature and somatic mutations. b Distribution of somatic mutations correlated with the membrane lipid metabolism–based signature. The upper bar plot indicates OS per patient, whereas the left bar plot shows the importance of the somatic mutations correlated with the membrane lipid metabolism–based signature
Combination with clinicopathological traits to improve risk stratification and survival prediction
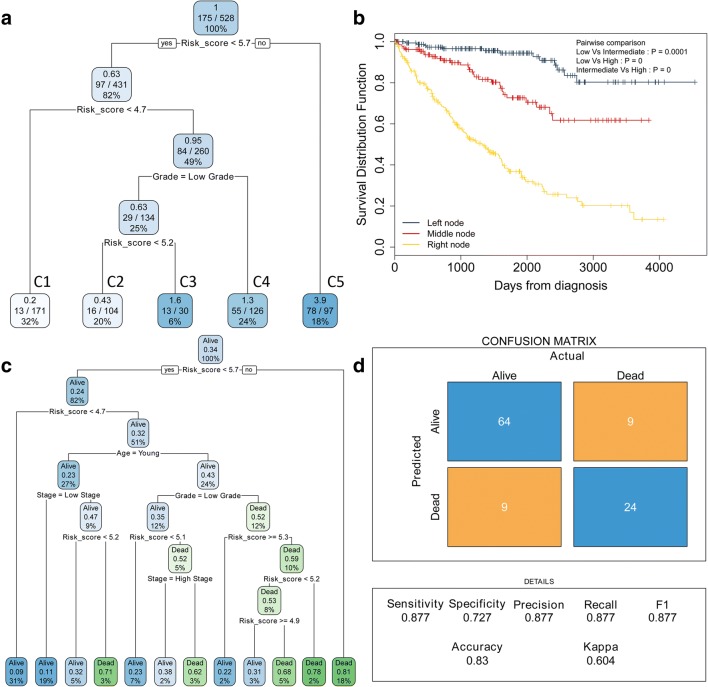
Recursive partitioning analysis (RPA) was performed to construct a survival decision tree to improve risk stratification for overall survival. Four parameters, including stage, grade, age and risk score, were used as inputs for decision tree construction. Clusters 1–5 (C1–5) with different labels were identified as the outputs of the decision tree. C1 were merged as a low-risk subgroup, C2–3 as an intermediate subgroup and C4–5 as a high-risk subgroup. A Kaplan-Meier plot showed that the three risk subgroups differed remarkably in overall survival (Fig. 6b). Furthermore, a binary decision tree was constructed to illustrate the relationship between survival status and clinicopathological traits (Fig. 6c). Three parameters, including stage, grade and risk score, were identified as inputs of decision tree construction in the training sets. The accuracy of the binary decision tree was tested in the validation sets. A confusion matrix showed a high accuracy of the decision tree (80.2%) (Fig. 6d).
Fig. 6.
Decision trees were generated to improve risk stratification. a A survival decision tree was generated to optimize risk stratification, and three risk subgroups were identified. b Kaplan-Meier plot showed three risk subgroups differed remarkably in overall survival of ccRCC patients. c A binary decision tree was generated to identify the survival status of ccRCC patients. d Confusion matrix was generated to illustrate the accuracy of the binary decision tree
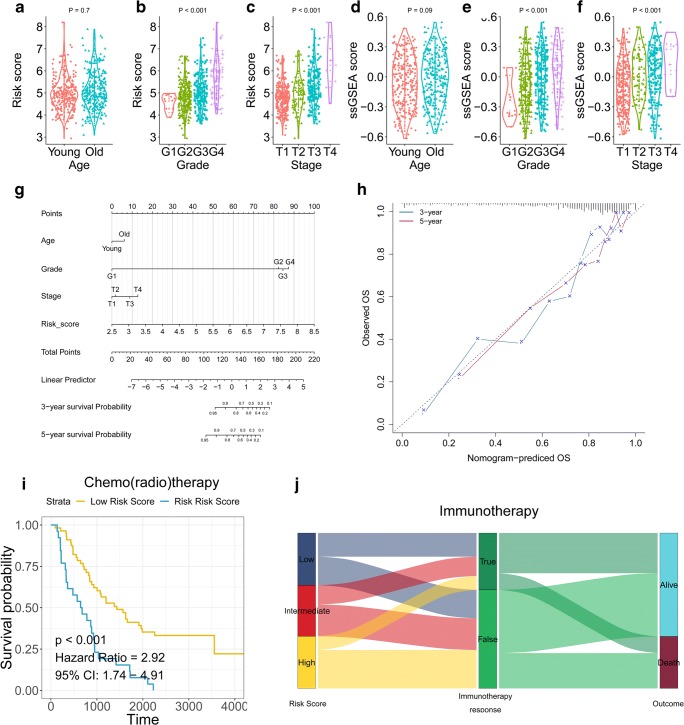
Risk score and membrane lipid metabolism ssGSEA showed significantly different distribution in different histologic grade and AJCC-TNM stage (Fig. 7a–f). A nomogram was generated with risk scores and other important clinicopathological traits as a quantitative tool to predict the survival probability for individual ccRCC patients during follow-up (Fig. 7g). Calibration curves revealed the 3-year and 5-year predictive lines were close to the ideal 45° dotted line (Fig. 7h). In general, the nomogram showed high levels of predictive power and accuracy. Moreover, patients with higher risk score showed worse overall survival among those who received chemo(radio)therapy (Fig. 7i) and exhibited poor response to immunotherapy (Fig. 7j).
Fig. 7.
A nomogram was constructed to personalize risk for individual patients. a–c Risk score distribution in young and old, histologic G1–G4, AJCC Stage 1–4 status. d–f Membrane lipid metabolism ssGSEA distribution in young and old, histologic G1–G4, AJCC Stage 1–4 status. g Nomogram. h Calibration curves of survival prediction at different times were close to ideal performance. i, j Patients with higher risk score exhibited worse overall survival among those who received adjuvant therapies including chemo(radio)therapy and immunotherapy
Discussion
ccRCC is the most common type of renal cell carcinoma with high frequency of VHL inactivation. Somatic mutations or methylation dysregulation–induced VHL alterations have been estimated to occur in near 90% of all ccRCC tumour tissues [2]. VHL inactivation leads to the constitutive activation of HIF1 and HIF2 and subsequent activation of hypoxic gene expression, which is believed to be a major driving force in ccRCC development. HIFs affect gene expression change and lead to the dysregulation of cellular processes in cancer, including angiogenesis, cell metabolism and tumour metastasis [18–21]. ccRCC is characterized by vast accumulations of lipids and glycogen in cytoplasm [22]. One study revealed that altered lipid metabolism contributed to ccRCC progression and linked altered lipid metabolism to VHL inactivation in ccRCC [4]. In this study, we analyzed the association between survival potential and each GO term by ssGSEA method and univariate Cox regression. Membrane lipid metabolism had the greatest HR ratio in the Cox regression. K-means clustering was used to identify the hub-genes associated with membrane lipid metabolism. Consensus clustering was applied based on the hub-gene to build novel molecular subtypes in ccRCC. Moreover, we constructed a lipid metabolic signature by LASSO Cox regression. A survival decision tree and a binary decision tree were built to stratify the ccRCC patients. Finally, a nomogram was generated with risk scores and other important clinicopathological traits as a quantitative tool to predict survival probabilities for individual ccRCC patients during follow-up.
Metabolic adaptation in ccRCC leads to the activation of lipid storage pathways, which plays crucial roles in the development of ccRCC malignancy. Metabolic changes in ccRCC include shifts to anaerobic metabolism by HIF-dependent activation of glycolytic pathways and increased utilization of the pentose phosphate pathway, leading to lipid deposit formations in the cytoplasm [23, 24]. Hypoxia-induced lipid storage in breast and glioma cell lines serves as protective barriers against oxidative stress–induced toxicity [25, 26]. Interruption of the lipid storage pathway decreased lipid droplets and the tumourigenic capacity of xenografts in mice [25]. In our study, we found that the dysregulation of membrane lipid metabolism could be a new target for treating ccRCC patients. Membrane lipid metabolism had the greatest HR compared with other GO terms, suggesting that the dysregulation of membrane lipid metabolism was involved in ccRCC malignancy. The membrane lipid metabolism–based molecular subtypes cluster 1 and cluster 2 had different survival probabilities, which further confirmed the importance of membrane lipid metabolism in ccRCC. Palmitoyltransferase 1A (CPT1A) is a direct HIF target gene. Repression of CPT1A by HIF1 and HIF2 reduces fatty acid transport into the mitochondria and forces fatty acids to lipid droplets for storage [5]. Pearson’s coefficient showed that the membrane lipid metabolism–based gene signature had a high correlation with CPT1A, suggesting a relationship between membrane lipid metabolism and lipid droplet deposits. Some biomarkers involved in our gene signature have been investigated in cancer. For instance, AMMECR1 is mediated by both miR-124 and MEG3 in ccRCC and regulate the growth and metastasis of renal cell carcinoma [27]. SMC4 is a core subunit of condensin complexes that mainly contributes to chromosome condensation and segregation. One study revealed SMC4 is closely related to cell cycle, cell adhesion in lung carcinogenesis and acts as an independent prognostic factor in lung adenocarcinoma [28]. KIF18A has been reported to correlate with unfavourable prognoses in colorectal cancer and participates in breast cancer malignancy [29, 30]. Additionally, CDCA7 increased the expression of EZH2, a marker of aggressive breast cancer involved in tumour progression, by enhancing the transcriptional activity of its promoter [31]. However, the biological roles and clinical significance of the biomarker genes in the signature require further investigation in ccRCC.
Pearson’s coefficient revealed a positive correlation between the membrane lipid metabolism–based risk score and total mutations in ccRCC patients. A random forest algorithm revealed BAP1, PBRM1 and VHL were the most important mutations associated with membrane lipid metabolism–based risk scores. BAP1, PBRM1 and VHL gene mutations are three of the most commonly mutated genes in ccRCC. PBRM1, a subunit of the PBAF SWI/SNF chromatin remodelling complex, and histone deubiquitinase BAP1 were recently found to be altered in ccRCC [4]. BAP1 and PBRM1 act as chromatin regulators and are involved in the ccRCC tumourigenesis metabolic remodelling process [32]. VHL mutation leads to the stabilization of hypoxia inducible factors. Our analysis revealed a potential relationship between membrane lipid metabolism and newly emerging chromatin remodelling/histone methylation pathways in ccRCC.
The lipid metabolism–based risk scores and ssGSEA scores showed different distributions in AJCC-TNM stages and histologic grades, indicating the involvement of membrane lipid metabolism in tumour progression. The decision tree and nomogram analyses integrated the membrane lipid metabolism–based gene signature and other clinicopathological traits and showed high accuracy for predicting the survival of ccRCC patients. Overall, the membrane lipid metabolism–based gene signature can be a promising biomarker useful for improving the prediction accuracy of ccRCC patient survival.
Expert recommendations
We recommend utilization of omics dataset and machine learning methods in ccRCC research. ccRCC is the most common type of renal cell carcinoma and is involved in multiple levels of molecular alterations in genome, transcriptome, proteome and metabolome. Big data analysis of multi-omics could help identify the key regulators in the change of cellular metabolism in ccRCC. Our utilization of transcriptome data and personalized ccRCC survival prediction model building rooting in the advanced concept of PPPM may improve services to ccRCC patients in the PPPM context. For follow-up developments, we will further optimize the model and combine molecular experiments to explore the important mechanism in ccRCC progression.
Conclusion
We determined that the dysregulation of membrane lipid metabolism is an important biological process in ccRCC malignancy. Molecular subtypes were identified based on the hub-genes associated with membrane lipid metabolism. We also established a gene expression signature to predict OS for PPPM in ccRCC patients. Integrated with clinicopathological features, a decision tree was generated to improve risk stratification, and a nomogram was constructed to quantify risk for individual patients. This analysis of membrane lipid metabolism may facilitate PPPM in ccRCC patients.
Electronic supplementary material
(CSV 31 kb)
(CSV 888 bytes)
(CSV 8 kb)
Acknowledgements
We would like to thank Dr. Michael Rosemann for helpful discussions and suggestions.
Abbreviations
- ccRCC
clear cell renal cell carcinoma
- TCGA
The Cancer Genome Atlas
- tROC
time-dependent receiver operating characteristic
- GSEA
Gene Set Enrichment Analysis
- WGCNA
Weighted gene co-expression network analysis
- OS
Overall survival
- LASSO
Least Absolute Shrinkage and Selection Operator
- GO
gene ontology
- VHL
von Hippel-Lindau, HR: hazard ratio
Authors’ contributions
XW B and R S conceived and designed the experiments. XW B and YF W analyzed the data. XW B, MD B and YF W wrote the paper. YB Z and K Z revised the paper. All authors read and approved the final manuscript.
Funding information
This work was supported by the Zhejiang Provincial Natural Science Foundation (NO. LY16H020005).
Data Availability
The datasets supporting the conclusions of this article are available in the Xena browser (https://xenabrowser.net/) repository.
Compliance with ethical standards
Ethics approval and consent to participate
Not applicable.
Consent for publication
Not applicable.
Conflict of interest
The authors declare that they have no competing interests.
Footnotes
Publisher’s note
Springer Nature remains neutral with regard to jurisdictional claims in published maps and institutional affiliations.
Maode Bao and Run Shi contributed equally to the manuscript.
Contributor Information
Yanfang Wang, Email: yangfang.wang@cup.uni-muenchen.de.
Xuanwen Bao, Email: xuanwen.bao@tum.de.
References
- 1.Mickley A, Kovaleva O, Kzhyshkowska J, Gratchev A. Molecular and immunologic markers of kidney cancer—potential applications in predictive, preventive and personalized medicine. EPMA J. 2015;6(1):20. doi: 10.1186/s13167-015-0042-2. [DOI] [PMC free article] [PubMed] [Google Scholar]
- 2.Guo G, Gui Y, Gao S, Tang A, Hu X, Huang Y, et al. Frequent mutations of genes encoding ubiquitin-mediated proteolysis pathway components in clear cell renal cell carcinoma. Nat Genet. 2012;44(1):17. doi: 10.1038/ng.1014. [DOI] [PubMed] [Google Scholar]
- 3.Varela I, Tarpey P, Raine K, Huang D, Ong CK, Stephens P, et al. Exome sequencing identifies frequent mutation of the SWI/SNF complex gene PBRM1 in renal carcinoma. Nature. 2011;469(7331):539. doi: 10.1038/nature09639. [DOI] [PMC free article] [PubMed] [Google Scholar]
- 4.Dalgliesh GL, Furge K, Greenman C, Chen L, Bignell G, Butler A, et al. Systematic sequencing of renal carcinoma reveals inactivation of histone modifying genes. Nature. 2010;463(7279):360. doi: 10.1038/nature08672. [DOI] [PMC free article] [PubMed] [Google Scholar]
- 5.Du W, Zhang L, Brett-Morris A, Aguila B, Kerner J, Hoppel CL, et al. HIF drives lipid deposition and cancer in ccRCC via repression of fatty acid metabolism. Nat Commun. 2017;8(1):1769. doi: 10.1038/s41467-017-01965-8. [DOI] [PMC free article] [PubMed] [Google Scholar]
- 6.Doberstein K, Wieland A, Lee SBB, Blaheta RAA, Wedel S, Moch H, et al. L1-CAM expression in ccRCC correlates with shorter patients survival times and confers chemoresistance in renal cell carcinoma cells. Carcinogenesis. 2010;32(3):262–270. doi: 10.1093/carcin/bgq249. [DOI] [PubMed] [Google Scholar]
- 7.Wang Y, Zhang Q, Gao Z, Xin S, Zhao Y, Zhang K, et al. A novel 4-gene signature for overall survival prediction in lung adenocarcinoma patients with lymph node metastasis. Cancer Cell Int. 2019;19(1):100. doi: 10.1186/s12935-019-0822-1. [DOI] [PMC free article] [PubMed] [Google Scholar]
- 8.Wang Y, Deng H, Xin S, et al. Prognostic and predictive value of three DNA methylation signatures in lung adenocarcinoma[J]. Frontiers in genetics, 2019;10:349. [DOI] [PMC free article] [PubMed]
- 9.Li Na, Zhan Xianquan. Identification of clinical trait–related lncRNA and mRNA biomarkers with weighted gene co-expression network analysis as useful tool for personalized medicine in ovarian cancer. EPMA Journal. 2019;10(3):273–290. doi: 10.1007/s13167-019-00175-0. [DOI] [PMC free article] [PubMed] [Google Scholar]
- 10.Lu M, Zhan X. The crucial role of multiomic approach in cancer research and clinically relevant outcomes. EPMA J. 2018;9(1):77–102. doi: 10.1007/s13167-018-0128-8. [DOI] [PMC free article] [PubMed] [Google Scholar]
- 11.Fröhlich H, Patjoshi S, Yeghiazaryan K, Kehrer C, Kuhn W, Golubnitschaja O. Premenopausal breast cancer: potential clinical utility of a multi-omics based machine learning approach for patient stratification. EPMA J. 2018;9(2):175–186. doi: 10.1007/s13167-018-0131-0. [DOI] [PMC free article] [PubMed] [Google Scholar]
- 12.Berliner L, Lemke HU, van Sonnenberg E, Ashamalla H, Mattes MD, Dosik D, et al. Model-guided therapy for hepatocellular carcinoma: a role for information technology in predictive, preventive and personalized medicine. EPMA J. 2014;5(1):16. doi: 10.1186/1878-5085-5-16. [DOI] [PMC free article] [PubMed] [Google Scholar]
- 13.Hänzelmann S, Castelo R, Guinney J. GSVA: gene set variation analysis for microarray and RNA-seq data. BMC Bioinformatics. 2013;14(1):7. doi: 10.1186/1471-2105-14-7. [DOI] [PMC free article] [PubMed] [Google Scholar]
- 14.Langfelder P, Horvath S. WGCNA: an R package for weighted correlation network analysis. BMC Bioinformatics. 2008;9(1):559. doi: 10.1186/1471-2105-9-559. [DOI] [PMC free article] [PubMed] [Google Scholar]
- 15.Wang Y, Xin S, Zhang K, Shi R, Bao X. Low GAS5 levels as a predictor of poor survival in patients with lower-grade gliomas. J Oncol. 2019;2019:15. doi: 10.1155/2019/1785042. [DOI] [PMC free article] [PubMed] [Google Scholar]
- 16.Wilkerson MD, Hayes DN. ConsensusClusterPlus: a class discovery tool with confidence assessments and item tracking. Bioinformatics. 2010;26(12):1572–1573. doi: 10.1093/bioinformatics/btq170. [DOI] [PMC free article] [PubMed] [Google Scholar]
- 17.Tibshirani R. Regression shrinkage and selection via the lasso. J R Stat Soc Ser B Methodol. 1996;58(1):267–288. [Google Scholar]
- 18.Lendahl U, Lee KL, Yang H, Poellinger L. Generating specificity and diversity in the transcriptional response to hypoxia. Nat Rev Genet. 2009;10(12):821. doi: 10.1038/nrg2665. [DOI] [PubMed] [Google Scholar]
- 19.Bubnov R, Polivka J, Zubor P, Konieczka K, Golubnitschaja O. “Pre-metastatic niches” in breast cancer: are they created by or prior to the tumour onset? “Flammer Syndrome” relevance to address the question. EPMA J. 2017;8(2):141–157. doi: 10.1007/s13167-017-0092-8. [DOI] [PMC free article] [PubMed] [Google Scholar]
- 20.Clausson C-M, Grundberg I, Weibrecht I, Nilsson M, Söderberg O. Methods for analysis of the cancer microenvironment and their potential for disease prediction, monitoring and personalized treatments. EPMA J. 2012;3(1):7. doi: 10.1007/s13167-012-0140-3. [DOI] [PMC free article] [PubMed] [Google Scholar]
- 21.Josifova T, Plestina-Borjan I, Henrich PB. Proliferative diabetic retinopathy: predictive and preventive measures at hypoxia induced retinal changes. EPMA J. 2010;1(1):73–77. doi: 10.1007/s13167-010-0003-8. [DOI] [PMC free article] [PubMed] [Google Scholar]
- 22.Kwon TJ, Ro JY, Mackay B. Clear-cell carcinoma: an ultrastructural study of 57 tumors from various sites. Ultrastruct Pathol. 1996;20(6):519–527. doi: 10.3109/01913129609016356. [DOI] [PubMed] [Google Scholar]
- 23.Gameiro PA, Yang J, Metelo AM, Pérez-Carro R, Baker R, Wang Z, et al. In vivo HIF-mediated reductive carboxylation is regulated by citrate levels and sensitizes VHL-deficient cells to glutamine deprivation. Cell Metab. 2013;17(3):372–385. doi: 10.1016/j.cmet.2013.02.002. [DOI] [PMC free article] [PubMed] [Google Scholar]
- 24.Papandreou I, Cairns RA, Fontana L, Lim AL, Denko NC. HIF-1 mediates adaptation to hypoxia by actively downregulating mitochondrial oxygen consumption. Cell Metab. 2006;3(3):187–197. doi: 10.1016/j.cmet.2006.01.012. [DOI] [PubMed] [Google Scholar]
- 25.Bensaad K, Favaro E, Lewis CA, Peck B, Lord S, Collins JM, et al. Fatty acid uptake and lipid storage induced by HIF-1α contribute to cell growth and survival after hypoxia-reoxygenation. Cell Rep. 2014;9(1):349–365. doi: 10.1016/j.celrep.2014.08.056. [DOI] [PubMed] [Google Scholar]
- 26.Sena CM, Bento CF, Pereira P, Seiça R. Diabetes mellitus: new challenges and innovative therapies. EPMA J. 2010;1(1):138–163. doi: 10.1007/s13167-010-0010-9. [DOI] [PMC free article] [PubMed] [Google Scholar]
- 27.Zhou H, Tang K, Liu H, Zeng J, Li H, Yan L, et al. Regulatory network of two tumor-suppressive noncoding RNAs interferes with the growth and metastasis of renal cell carcinoma. Mol Ther Nucleic Acids. 2019;16:554–565. doi: 10.1016/j.omtn.2019.04.005. [DOI] [PMC free article] [PubMed] [Google Scholar]
- 28.Zhang C, Kuang M, Li M, Feng L, Zhang K, Cheng S. SMC4, which is essentially involved in lung development, is associated with lung adenocarcinoma progression. Sci Rep. 2016;6:34508. doi: 10.1038/srep34508. [DOI] [PMC free article] [PubMed] [Google Scholar]
- 29.Zhang C, Zhu C, Chen H, Li L, Guo L, Jiang W, et al. Kif18A is involved in human breast carcinogenesis. Carcinogenesis. 2010;31(9):1676–1684. doi: 10.1093/carcin/bgq134. [DOI] [PubMed] [Google Scholar]
- 30.Nagahara M, Nishida N, Iwatsuki M, Ishimaru S, Mimori K, Tanaka F, et al. Kinesin 18A expression: clinical relevance to colorectal cancer progression. Int J Cancer. 2011;129(11):2543–2552. doi: 10.1002/ijc.25916. [DOI] [PubMed] [Google Scholar]
- 31.Ye L, Li F, Song Y, Yu D, Xiong Z, Li Y, et al. Overexpression of CDCA7 predicts poor prognosis and induces EZH2-mediated progression of triple-negative breast cancer. Int J Cancer. 2018;143(10):2602–2613. doi: 10.1002/ijc.31766. [DOI] [PubMed] [Google Scholar]
- 32.Network CGAR. Comprehensive molecular characterization of clear cell renal cell carcinoma. Nature. 2013;499(7456):43. doi: 10.1038/nature12222. [DOI] [PMC free article] [PubMed] [Google Scholar]
Associated Data
This section collects any data citations, data availability statements, or supplementary materials included in this article.
Supplementary Materials
(CSV 31 kb)
(CSV 888 bytes)
(CSV 8 kb)
Data Availability Statement
The datasets supporting the conclusions of this article are available in the Xena browser (https://xenabrowser.net/) repository.


