

Abstract
The identification of biomarkers that discriminate individual ageing trajectories is a principal target of ageing research. Some of the most promising predictors of biological ageing have been developed using DNA methylation. One recent candidate, which tracks age-related phenotypes in addition to chronological age, is ‘DNAm PhenoAge’. Here, we performed a phenome-wide association analysis of this biomarker in a cohort of older adults to assess its relationship with a comprehensive set of both historical, and contemporaneously-measured, phenotypes. Higher than expected DNAm PhenoAge compared with chronological age, known as epigenetic age acceleration, was found to associate with a number of blood, cognitive, physical fitness and lifestyle variables, and with mortality. Notably, DNAm PhenoAge, assessed at age 70, was associated with cognitive ability at age 11, and with educational attainment. Adjusting for age 11 cognitive ability attenuated the majority of the cross-sectional later-life associations between DNAm PhenoAge and health outcomes. These results highlight the importance of early life factors on healthy older ageing.
Subject terms: Genetics, Genomics
Introduction
A key objective in ageing research is the development of biomarkers that distinguish individuals on different ageing trajectories. Owing to the distinct and calculable pattern of age-related changes in DNA methylation across the genome with chronological age, a number of DNA methylation-based biomarkers of ageing, or ‘epigenetic clocks’, have been developed. Accelerated epigenetic ageing has been linked with a number of age-related morbidities and with increased risk of mortality1,2. Whereas the first-generation of epigenetic clocks were developed using solely chronological age as the reference, a more-recent effort additionally incorporated age-related phenotypes including blood cell profiles and inflammatory markers3. This newer clock, termed DNAm PhenoAge, aimed to capture a truer and more efficacious epigenetic biomarker of physiological age, one which discriminates morbidity and mortality more definitively among individuals of the same chronological age.
DNAm PhenoAge was found to associate with diverse morbidities and mortality, with improved predictive power over other epigenetic clocks3. However, many of the associations were with general composite indices of health outcomes, rather than individual phenotypes. Moreover, the associations between DNAm PhenoAge and early life factors are currently unknown. It has been acknowledged that childhood and life-course traits and circumstances might have an enduring impact on later health. For example, greater childhood deprivation, lower childhood intelligence, relatively little formal education, and more manual adult occupations have been associated with increased morbidity and mortality risk in older age4–7. Accordingly, for a more complete picture of the validity of DNAm PhenoAge, in addition to testing its relationship with individual ageing outcomes and mortality, it would be desirable to examine whether it can be predicted by these life history variables.
Here, we conduct a phenome-wide association study (PheWAS), in which multiple phenotypes are related to a single outcome, to investigate the link between accelerated DNAm PhenoAge and a comprehensive set of both historical, and contemporaneously-assessed, phenotypes in a large, longitudinal cohort study of ageing: the Lothian Birth Cohort 1936 (LBC1936). This cohort is unusually valuable because data are available on their general cognitive ability and social circumstances at age 11, which can inform the understanding of possible early life confounders of later-life outcomes.
Methods
Study population
The Lothian Birth Cohort 1936 (LBC1936) is a longitudinal study of ageing. The cohort comprises a community-dwelling sample of participants born in 1936, most of whom undertook a general intelligence test—the Moray House Test No. 12—in 1947, aged ~11 years. In total 1091 participants were recruited to the study at a mean age of ~70 years (Wave 1), and have subsequently been re-examined at three furthers waves, aged ~73, 76 and 79 years. Participants have been comprehensively phenotyped at each wave of the study with data collected on cognitive measures, physical and health outcomes, genetics, lifestyle factors and psycho-social aspects of ageing. Full details on the background, recruitment and data collection procedures of the study are provided elsewhere8,9.
Ethics and consent
Ethical permission for LBC1936 was obtained from the Multi-Centre Research Ethics Committee for Scotland (MREC/01/0/56) and the Lothian Research Ethics Committee (Wave 1: LREC/2003/2/29) and the Scotland A Research Ethics Committee (Waves 2, 3 and 4: 07/MRE00/58). Written informed consent was obtained from all participants.
LBC1936 DNA methylation
The LBC1936 methylation profiling has been fully detailed previously10,11. In brief, DNA was extracted from whole-blood samples at Wave 1 (baseline—age ~70 years) of the study and methylation was measured at 485,512 probes. Quality control analysis resulted in the removal of CpG sites with a low detection rate (<95% at p < 0.01). Probes with low quality (inadequate hybridisation, bisulfite conversion, nucleotide extension, and staining signal) were additionally identified and removed after manual inspection of the array control probe signals. Finally, probes with a low call rate (<450,000 probes detected at p < 0.01), XY probes and samples in which the predicted sex did not match the reported sex, were excluded.
DNAm PhenoAge
The DNAm PhenoAge biomarker was developed in a two-step process by Levine et al.3. In brief, a novel measure of ‘phenotypic age’ was developed using penalised regression where the hazard of ageing-related mortality was regressed on 42 clinical markers from the third National Health and Nutrition Examination Survey (NHANES-III; n = 9926, age: >20 years). The optimal model selected nine variables (albumin, creatinine, serum glucose (HbA1c), C-reactive protein (CRP), percentage lymphocytes, mean cell volume, red cell distribution width, alkaline phosphatase, and white blood cell count) in addition to chronological age for inclusion in the phenotypic age predictor. This predictor was derived independently of DNA methylation data. Phenotypic age was then calculated in an independent data set—the Invecchiare in Chianti (InCHIANTI) cohort (n = 456 at two time-points, age range: 21–100 years)12. Finally, a penalised regression model of DNA methylation on phenotypic age in InCHIANTI generated a DNA methylation proxy of phenotypic age (labelled DNAm PhenoAge) based on methylation profiles at 513 CpGs. DNAm PhenoAge allows for an estimate of phenotypic age from a single array, obviating the need for multiple assays to measure the nine blood-based components of phenotypic age.
DNAm PhenoAge was calculated in LBC1936 by multiplying CpG methylation levels with the regression weights from the above analysis3. One CpG (cg06533629) from the 513 used in the original computation was not available in the LBC1936 methylation data. At Wave 1, 889 individuals (81.5%) within the LBC1936 cohort had full methylation data available for the calculation of DNAm PhenoAge.
Phenotypic data
The PheWAS included 107 phenotypes broadly associated with health and wellbeing. The phenotypes encompassed seven subgroups: blood, cardiovascular, cognitive, personality and mood, lifestyle, physical, and life history, and were measured on a binary (n = 15), continuous (n = 89), or ordinal (n = 3) scale. Six of the phenotypes included in the PheWAS (white cell counts, blood glucose, CRP, creatinine, albumin and mean cell volume) were incorporated in the original phenotypic age estimate.
Descriptive statistics for the phenotypes are presented in Supplementary Table 1. Data collection protocols are detailed in Supplementary File 1 and have been described fully previously13.
Statistical analysis
DNAm PhenoAge acceleration (DNAm PhenoAgeAccel)—defined as the residuals resulting from regressing DNAm PhenoAge on chronological age—was calculated for all participants at LBC1936’s Wave 1, at a mean age of 70 years. DNAm PhenoAgeAccel captures the difference between DNAm PhenoAge and chronological age, with positive values indicating a faster epigenetic ageing rate. The acceleration measure was used in analyses in order to account for the correlation between DNAm PhenoAge and chronological age.
Linear regression models were used to obtain the associations between the continuous variables with DNAm PhenoAgeAccel. All continuous variables were scaled to have a mean of zero and unit variance to ensure comparable effect sizes across all traits. Generalised linear models with a logit link function (logistic regression) were used to investigate the association between the binary variables and DNAm PhenoAgeAccel, and ordinal regression models were used for the ordered categorical measures of smoking (three levels), physical activity (five levels) and occupational social class (six levels). DNAm PhenoAgeAccel was the independent variable of interest in each regression model. Height and smoking status (Wave 1) were included as covariates in the models for lung function (forced expiratory volume FEV1; forced vital capacity: FVC; forced expiratory ratio: FER; and peak expiratory flow: PEF). All models were adjusted for chronological age and sex. To investigate the influence of childhood cognitive ability, all models that showed significant associations with DNAm PhenoAgeAccel were repeated adjusting for age 11 IQ scores.
In the longitudinal analysis, linear mixed-effects models were used to assess if baseline DNAm PhenoAgeAccel was associated with longitudinal change over the four waves of data (~70 years to ~79 years) in a subset of the cognitive and physical phenotypes that are known to decline with age and correlate with functional impairment. Here, Wave 1 DNAm PhenoAgeAccel was included as a fixed-effect interaction with chronological age, and participant was added as a random-effect intercept term. As above, height and smoking status were included in the models for lung function, and all models co-varied for sex. Cox proportional-hazard models were implemented for survival (time-to-death) analyses.
Given the correlation structure between phenotypes within each group, we applied correction for multiple testing using the false discovery rate (FDR) method to each group of variables individually14. We additionally tested how results changed using a more conservative Bonferroni adjustment; first, a principal component analysis was run on the 107 phenotypes, which indicated 80% of the variance was explained by 47 principal components. A Bonferroni correction of 0.05/47 (adjusted P < 0.001) was then applied.
Statistical analysis was conducted in R version 3.5.0 using the ‘lm’ and ‘glm’ function in the ‘stats’ library and the ‘lme4’, ‘lmerTest’, ‘rms’ and ‘Survival’ packages15–20.
Results
Cohort information
Details of the baseline (Wave 1) characteristics of LBC1936 are presented in Supplementary Table 1. In all, 49.5% of the cohort was female. Mean chronological age for both males and females was 69.5 years (SD 0.8) and mean DNAm PhenoAge was 57.8 years (females = 56.7 (SD = 8.1), males = 58.8 (SD 8.2)). The discrepancy between the chronological and epigenetic age measures is probably reflective of the overall good health of the cohort.
PheWAS
Only associations with an FDR-corrected significant p value (<0.05) are presented here and in Fig. 1. P values represent the significance of the association between DNAm PhenoAgeAccel and individual phenotypes. Full results are presented in Supplementary Figs 1–7 and Supplementary Table 2.
Fig. 1. FDR-corrected significant associations between DNAm PhenoAgeAccel and blood, cognitive, lifestyle, physical and life-history variables.

Standardised model β coefficients (for continuous variables) or log odds (for binary variables) are presented along the x axes. Phenotypes are presented along the y axes. Error bars show the 95% confidence interval. CRP: C-reactive protein; Dep: deprivation; VPA: verbal paired associates; verb: verbal; NART: National Adult Reading Test; MMSE: Mini-Mental State Examination; grip: grip strength; FEV1: forced expiratory volume in 1 s; FVC: forced vital capacity; ADL: activities of daily living (Townsend Disability Scale).
Blood
Significant associations between DNAm PhenoAgeAccel and blood phenotypes are presented in Fig. 1. Full results are presented in Supplementary Fig. 1 and Supplementary Table 2. Of the six measures included in the phenotypic age reference, three significant positive associations were found with DNAm PhenoAgeAccel: white cell counts (β = 0.22, SE = 0.03, p = 2.5 × 10⁻⁹) HbA1c (β = 0.13, SE = 0.03, p = 5.8 × 10⁻⁴) and C-reactive protein (CRP; β = 0.11, SE = 0.03, p = 0.006).
Significant positive relationships were additionally identified between DNAm PhenoAgeAccel and neutrophils (β = 0.25, SE = 0.03, p = 2.9 × 10⁻¹²), monocytes (β = 0.14, SE = 0.03, p = 1.6 × 10⁻⁴) and fibrinogen (β = 0.09, SE = 0.03, p = 0.043). A negative association was found between DNAm PhenoAgeAccel and total cholesterol levels (β = −0.09, SE = 0.03, p = 0.043).
Cardiovascular
No significant associations were found between DNAm PhenoAgeAccel and any of the cardiovascular variables (Supplementary Fig. 2 and Supplementary Table 2, FDR- corrected p ≥ 0.12).
Cognitive
Significant associations between DNAm PhenoAgeAccel and cognitive phenotypes are presented in Fig. 1. Full results are presented in Supplementary Fig. 3 and Supplementary Table 2. Higher DNAm PhenoAgeAccel associated with lower scores on one test of the processing speed domain (digit symbol coding: β = −0.11, SE = 0.03, p = 0.015), one test of the memory domain (verbal paired associates: β = −0.09, SE = 0.03, p = 0.034), the mini-mental state examination (β = −0.10, SE = 0.03, p = 0.034) and two tests of crystallised ability (national adult reading test: β = −0.09, SE = 0.03, p = 0.034; verbal fluency: β = −0.09, SE = 0.03, p = 0.034).
Personality and mood
No significant associations were found between DNAm PhenoAgeAccel and any of the personality and mood phenotypes (Supplementary Fig. 4 and Supplementary Table 2).
Physical
Significant associations between DNAm PhenoAgeAccel and physical phenotypes are presented in Fig. 1. Full results are presented in Supplementary Fig. 5 and Supplementary Table 2. We found significant inverse associations between DNAm PhenoAgeAccel and FEV1 (β = −0.07, SE = 0.02, p = 0.023), FVC (β = −0.07, SE = 0.02, p = 0.023), and grip strength in both right and left hands (both: β = −0.05, SE = 0.02, p = 0.045). Higher DNAm PhenoAgeAccel was associated with a self-reported diagnosis of diabetes (OR = 1.39, 95% CI (1.01, 1.78), p = 0.038), a slower six metre walk time (β = 0.01, SE = 0.03, p = 0.038), and a higher score on the Townsend’s Disability Scale (activities of daily living; β = 0.09, SE = 0.03, p = 0.045).
Lifestyle
Significant associations between DNAm PhenoAgeAccel and lifestyle phenotypes are presented in Fig. 1. Full results are presented in Supplementary Fig. 6 and Supplementary Table 2. A significant inverse association was found between baseline DNAm PhenoAgeAccel and the deprivation index, such that a higher epigenetic age associated with a score indicative of greater deprivation (β = −0.08, SE = 0.03, p = 0.025). In addition, a higher DNAm PhenoAgeAccel was associated with lower levels of physical activity (OR = 0.77, 95% CI (0.67, 0.88), p = 0.0003) and with higher odds of being either a current, or an ex-, smoker, compared with a never smoker (OR = 1.31, 95% CI (1.15, 1.49), p = 0.0003).
Life-history
Significant associations between DNAm PhenoAgeAccel and life history phenotypes are presented in Fig. 1. Full results are presented in Supplementary Fig. 7 and Supplementary Table 2. A higher baseline DNAm PhenoAgeAccel was associated with a lower age 11 IQ (β = −0.13, SE = 0.03, p = 0.001) and fewer years of education (β = −0.09, SE = 0.03, p = 0.013).
Sensitivity analysis
A Bonferroni correction (adjusted P < 0.001) resulted in the attenuation of 15 of the 24 originally significant associations identified with DNAm PhenoAgeAccel. Age 11 IQ, smoking and physical activity remained significant, in addition to the cognitive test of processing speed (digit symbol coding) and five of the blood variables. These results are presented in Supplementary Table 2.
DNAm PhenoAge and survival
We tested the association of DNAm PhenoAge with all-cause mortality (ndeaths = 209, over 9 years of follow-up, average age of death = 76.8 years, SD 3.3) and found that a higher DNAm PhenoAgeAccel was significantly associated with risk of death (HR = 1.17 per SD increase in DNAm PhenoAgeAccel, 95% CI (1.02, 1.34), p = 0.025). A Kaplan–Meier survival curve for DNAm PhenoAgeAccel, split into highest and lowest quartiles, is presented in Fig. 2, illustrating the higher mortality risk for those with a higher DNAm PhenoAgeAccel.
Fig. 2.
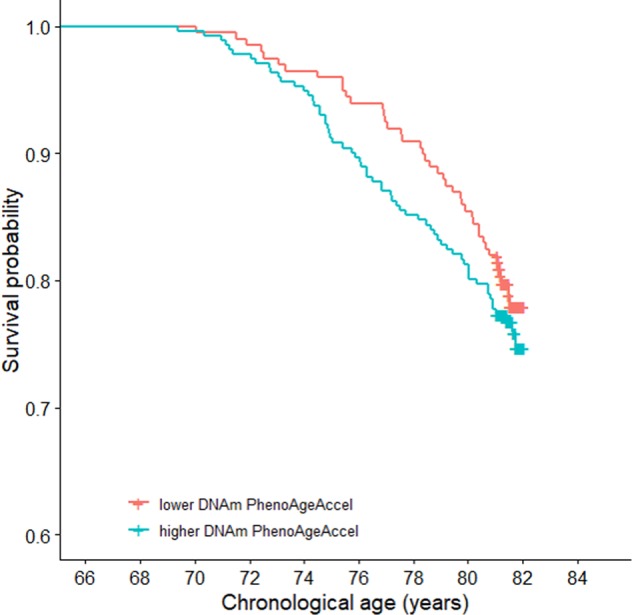
Survival probability by quartiles of DNAm PhenoAgeAccel adjusted for sex and chronological age.
To assess the performance of DNAm PhenoAgeAccel in relation to mortality risk, we ran additional survival analyses using other markers previously associated with mortality21–24. Each of the assessed markers outperformed DNAm PhenoAgeAccel: BMI (HR = 1.21 per SD increase in BMI, 95% CI (1.07, 1.38), p = 0.003), smoking status (HR = 1.78 for ex-smokers, 95% CI (1.29, 2.45), p = 0.0004; HR = 4.38 for current smokers, 95% CI (3.01, 6.36), p = 9.23 × 10⁻¹⁵), grip strength (HR = 0.63 per SD increase in mean grip strength, 95% CI (0.51, 0.78), p = 1.59 × 10⁻⁵) and walking speed (HR = 1.39 per SD increase in walking speed, 95% CI (1.27, 1.52), p = 1.74 × 10⁻¹²). Kaplan–Meier plots for each of these variables are presented in Supplementary Fig. 8.
Adjusting for Age 11 IQ
To test for potential confounding of the associations by childhood intelligence, the models for all of the significant associations identified in the PheWAS were re-run adjusting for age 11 IQ. Results are presented in Fig. 1 and Table 1.
Table 1.
Results before and after adjusting models for age 11 IQ.
| Before age 11 IQ adjustment | After age 11 IQ adjustment | |||||
|---|---|---|---|---|---|---|
| Phenotype | Standardised β | Standard error | FDR-corrected p | Standardised β | FDR-corrected p | % attenuation |
| Neutrophils | 0.245 | 0.033 | 9.26 × 10⁻¹² | 0.241 | 3.47 × 10⁻¹¹ | 1.7 |
| White cell count | 0.222 | 0.034 | 8.24 × 10⁻⁹ | 0.214 | 4.22 × 10⁻⁸ | 3.7 |
| Monocytes | 0.143 | 0.033 | 5.3 × 10⁻⁴ | 0.143 | 2.72 × 10⁻⁴ | 0 |
| HbA1c | 0.129 | 0.033 | 0.002 | 0.110 | 0.004 | 14.5 |
| C-reactive protein | 0.112 | 0.033 | 0.012 | 0.108 | 0.006 | 3.2 |
| Forced expiratory volume (1 s) | −0.108 | 0.023 | 0.023 | −0.076 | 0.006 | 30 |
| Forced vital capacity | −0.089 | 0.023 | 0.023 | −0.069 | 0.008 | 22.1 |
| Cholesterol | −0.086 | 0.032 | 0.043 | −0.088 | 0.021 | −2.6 |
| Fibrinogen | 0.089 | 0.034 | 0.043 | 0.074 | 0.062 | 16.6 |
| Grip strength (r) | −0.053 | 0.022 | 0.045 | −0.046 | 0.062 | 13.3 |
| 6-m walk time (s) | 0.097 | 0.035 | 0.037 | 0.073 | 0.068 | 24.9 |
| Deprivation index | −0.082 | 0.033 | 0.025 | −0.061 | 0.088 | 25.8 |
| Digit symbol coding | −0.11 | 0.033 | 0.015 | −0.057 | 0.089 | 48.1 |
| Grip strength (l) | −0.053 | 0.021 | 0.045 | −0.040 | 0.094 | 25.3 |
| Activities of daily living | 0.086 | 0.034 | 0.045 | 0.062 | 0.098 | 27.6 |
| Mini-mental state examination | −0.095 | 0.034 | 0.034 | −0.048 | 0.140 | 49.2 |
| Verbal paired associates | −0.087 | 0.034 | 0.034 | −0.051 | 0.142 | 41.9 |
| Years of education | −0.09 | 0.033 | 0.012 | −0.039 | 0.216 | 56.3 |
| Verbal fluency | −0.087 | 0.033 | 0.034 | −0.040 | 0.216 | 53.5 |
| National adult reading test | −0.087 | 0.033 | 0.034 | −0.015 | 0.536 | 82.4 |
| Log odds | ||||||
| Smoking category | 0.267 | 0.067 | 0.002 | 0.224 | 0.004 | 16.2 |
| Physical activity | −0.266 | 0.069 | 0.002 | −0.242 | 0.003 | 8.9 |
| Diabetes | 0.335 | 0.124 | 0.002 | 0.303 | 0.039 | 9.7 |
Standardised β are presented for continuous variables and log odds for binary or ordinal phenotypes. FDR-corrected significant results are highlighted in bold
The associations with 12 out of the 23 phenotypes that were originally found to be significant in the PheWAS, became non-significant upon adjustment, inclusive of all the cognitive associations. Of the associations that became non-significant, the effect sizes were attenuated by a mean of 39% (range: 13.4–82.4%). The survival model was also no longer significant following adjustment for age 11 IQ (HR = 1.13, 95% CI (0.98, 1.31), p = 0.08).
All of the associations with blood phenotypes, excepting fibrinogen, remained significant following adjustment for age 11 IQ, as did the lung function measures, smoking status, physical activity and diabetes.
Longitudinal association between DNAm PhenoAgeAccel and phenotypes
All the cognitive and physical fitness measures included in the longitudinal analysis showed changes over time that were consistent with declining health (Supplementary Table 3). The rate of decline ranged from 0.02 SDs per year (digit span backwards) to 0.08 SDs per year (telomere length). Six metre walk time increased by 0.1 SDs per year (all p ≤ 2 × 10⁻⁸).
Baseline DNAm PhenoAgeAccel was not found to associate with subsequent change in any of the assessed phenotypes (FDR-corrected p ≥ 0.322, Table 2).
Table 2.
Longitudinal associations between baseline DNAm PhenoAgeAccel and phenotypes.
| Phenotype | Standardised β | Standard error | Raw p | FDR-corrected p |
|---|---|---|---|---|
| Grip strength (r) | 0.010 | 0.008 | 0.189 | 0.448 |
| Grip strength (l) | 0.008 | 0.008 | 0.288 | 0.448 |
| Forced expiratory volume (1s) | 0.009 | 0.008 | 0.261 | 0.448 |
| Forced vital capacity | 0.011 | 0.009 | 0.192 | 0.448 |
| Forced expiratory ratio | 0.021 | 0.015 | 0.175 | 0.448 |
| Peak expiratory flow | 0.006 | 0.011 | 0.613 | 0.859 |
| Digit span backwards | <0.001 | 0.013 | 0.952 | 0.952 |
| Symbol search | −0.003 | 0.013 | 0.821 | 0.952 |
| Digit symbol coding | 0.019 | 0.009 | 0.046 | 0.322 |
| Matrix reasoning | 0.004 | 0.013 | 0.713 | 0.908 |
| Letter number sequencing | −0.018 | 0.013 | 0.180 | 0.448 |
| Block design | −0.011 | 0.011 | 0.282 | 0.448 |
| 6-m walk time (s) | <0.001 | 0.014 | 0.945 | 0.952 |
| Telomere length | −0.025 | 0.012 | 0.041 | 0.322 |
Significant values are bold
Discussion
In this study, we performed a comprehensive phenome-wide association study to investigate the associations between 107 phenotypes with a new epigenetic estimate of health—DNAm PhenoAge—in a large cohort of older adults. We identified significant correlations at a mean age of 70 years between accelerated DNAm PhenoAge and a number of blood-based, physical, cognitive, and lifestyle phenotypes, in addition to mortality. Importantly, we found that the life-history variables of general cognitive ability, measured at age 11, and number of years of education, related to DNAm PhenoAge at age 70. Moreover, adjustment for age 11 cognitive ability attenuated the majority of the cross-sectional later-life associations between DNAm PhenoAge and health outcomes.
DNAm PhenoAge was developed referencing a surrogate measure of phenotypic age, instead of solely chronological age, in an attempt to better capture the considerable between-person disparities in susceptibility to disease and death. However, our findings suggest that this novel epigenetic clock may be somewhat qualified in its capacity as a biomarker of physiological ageing. Though we identified associations between DNAm PhenoAge and a number of pertinent ageing outcomes, including measures of age-related physical fitness, it did not appear to robustly capture morbidity and mortality outcomes. Although accelerated DNAm PhenoAge did associate with a higher risk of all-cause mortality, its performance was surpassed by four other biomarkers. In addition, we found no evidence to suggest that DNAm PhenoAgeAccel associates with longitudinal phenotypic change, limiting its potential as a prospective biomarker of ageing.
The association between DNAm PhenoAgeAccel with IQ measured almost 60 years previously is a key finding and is indicative of a lifelong, enduring association between cognition and epigenetic ageing. This bolsters cognitive epidemiology findings indicating that general intelligence in childhood, as measured by psychometric tests, is associated with substantial life-course differences in health and morbidity25,26. Various, non-exclusive, mechanisms are thought to govern this association, including better health literacy and disease management, higher socioeconomic standing, and the ‘system integrity’ hypothesis, which postulates that higher scores on cognitive ability tests are capturing a systemic level of good functioning rather than isolated brain efficiency27. It is possible that individual differences in DNAm PhenoAgeAccel in older age are, in part, caused by intelligence differences over the life-course, or that both are a result of a shared genetic architecture or early environmental event.
All of the associations found between DNAm PhenoAgeAccel and contemporaneous cognitive, physical fitness, education and socioeconomic status measures ceased to be significant following adjustment for age 11 IQ. The only exceptions were the measures of lung function, diabetes, blood biomarkers (that are highly correlated with the component parts of Phenotypic Age), smoking and physical activity. This indicates that the relationship between DNAm PhenoAgeAccel and the majority of our contemporaneously measured phenotypes may be partially mediated through childhood cognitive ability. These findings are consistent with a theory of reverse causation.
Although we focused on testing for confounding via adjustment for childhood cognitive ability, it is unlikely that is the sole confounding variable. For instance, life-course smoking and socioeconomic status are associated with accelerated DNAm PhenoAge and may similarly confound the identified associations. However, childhood intelligence typically predates these confounders, allowing for the stratification of individuals from a very young age, prior to the manifestation of other traits.
Strengths and limitations
This is the first independent test of DNAm PhenoAge in a large cohort of older adults with the availability of historical variables, as well as longitudinal measures for an extensive number of health and ageing-related phenotypes. Moreover, these data are available across the 8th decade, a time when risk of dementia and functional decline increases substantially. Critically, the availability of childhood IQ measures enabled us to show that many cross-sectional associations between DNAm PhenoAge and health are confounded by early life cognitive ability.
LBC1936 are a predominantly healthy older ageing cohort, reflected by the young estimation of DNAm PhenoAge compared with chronological age, which might preclude the generalisation of these findings to the broader ageing population. Furthermore, most of the disease assessments within the study are concluded from self-reports, which are often unreliable, limiting their use as indicators of verifiable pathologies. These aspects perhaps hindered additional findings of disease-related associations. In addition, it should be acknowledged that the blood cell profiles and inflammatory markers that DNAm PhenoAge approximates might affect, or be affected by, DNA methylation. Future studies using longitudinal data or causal inference methods may help determine the direction of these associations. Finally, the paucity of data sets with childhood intelligence, later-life phenotypes and methylation data complicates the further replication of our findings.
Conclusion
We have verified associations between an innovative marker of epigenetic age and a number of pertinent, proxy health-related phenotypes and mortality in older adults. Notably, educational attainment and cognitive ability and age 11 were found to associate with DNAm PhenoAge at age 70. Adjusting models for the latter of these attenuated over half of the late-life associations between health and DNAm PhenoAge by 13–82%. While it does seem DNAm PhenoAge may independently capture some measures of age-related functional fitness and blood-based phenotypes, it does not seem to robustly associate with health phenotypes and is vulnerable to confounding.
Supplementary information
Acknowledgements
We thank all LBC1936 study participants and research team members who have contributed, and continue to contribute, to ongoing LBC1936 studies. LBC1936 is supported by Age UK (Disconnected Mind programme) and the Medical Research Council (MR/M01311/1). This work was conducted within the Centre for Cognitive Ageing and Cognitive Epidemiology, which supports IJD and is funded by the Medical Research Council and the Biotechnology and Biological Sciences Research Council (MR/K026992/1). Methylation typing was supported by the Centre for Cognitive Ageing and Cognitive Epidemiology (Pilot Fund award), Age UK, The Wellcome Trust Institutional Strategic Support Fund, The University of Edinburgh, and The University of Queensland. AJS and RFH are supported by funding from the Wellcome Trust 4-year PhD in Translational Neuroscience—training the next generation of basic neuroscientists to embrace clinical research [108890/Z/15/Z]. DLMcC and REM are supported by Alzheimer’s Research UK major project grant ARUK-PG2017B-10. TSJ gratefully acknowledges funding from the UK Dementia Research Institute, European Research Council (ALZSYN), Alzheimer’s research UK, and Alzheimer’s Society. AMM is supported by funding from Wellcome Trust STRADL grant (reference 104036/Z/14/Z).
Data availability
The data set analysed during the current study are available on request from the Lothian Birth Cohort Study, Centre for Cognitive Ageing, and Cognitive Epidemiology, University of Edinburgh. The data are not publicly available as they contain information that could compromise participant consent and confidentiality.
Code availability
The code used in this analysis (including version information) can be accessed by contacting the corresponding author.
Conflict of interest
The authors declare that they have no conflict of interest.
Footnotes
Publisher’s note Springer Nature remains neutral with regard to jurisdictional claims in published maps and institutional affiliations.
Supplementary information
Supplementary Information accompanies this paper at (10.1038/s41398-019-0657-5).
References
- 1.Horvath S. DNA methylation age of human tissues and cell types. Genome Biol. 2013;14:R115. doi: 10.1186/gb-2013-14-10-r115. [DOI] [PMC free article] [PubMed] [Google Scholar]
- 2.Hannum G, et al. Genome-wide methylation profiles reveal quantitative views of human aging rates. Mol. Cell. 2013;49:359–367. doi: 10.1016/j.molcel.2012.10.016. [DOI] [PMC free article] [PubMed] [Google Scholar]
- 3.Levine ME, et al. An epigenetic biomarker of aging for lifespan and healthspan. Aging. 2018;10:573–591. doi: 10.18632/aging.101414. [DOI] [PMC free article] [PubMed] [Google Scholar]
- 4.Calvin CM, et al. BMJ. 2017. Childhood intelligence in relation to major causes of death in 68 year follow-up: prospective population study; p. j2708. [DOI] [PMC free article] [PubMed] [Google Scholar]
- 5.Cukic I, Brett CE, Calvin CM, Batty GD, Deary IJ. Childhood IQ and survival to 79: Follow-up of 94% of the Scottish Mental Survey 1947. Intelligence. 2017;63:45–50. doi: 10.1016/j.intell.2017.05.002. [DOI] [PMC free article] [PubMed] [Google Scholar]
- 6.Der G, Batty GD, Deary IJ. The association between IQ in adolescence and a range of health outcomes at 40 in the 1979 US National Longitudinal Study of Youth. Intelligence. 2009;37:573–580. doi: 10.1016/j.intell.2008.12.002. [DOI] [PMC free article] [PubMed] [Google Scholar]
- 7.Wraw C, Deary IJ, Gale CR, Der G. Intelligence in youth and health at age 50. Intelligence. 2015;53:23–32. doi: 10.1016/j.intell.2015.08.001. [DOI] [PMC free article] [PubMed] [Google Scholar]
- 8.Deary IJ, Gow AJ, Pattie A, Starr JM. Cohort profile: the Lothian Birth Cohorts of 1921 and 1936. Int. J. Epidemiol. 2012;41:1576–1584. doi: 10.1093/ije/dyr197. [DOI] [PubMed] [Google Scholar]
- 9.Taylor AM, Pattie A, Deary IJ. Cohort profile update: the Lothian Birth Cohorts of 1921 and 1936. Int. J. Epidemiol. 2018;47:1042–1042r. doi: 10.1093/ije/dyy022. [DOI] [PMC free article] [PubMed] [Google Scholar]
- 10.Shah S, et al. Genetic and environmental exposures constrain epigenetic drift over the human life course. Genome Res. 2014;24:1725–1733. doi: 10.1101/gr.176933.114. [DOI] [PMC free article] [PubMed] [Google Scholar]
- 11.Marioni RE, et al. DNA methylation age of blood predicts all-cause mortality in later life. Genome Biol. 2015;16:25. doi: 10.1186/s13059-015-0584-6. [DOI] [PMC free article] [PubMed] [Google Scholar]
- 12.Ferrucci L, et al. Subsystems contributing to the decline in ability to walk: bridging the gap between epidemiology and geriatric practice in the InCHIANTI study. J. Am. Geriatr. Soc. 2000;48:1618–1625. doi: 10.1111/j.1532-5415.2000.tb03873.x. [DOI] [PubMed] [Google Scholar]
- 13.Deary IJ, et al. The Lothian Birth Cohort 1936: a study to examine influences on cognitive ageing from age 11 to age 70 and beyond. BMC Geriatr. 2007;7:28–28. doi: 10.1186/1471-2318-7-28. [DOI] [PMC free article] [PubMed] [Google Scholar]
- 14.Benjamini Y, Hochberg Y. Controlling the false discovery rate: a practical and powerful approach to multiple testing. J. R. Stat. Soc. Ser. 1995;57:289–300. [Google Scholar]
- 15.Bates D, Maechler M, Bolker B, Walker S. Fitting linear mixed-effects models using lme4. J. Stat. Softw. 2015;67:1–48. doi: 10.18637/jss.v067.i01. [DOI] [Google Scholar]
- 16.Kuznetsova A, Brockhoff PB, Christensen RHB. lmerTest Package: tests in linear mixed effects models. J. Stat. Softw. 2017;82:1–26. doi: 10.18637/jss.v082.i13. [DOI] [Google Scholar]
- 17.Therneau T. M. A Package for Survival Analysis in S. 2015;(version 2.38).
- 18.RStudio Team (2016). RStudio: Integrated Development Environment for R: Boston, MA, USA.
- 19.Frank E Harrell Jr. rms: Regression Modeling Strategies. R package version 51-52 2018.
- 20.R Core Team. R: A Language and Environment for Statistical Computing. R Foundation for Statistical Computing 2018.
- 21.Jacobs DR, et al. Cigarette smoking and mortality risk: twenty-five–year follow-up of the seven countries study. JAMA Intern. Med. 1999;159:733–740. doi: 10.1001/archinte.159.7.733. [DOI] [PubMed] [Google Scholar]
- 22.Aune D, et al. BMJ. 2016. BMI and all cause mortality: systematic review and non-linear dose-response meta-analysis of 230 cohort studies with 3.74 million deaths among 30.3 million participants; p. i2156. [DOI] [PMC free article] [PubMed] [Google Scholar]
- 23.Studenski S, et al. Gait speed and survival in older adults. JAMA. 2011;305:50–58. doi: 10.1001/jama.2010.1923. [DOI] [PMC free article] [PubMed] [Google Scholar]
- 24.Prasitsiriphon O, Pothisiri W. Associations of grip strength and change in grip strength with all-cause and cardiovascular mortality in a European older population. Clin. Med Insights Cardiol. 2018;12:1179546818771894–1179546818771894. doi: 10.1177/1179546818771894. [DOI] [PMC free article] [PubMed] [Google Scholar]
- 25.Corley J, Cox SR, Deary IJ. Healthy cognitive ageing in the Lothian Birth Cohort studies: marginal gains not magic bullet. Psychological Med. 2018;48:187–207. doi: 10.1017/S0033291717001489. [DOI] [PubMed] [Google Scholar]
- 26.Wu YH, et al. Cognitive function in individuals with physical frailty but without dementia or cognitive complaints: results from the i-lan longitudinal aging study. J. Am. Med. Dir. Assoc. 2015;16:899.e899–816. doi: 10.1016/j.jamda.2015.07.013. [DOI] [PubMed] [Google Scholar]
- 27.Deary IJ. Looking for ‘system integrity' in cognitive epidemiology. Gerontology. 2012;58:545–553. doi: 10.1159/000341157. [DOI] [PubMed] [Google Scholar]
Associated Data
This section collects any data citations, data availability statements, or supplementary materials included in this article.
Supplementary Materials
Data Availability Statement
The data set analysed during the current study are available on request from the Lothian Birth Cohort Study, Centre for Cognitive Ageing, and Cognitive Epidemiology, University of Edinburgh. The data are not publicly available as they contain information that could compromise participant consent and confidentiality.
The code used in this analysis (including version information) can be accessed by contacting the corresponding author.