Abstract
We determined peripheral blood (PB) and biopsy (Bx) RNA expression signatures in a Brazilian and US cohort of kidney transplant patients. Phenotypes assigned by precise histology were: Acute Rejection, (AR) IFTA/Chronic Rejection (CR), excellent functioning transplants (TX), and Glomerulonephritis recurrence (GN). Samples were analyzed on microarrays and profiles from each cohort cross-validated on the other cohort with similar phenotypes. We discovered signatures for each tissue: 1) AR vs TX; 2) CR vs TX and 3) GN vs TX using the Random Forests algorithm. We validated biopsies signatures of AR vs TX (AUC 0.97) and CR vs TX (AUC 0.87). We also validated both PB and Bx signatures of AR vs TX and CR vs TX with varying degrees of accuracy. Several biological pathways were shared between AR and CR suggesting similar rejection mechanisms in these two clinical phenotypes. Thus, we identified gene expression signatures for AR and CR in transplant patients and validated them in independent cohorts of significantly different racial/ethnic backgrounds. These results reveal that there are strong unifying immune mechanisms driving transplant diseases and identified in the signatures discovered in each cohort suggesting that molecular diagnostics across populations are feasible despite ethnic and environmental differences.
Introduction
Interstitial Fibrosis/Tubular Atrophy (IFTA) and Acute Rejection (AR) are leading causes of late graft loss amongst kidney transplant patients. Despite huge strides in immunosuppressive regimens over the past few decades, the incidence of IFTA and AR has remained relatively flat with no beneficial decrease in improved long-term outcomes. The rates of subclinical Acute Rejection (subAR), a relatively newer clinical entity defined as the presence of histologically documented AR on a surveillance biopsy has also shown to be between 17%−23% (1–7). Arguably, the two major causes for the high rates of subAR, AR and IFTA are first, the lack of proper and accurate diagnostic tools to detect and treat these kidney phenotypes early during the post-transplant period and second, due to inadequate immunosuppression which is a possible cause of the latter. Despite being in the era of potent immunosuppressive agents we still rely on antiquated measures of graft injury such as serum creatinine which has shown to be both a lagging indicator of graft injury as well as a poor correlate of graft outcomes (8). Current diagnosis of the above clinical phenotypes also relies heavily on the kidney transplant biopsy which remains the gold standard despite its many disadvantages (9, 10).
Numerous studies have suggested the utility of non-invasive molecular biomarkers to monitor recipients of kidney transplants using urine and PB. Studies using urine qPCR have shown high diagnostic accuracy in separating AR from samples with stable graft function (11–13). Others have shown that gene signatures using DNA microarrays in the PB and then transferred to a qPCR platform have been able to distinguish kidney transplant phenotypes effectively(14–16).
We recently published molecular signatures in the PB of kidney transplant recipients that can distinguish AR from patients with stable graft function. Our discovery signatures were derived and validated in a US population which was predominantly Caucasian, and in a clinical setting typical of the standard of care in the US (17). There have been very few studies in the literature describing molecular signatures of AR or Chronic Rejection (CR) in the PB and/or biopsies of kidney transplant patients from other ethnic populations such as Asian and Latin American and certainly none describing genome-wide profiling signatures of these transplant disease phenotypes in this population. Molecular detection of subAR in peripheral blood has been previously addressed in studies. The kidney Solid Organ Response Test (kSORT), used in two studies (18, 19), primarily predicted acute rejection. In the AART study (18), only a small proportion of blood samples were paired with surveillance biopsies. Another study, of paired blood samples and biopsies, was able to discover GEPs for subAR in both the blood and graft compartments, but these were not subjected to external validation using independent cohorts (20). Instead, the authors showed in a proof-of-concept study that orthogonal validation could be achieved across different genomic technologies and platforms. The most comprehensive study till date is the CTOT-08 multicenter study which developed a blood-based molecular biomarker for subAR using peripheral blood paired with surveillance biopsies and strict clinical phenotyping algorithms for discovery and validation (21). At a predefined threshold, 72% to 75% of KT recipients achieved a negative biomarker test correlating with the absence of subAR (negative predictive value: 78%–88%), while a positive test was obtained in 25% to 28% correlating with the presence of subAR (positive predictive value: 47%–61%).
In the current study, we describe the discovery of microarray-based, PB and Bx gene expression signatures in Brazilian kidney transplant recipients capable of distinguishing biopsy documented AR, CR and TX. We also describe a novel proof-of-concept, internally validated signature for recurrent glomerulonephritis (GN). All discovery signature models were locked and externally validated on an independent cohort of US patients with similar histological phenotypes which were done as part of an NIH consortium, The Transplant Genomics Collaborative Group (TGCG). We also compared the differentially expressed genes in both blood and biopsies of AR and CR/IFTA using pathway mapping tools to assess whether there are shared and/or unique pathways in these different tissue compartments.
Methods
Clinical data for both cohorts were collected using an electronic medical report system. Inclusion criteria were recipients aged 18–70 years from either a living donor or a deceased donor with time post-transplant up to three months. Recipients of multiple organs or patients with inadequate kidney biopsies were excluded. The study was approved by the local Institutional Review Board and all patients provided written informed consent. The Brazilian cohort was from the University of Sao Paulo, Brazil. Samples were shipped for analysis at the Scripps Research Institute, La Jolla, CA. Inclusion and exclusion criteria were similar for both the cohorts.
Patient population
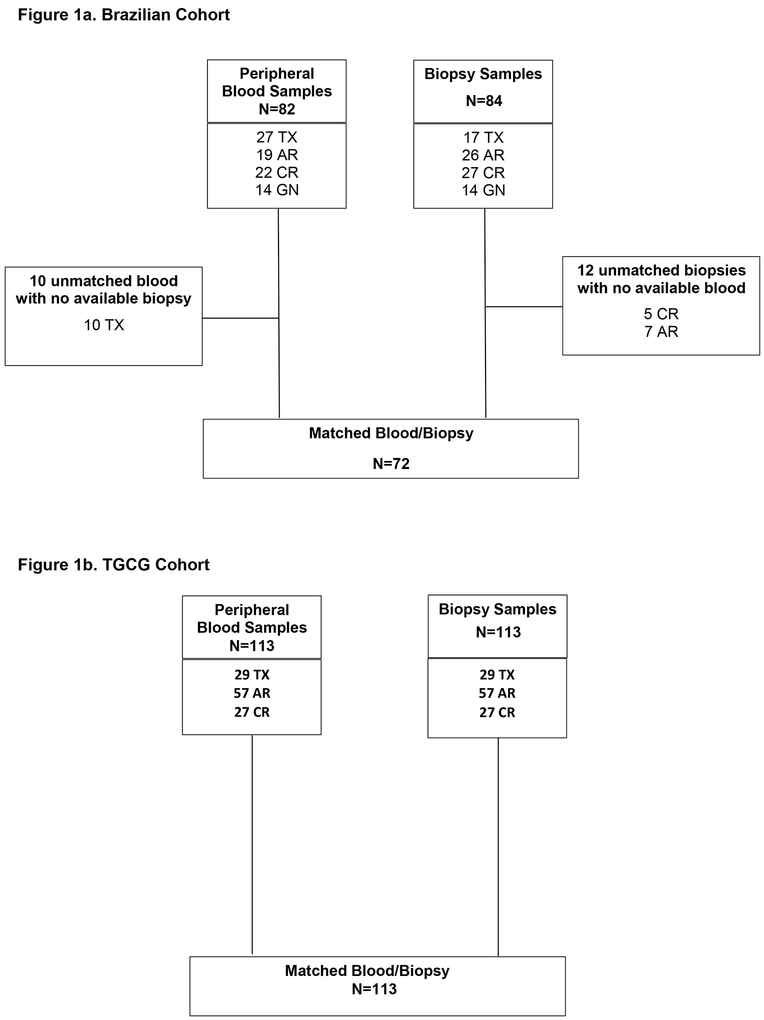
A total of 84 kidney transplant biopsies (“for cause”) of 84 patients collected between March 2012 and June 2013 were included in the study. Patients were assigned by histological phenotype into four groups: 1) Transplant excellent (TX) were considered excellent functioning Transplants (patients with stable eGFR >60 mL/min, no proteinuria and biopsy-proven normal histology); 2) Acute Rejection (AR) included T-cell Mediated Rejection and Borderline changes; 3) Chronic Rejection (CR) included IFTA and Chronic Active T-cell Mediated Rejection; 4) Glomerulonephritis (GN) was any kind of graft recurrence GN. Matched blood samples collected at the time of biopsy were available for 72 of the subjects. Ten patients from TX group did not have matched Bx and PB samples included were defined clinically as TX by eGFR>60 mL/min, no proteinuria in previous visits. The numbers of samples (peripheral blood/biopsy) for each group were: Transplant excellent (TX; PB=27/Bx=17), Acute Rejection (AR; PB=19/ Bx=26), IFTA/plus Chronic Active T-cell Mediated Rejection (CR PB=22/ Bx=27), and Glomerulonephritis recurrence (GN; n=14/Bx=14). The composition of phenotypes for blood and biopsy samples in discovered and validation cohorts is shown in Figure 1a and b.
Figure 1a& 1b.
Composition of phenotypes for blood and biopsy samples in the discovery (1a) and validation (1b) cohort.
All patients received induction with thymoglobulin (Genzyme, Cambridge, USA) or Basiliximab (Novartis, Basel, Switzerland) and maintenance therapy with a calcineurin inhibitor (tacrolimus or cyclosporine), an antimetabolite (azathioprine or mycophenolate mofetil) and prednisone. Estimated GFR (eGFR) was calculated using the abbreviated Modification of Diet in Renal Disease (MDRD-4) formula(22). Validation of phenotype-specific signatures was performed on a similar clinically and histologically defined cohort of 113 matched blood and biopsy samples from the TGCG biorepository. The phenotypes analyzed were Transplant excellent (TX; PB=29/Bx=29), Acute Rejection (AR; PB=57/ Bx=57), IFTA/plus Chronic Active T-cell Mediated Rejection (CR PB=27/ Bx=27). Demographics and clinical characteristics of both cohorts are described in Tables 1a and b.
Table 1A.
Demographics and clinical data of Brazilian patients grouped by histological phenotypes.
| AR n=26 |
CR n=27 |
GN n=14 |
TX n=17 |
p | |
|---|---|---|---|---|---|
| Recipient age (years) | 42 ± 3 | 40 ± 2 | 47 ± 3 | 48 ± 3 | NS |
| Female recipients (%) | 11 (48%) | 13 (48%) | 6 (43%) | 8 (47%) | NS |
| Recipient race (W/NW) | 6/20 | 10/17 | 11/3 | 10/7 | 0.05 |
| Deceased donor (%) | 13 (50%) | 14 (52%) | 6 (43%) | 4 (24%) | NS |
| HLA mismatch | 3.2 ± 0.3 | 2.3 ± 0.3 | 2.6 ± 0.4 | 2.8 ± 0.4 | NS |
| PRA ≥ 20 (%) | 6 (27%) | 6 (%) | 5 (36%) | 4 (23.5%) | NS |
| Induction therapy‡ (%) | 26 (100%) | 26 (96%) | 13 (93%) | 15 (88%) | NS |
| C4d positive | 3 (11%) | 4 (15%) | 0 | 0 | NS |
| Time to biopsy (median months; IQR) | 13 (6 – 30) | 48 (24 – 90) | 50 (27 −140) | 36 (27–65) | 0.001 |
| eGFR (mL/min/1.73m2) (median ; IQR) | 28.4 (17.5 – 41.8) | 28.9 (26.0 – 38.3) | 24.2 (18.2 – 39.5) | 72.8 (58.2 – 83.8) | 0.001 |
| IS at biopsy TAC/EC-MPS/Pred (%) | 20 | 18 | 8 | 11 | NS |
| CSA/EC-MPS/Pred (%) | 1 | 1 | 2 | 0 | NS |
| mTORi/TAC/Pred (%) | 3 | 3 | 0 | 2 | NS |
| mTORi/EC-MPS/Pred (%) | 2 | 3 | 1 | 3 | NS |
| Others | 0 | 2 | 3 | 1 | NS |
| Death-censored graft loss | 8 (35%) | 10 (37%) | 9 (64%) | 0 | NS |
| Patient death (%) | 1 (3.8%) | 2 (7%) | 1 (7%) | 0 | NS |
| Donor age (years) | 43 ± 10 | 47 ± 12 | 48 ± 13 | 39 ± 9 | NS |
| Female donor (%) | 20 (77%) | 11 (41%) | 7 (50%) | 11 (65%) | 0.03 |
Values are expressed as mean ± standard deviation unless otherwise indicated. interquartile range (IQR); NS, not significant; AR, Acute Rejection; CR (IFTA/Chronic rejection); GN, glomerular disease recurrence; TX, excellent functioning kidney; HLA, Human Leukocyte Antigen; PRA, Panel Reactive Antibody; W; white; NW (black, brown and mulatto).
Table 1B.
Demographics and clinical data of TGCG patients grouped by histological phenotypes.
| AR n=57 |
CR n=27 |
TX n=29 |
p | |
|---|---|---|---|---|
| Recipient age (years) | 44.7+13.9 | 45.1+15.7 | 52.9+14.2 | NS |
| Female recipients (%) | 33.3 | 44.4 | 24.4 | NS |
| Recipient race (W/NW) | 38.6/61.4 | 46.3/53.7 | 72.4/27.6 | 0.01 |
| Deceased donor (%) | 63.2 | 61.1 | 44.8 | 0.04 |
| HLA mismatch | 5.0+2.0 | 5.0+2.0 | 4.38+3.4 | NS |
| PRA ≥ 20 (%) | 13.1 | 19.4 | 25.0 | NS |
| Induction therapy‡ (%) | 35.1 | 37.1 | 44.8 | NS |
| Time to biopsy (median months; IQR) | 34.7+39.2 | 55.9+48.1 | 32.3+47.6 | 0.01 |
| IS at biopsy TAC/MMF/Pred (%) | 48.0 | 43.1 | 86.3 | NS |
| CSA/MMF/Pred (%) | 28.0 | 29.4 | 4.6 | NS |
| mTORi/MMF/Pred (%) | 20.0 | 15.7 | 4.6 | NS |
| Donor age (years) | 40.3+13.9 | 41.1+15.2 | 38.9+14.3 | NS |
| Female donor (%) | 43.9 | 59.3 | 24.4 | 0.005 |
| Creatinine | 3.4+2.8 | 3.1+2.2 | 2.1+1.9 | 0.03 |
Values are expressed as mean ± standard deviation unless otherwise indicated. NS, not significant; AR, Acute Rejection; CR (IFTA/Chronic rejection); TX, excellent functioning kidney; HLA, Human Leukocyte Antigen; PRA, Panel Reactive Antibody; W; white; NW (Non-White – other races).
Histological analysis
Allograft tissue was obtained under ultrasound guidance by a 16-gauge Tru-Cut needle. In addition to a standard histopathology core, another core was collected for gene expression studies. All biopsies were evaluated by light microscopy and immunofluorescence and classified by the Banff 2013 (discovery cohort) (23) and Banff 2007 (validation cohort) criteria (24). C4d staining was performed by immunofluorescence (IF) (25). Diagnosis was done first by a local pathologist and the reports reviewed by CV and DRS to make final phenotypic assignments (discovery) and by a site-specific local pathologist and a central TGCG pathologist (validation). Both assessments (local and central) were performed blinded to the microarray results.
Gene expression analysis
Biopsy cores were placed in RNALater (Qiagen, Valencia, CA), at room temperature for 4 hours, and then transferred to −80 °C. For whole-blood, 2.5 mL of peripheral blood was collected into PAXgene tubes (Qiagen, Valencia, CA) containing an RNA-stabilizing solution and then transferred to −80 °C. Total RNA was extracted from kidney tissue using (21) Trizol (Life Technologies Inc, MD, USA). Biotinylated cRNA was prepared using Ambion Message Amp Biotin II kit (Ambion) and hybridized on Affimetrix Human Genome U133 Plus 2.0 Arrays (Affymetrix Inc, Santa Clara, California) according to standard protocols (http://affymetrix.com/index.affx). Differential expression was performed using linear models and differential expression for microarray data (LIMMA) (26) and class predictions using the Random Forests algorithm with bootstrapping employing custom R scripts (21)
Classifier development and external validation
All signatures were derived using a Random Forests algorithm with bootstrapping (R package e1071;https://cran.r-project.org/web/packages/e1071/index.html). Signatures were tested for accuracy using a range of feature sizes (50– 500 probesets) from the list of significantly differentially expressed genes. Once the signatures were determined they were “locked” and tested on the appropriate external validation cohort of similar phenotypes. Signatures were discovered in both cohorts and cross-validated on the other cohort respectively, except for the GN cohort whose molecular signatures, we report for the first time in this study. Threshold selection was based on “out-of-bag” performance metrics of the discovery cohort. Based on dichotomous outcomes (either positive or negative predicted probabilities above or below the threshold), profiles were compared with the clinical phenotypes to determine the performance of the classifiers. We selected a random forests model optimizing for area under the curve and then selected the “best” predicted probability threshold for each classifier based on its overall performance on the discovery cohort.
Diagnostic Metrics
Predictive accuracy was calculated as (true positives + true negatives)/(true positives + false positives + false negatives + true negatives). Sensitivity, Specificity, PPV, NPV, and AUC were calculated and Receiver operating characteristic (ROC) curves generated using pROC(27). Pathway mapping was performed using Ingenuity Pathway Analsyis (Qiagen, Valencia, CA). Chi-square analysis was done using GraphPad (GraphPad Software, La Jolla California USA). CEL files and normalized signal intensities will be posted at the NIH Gene Expression Omnibus http://www.ncbi.nlm.nih.gov/geo.
Results
Clinical characteristics of Brazilian cohort
The median time to biopsy for AR was shorter compared toCR and GN phenotypes (Table 1a). The AR and CR groups had a significantly higher non-white recipient race. Female donors were higher in the AR and TX groups. As expected, MDRD was significantly higher in transplant excellent (TX) compared with the other three groups of patients.
Clinical characteristics of TGCG cohort
There were significant differences in recipient race (more Caucasians in the TX group), more deceased donors in the AR and CR groups and higher time to Bx in the CR group (Table 1b). There were also a higher number of female donors in the AR and CR group while the creatinine was higher as expected in the AR and CR groups.
Discovery of gene expression signatures and shared genes in the Brazilian phenotypes
Using the gene expression data from the PB and the Bx in the Brazilian cohort, we identified three signatures for each tissue type: 1) AR vs. TX; 2) CR vs TX and 3) GN vs. TX. There were 1044 and 1388 differentially expressed genes for the AR vs. TX and CR vs. TX comparisons respectively at a False Discovery rate (FDR) of 5% in the PB. For the biopsies, there were as many as 12766 differentially expressed genes for the AR vs. TX and 1422 differentially expressed genes and CR vs. TX respectively, at FDR<5%.
In blood, there were ~18% shared genes between AR and CR comparisons. Interestingly all 30% of the shared genes were differentially expressed in the same direction (up or downregulated) in the AR and CR PB samples. In the Bx, there was a significantly higher shared expression (~94%), again with all genes differentially expressed in the same direction.
There were 622 genes that were differentially expressed between the GN and TX PB at an FDR<10%. There was higher sharing of differentially expressed genes between GN and CR (44%) when compared to GN and AR (17%) in the PB, but a similar difference was not observed for the same comparisons in the Bx (2694 differentially expressed genes) where the sharing was 71% and 86%, respectively.
Pathway mapping of peripheral blood samples:
We mapped the differentially expressed genes from each comparison (AR vs. TX and CR vs. TX) to canonical pathways using Ingenuity Pathway Analysis (IPA). There were 7 significant pathways in the AR vs. TX comparison after applying a Benjamini Hochberg correction for False Discovery (p<0.05). In contrast, for the CR vs. TX comparison, there were 11 significant pathways. The Ephrin receptor signaling pathways was the only shared pathway between AR and CR. We did not validate any of the AR vs. TX or CR vs TX significant pathways from the Brazilian cohort in the US cohort. A list of all PB significant pathways from both cohorts is shown in Supplementary Table 1.
Pathway mapping of biopsies:
In the Bx, here were 54 significant pathways in the AR vs. TX and for the CR vs. TX comparison, there were 5 significant pathways. In the Bx, 6 and 25 pathways were shared between AR and CR in the Brazilian an US cohorts. A list of all PB significant pathways from both cohorts is shown in Supplementary Table 2. We validated 16 pathways for AR vs. TX comparison from the Brazilian cohort in the US cohort and for the CR vs. TX comparisons (Supplementary Table 3), we validated 4 pathwaysfrom the Brazilian cohort in the external cohort (Supplementary Table 4). The AR and CR comparison showed ~89% shared expression, again with all genes differentially expressed in the same direction.
Discovery of gene expression signatures and shared genes in the US (TGCG) phenotypes
In the US cohort, we also identified three signatures for each tissue type: 1) AR vs. TX; 2) CR vs TX and 3) GN vs. TX. There were 520 and 4521 differentially expressed genes for the AR vs. TX and CR vs. TX comparisons respectively at a False Discovery rate (FDR) of 5%. For the biopsies, there were 8793 differentially expressed genes for the AR vs. TX and 7191 differentially expressed genes and CR vs. TX respectively, at FDR<10%.
In blood, there were ~86% shared genes between AR and CR comparisons and in the Bx, there was 76% sharing, again with all genes differentially expressed in the same direction.
Comparison of gene expression profiles in the biopsies and peripheral blood
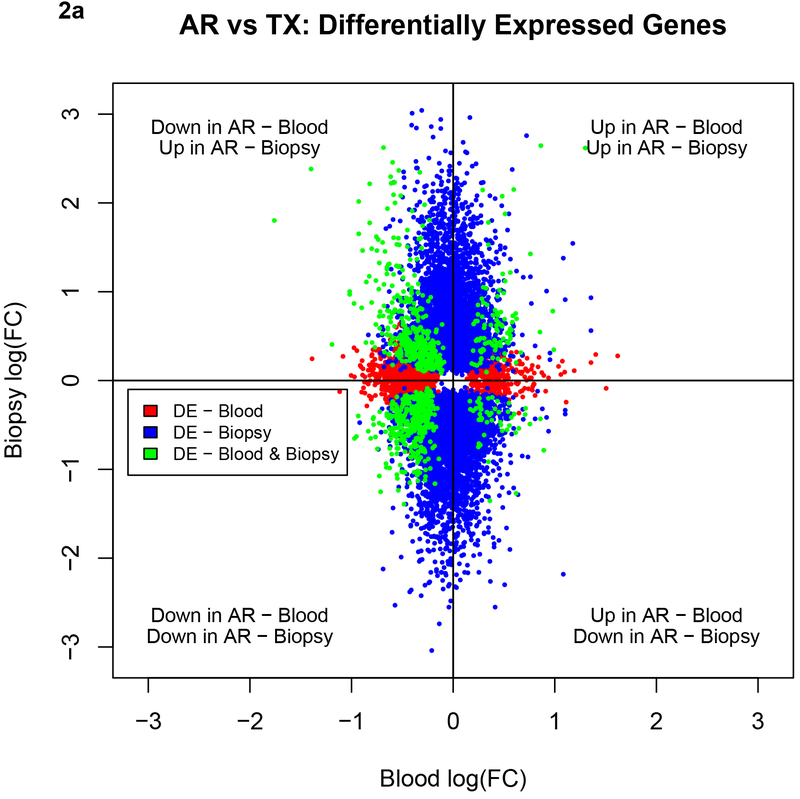
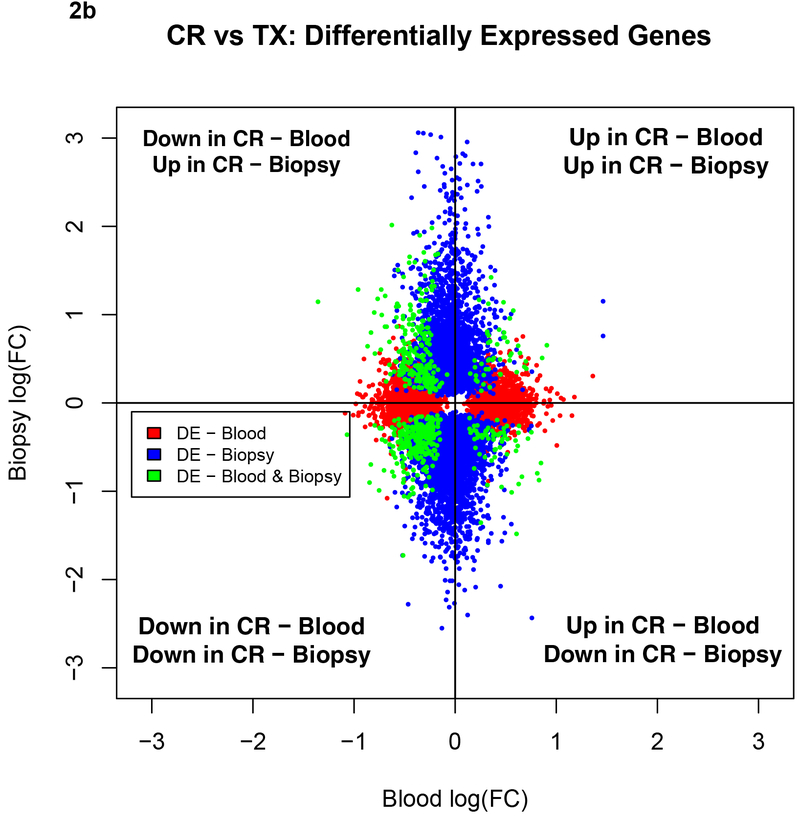
We compared the gene expression profiles in the PB and Bx for the AR vs. TX and CR vs. TX phenotypes. For the AR vs. TX, there were 435 differentially expressed genes found in both PB and Bx up or downregulated in the same direction. Similarly, for the CR vs. TX, there were 314 differentially expressed genes found in both blood and biopsy up or downregulated in the same direction.
We also illustrate the sharing between the blood and the biopsy compartments for AR vs. TX and CR vs. TX in Figures 2a and 2b. The plots show that for both the AR and CR comparisons there were more shared downregulated genes and that the PB had fewer differentially expressed genes when compared to the Bx.
Figure 2a.
Comparison of the directionality of fold changes for AR vs. TX among shared genes and DEGs in the blood and biopsies by microarrays. Blue dots denote DEGs in biopsies, red dots denote DEGs in blood and green dots shared genes between biopsies and blood. Acute Rejection; DEG, differentially expressed genes; TX, transplant excellent.
Figure 2b.
Comparison of the directionality of fold changes for CR vs. TX among shared genes and DEGs in the blood and biopsies by microarrays. Blue dots denote DEGs in biopsies, red dots denote DEGs in blood and green dots shared genes between biopsies and blood. DEGs, differentially expressed genes; CR, IFTA/Chronic Rejection; TX, transplant excellent.
Discovery and validation of gene expression signatures
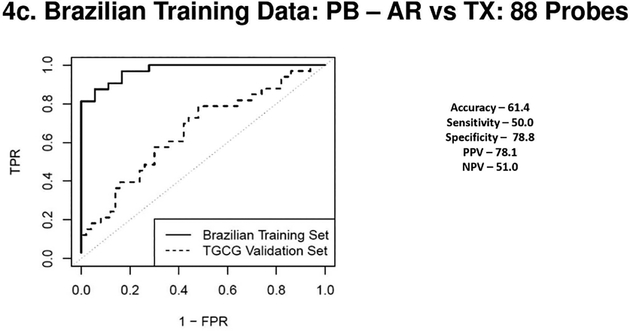
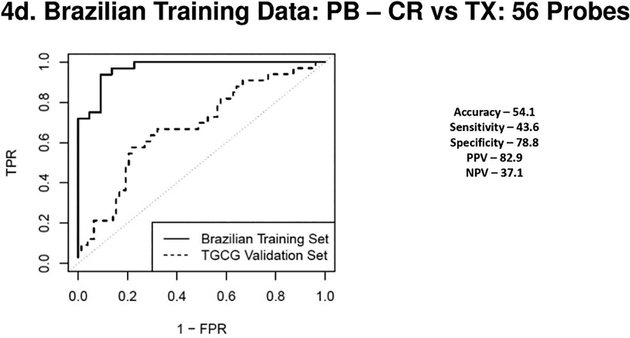
For blood, the internal validation of an AR vs TX classifier in the Brazilian cohort comprised of 88 probesets gave an Area Under the Curve (AUC) of 0.97. This translated to 79% specificity and 50% sensitivity on the TGCG cohort. Similarly, a 56 probeset classifier distinguished the CR vs. TX samples on the Brazilian discovery cohort with an AUC of 0.97 which had a specificity of 79% and sensitivity of44% in the TCGG cohort.
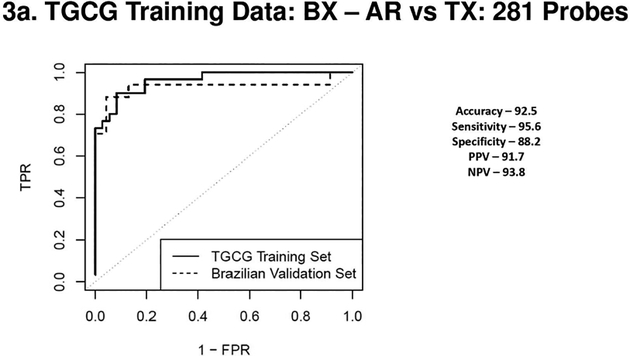
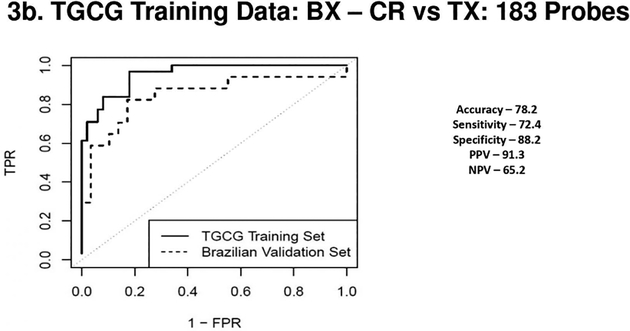
When signatures were discovered in the blood in the TGCG cohort and validated on the Brazilian cohort the AR vs TX classifier comprised on 281 probes (AUC – 0.96) validated very well with an 88% specificity and 96% sensitivity on the Brazilian cohort. A 183 probeset classifier distinguished the CR vs. TX phenotypes (AUC of 0.95) with a specificity of 88% and sensitivity of 72% in the Brazilian cohort.
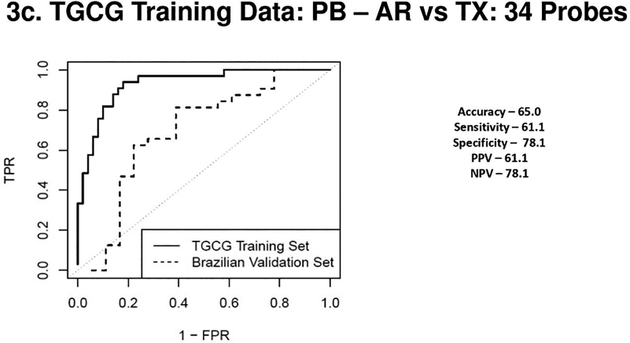
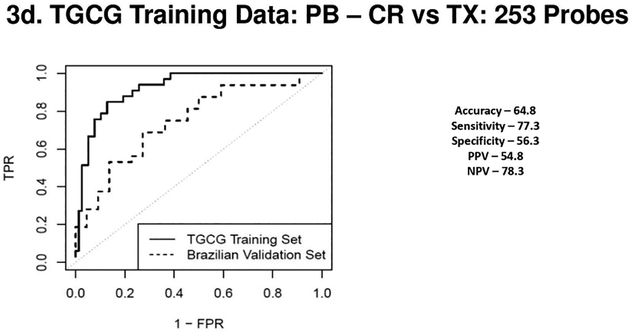
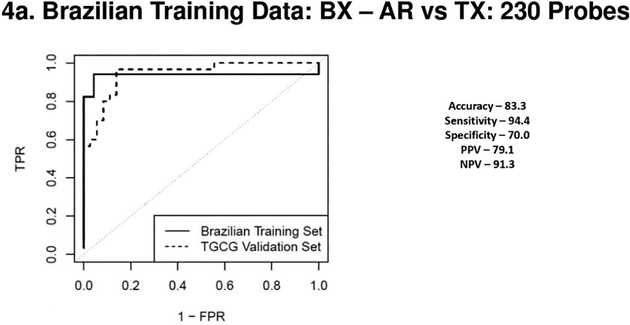
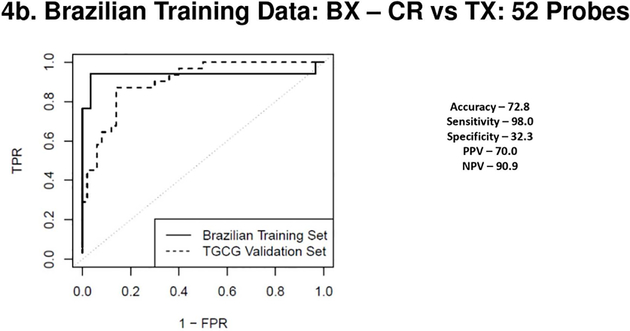
For the biopsies a 230 probeset AR vs TX classifier (Brazilian cohort, AUC of 0.94), validated the TCCG cohort with 70% specificity and 94% sensitivity. For the CR vs TX comparison, a 52 probeset (AUC of 0.94), had a specificity of only 32% but was highly sensitive at 98%. The AUC’s on the external cohort showed expected reductions for both the PB and tissue profiles. ROC curves from both blood and biopsy samples discovered in the Brazilian cohort and validated in the TGCG cohort are shown in Figures 3 a–d and ROC curves discovered on the TGCG cohort and validated on the Brazilian cohort are shown in Figures 4 a–d. Of note, in the Brazilian PB classifier there was a shift towards a higher specificity at the cost of decreased sensitivity in the external TGCG cohort, but this trend was not seen in the TGCG PB classifier. The overall the results from the external validation cohorts were comparable to the results seen in the internal validation, showing that the identified classifiers were robust in a blinded external validation using a “locked” classifier.
Figure 3a 3b 3c & 3d.
(3a) Receiver Operating Characteristic Curves from biopsies for AR vs. TX. ROC in solid line represents the performance of the AR vs TX biopsy classifier on the TGCG Training Set (AUC - 0.96) and the ROC in the dotted line represents the performance of the AR vs TX biopsy classifier on the Brazilian Validation Set (AUC - 0.93). (3b) Receiver Operating Characteristic Curves from biopsies for CR vs. TX. ROC in solid line represents the performance of the CR vs TX biopsy classifier on the TGCG Training Set (AUC - 0.95) and the ROC in the dotted line represents the performance of the CR vs TX biopsy classifier on the Brazilian Validation Set (AUC - 0.85). (3c) Receiver Operating Characteristic Curves from peripheral blood for AR vs. TX. ROC in solid line represents the performance of the AR vs TX blood classifier on the TGCG Training Set (AUC - 0.93) and the ROC in the dotted line represents the performance of the AR vs TX blood classifier on the Brazilian Validation Set (AUC - 0.69). (3d) Receiver Operating Characteristic Curves from peripheral blood for CR vs. TX. ROC in solid line represents the performance of the CR vs TX blood classifier on the TGCG Training Set (AUC - 0.92) and the ROC in the dotted line represents the performance of the CR vs TX blood classifier on the Brazilian Validation Set (AUC - 0.75). AR, Acute Rejection; CR, IFTA/Chronic Rejection; TX, transplant excellent.
Figure 4a, 4b, 4c & 4d.
(4a) Receiver Operating Characteristic Curves from biopsies for AR vs. TX. ROC in solid line represents the performance of the AR vs TX biopsy classifier on the Brazilian Validation Set (AUC - 0.94) and the ROC in the dotted line represents the performance of the AR vs TX biopsy classifier on the TGCG Training Set (AUC - 0.94). (4b) Receiver Operating Characteristic Curves from biopsies for CR vs. TX. ROC in solid line represents the performance of the CR vs TX biopsy classifier on the Brazilian Validation Set (AUC - 0.94) and the ROC in the dotted line represents the performance of the CR vs TX biopsy classifier on the TGCG Training Set (AUC - 0.90). (4c) Receiver Operating Characteristic Curves from peripheral blood for AR vs. TX. ROC in solid line represents the performance of the AR vs TX blood classifier on the Brazilian Validation Set (AUC - 0.97) and the ROC in the dotted line represents the performance of the AR vs TX blood classifier on the TGCG Training Set (AUC - 0.66). (4d) Receiver Operating Characteristic Curves from peripheral blood for CR vs. TX. ROC in solid line represents the performance of the CR vs TX blood classifier on the Brazilian Validation Set (AUC - 0.97) and the ROC in the dotted line represents the performance of the CR vs TX blood classifier on the TGCG Training Set (AUC - 0.68). AR, Acute Rejection; CR, IFTA/Chronic Rejection; TX, transplant excellent.
We also compared our blood classifier gene lists to those of the kSORT assay. Only one of the 17 genes in the kSORT, Natural Killer Trigger Receptor (NKTR) was also identified in our signature. A similar comparison of a tissue-based classifier comprised of 30 genes (28) capable of identifying TCMR showed no overlap with genes identified in our biopsy classifiers.
Discussion
We describe a microarray-based, PB and Bx gene expression signatures in a Brazilian and a US cohort of kidney transplant patients capable of distinguishing biopsy documented AR, CR/IFTA and transplant excellent TX. We also show a first proof-of-concept, internally validated signature for recurrent Glomerulonephritis (GN) in the Brazilian population. Since a semi-invasive test is amenable to serial profiling, the primary goal was to establish signatures from PB and Bx in two ethnically diverse populations of kidney transplant recipients, first a Latin-American population from Brazil and second a US population that is ethnically different and predominantly Caucasian. We wanted to test the hypothesis that these signatures will validate in the other population to provide a proof of concept that despite ethnic differences, there are signatures that are robust enough in both populations to distinguish kidney transplant dysfunction phenotypes.
Our discovery gene signatures from biopsies in both cohorts show robust AUCs for both AR (AUC 94–96%) and CR (AUC 94–95%) classifiers. In, the PB there were similar discovery cohort AUCs: AR vs. TX (AUC 93–97%) and CR vs. TX (AUC 92–97%). However, since the true value can only be established in an external independent cohort we tested the classifiers discovered in one cohort on the other. The accuracies for the Bx was higher (73–93%) compared to the PB (54–65%). However, strategic optimization based on sensitivity or specificity (56–79%) of the test can improve the clinical utility of the classifier for a physician looking for a specific type of diagnostic. A possible use of the classifier in the peripheral blood could be as a “rule out test” or “rule in” test based on NPV and PPV for AR and CR in the external validations. An example would be the FDA approved Allomap (XDx, Inc., South San Francisco, CA) heart test that identifies heart transplant patients with stable allograft function and is used to rule out the presence of acute cellular rejection in low-risk patients, between six months and five years after heart transplant. The Allomap test has NPVs >97% but PPV <10% (29). Another example would be the subAR classifier recently published by us which had NPVs ranging from 78–88% but PPVs of only 47–61% (21). Therefore, the Bx classifiers outperformed the PB classifiers though all classifiers validated satisfactorily in an ethnically diverse population of patients suggesting potential common mechanisms in play for acute and chronic rejection in unrelated ethnicities.
Our results in the tissue demonstrate a high number of shared genes between AR and CR in the biopsies (~89%) with all genes differentially expressed in the same direction. There was lesser sharing (~30%) of genes in the PB between AR and CR. However, all shared genes were directionally the same (up or downregulated) in AR and CR suggesting similar mechanisms. The higher number of shared genes in the biopsies is not surprising since the tissue is the site of injury, whereas the PB may only mirror some of the injury processes and the constant fluctuations in the cell subsets may make this a dynamic process. We recently showed using gene expression profiles of 234 graft biopsy samples, that IFTA (CR) phenotypes were strongly enriched for dysregulated gene pathways and were shared by the biopsy profiles of AR, including IFTA samples without histological evidence of inflammation (30).
Our hypothesis that ethnic differences though relevant, may not be the major factor driving transcriptomic changes in acute and chronic rejection, is further strengthened by our results comparing the pathways between the two cohorts where validated common pathways in both the blood and the biopsy for AR and CR. Shared pathways and their constituent genes reveal common mechanistic insights into the rejection process as well as reassure a clinician that gene expression signatures from one ethnic cohort can be used in an ethnically different population. We also recently demonstrated that there are a number of shared differentially expressed genes and pathways between subAR and AR using microarray and sequencing platforms strongly suggesting that these two clinical phenotypes form a continuum of alloimmune activation(20). However, our signatures need to be tested in a prospective study in both the Brazilian population as well as other ethnic groups.
The absence or a low overlap in terms of genes between our classifiers and previously published classifiers does not necessarily mean that the genes comprised of any classifiers are irrelevant. Classifiers genes are usually picked based on the best performance in a training set of samples and often many hundreds of genes that are not picked as part of a final classifier are still able to distinguish phenotypes. However, the any best-performing classifier has to be locked down and then validated an independent cohort of samples. Therefore, it is possible that genes which may have not been chosen in a given classifier have the potential to be good candidates for classification. Therefore, a simple comparison between two published classifier sets though intuitive is not likely to be the best way to identify genes relevant to a disease process. In the development of the kSORT assay for acute rejection classifier genes expanded to 17 from a first 5 gene set previously reported as part of the evolution of the test.
There are obvious limitations to this study. Firstly, this was a single center study in a Brazilian population which was validated in a cross-sectional external cohort that was ethnically different. While one of the objectives of this study was to test the performance of a gene expression classifier in a cross-ethnic cohort and since there are few studies that have evaluated gene expression signatures in an ethnically different population, we acknowledge that the ideal cohort for validation would have been a prospectively collected cohort which is currently underway. Though we were still adequately powered to perform gene expression analyses in both peripheral blood and biopsies, a larger sample size for the discovery cohort might have helped identify even more robust classifiers. However, the robustness of our signatures is reflected by the external validation accuracy and diagnostic metrics. Though we demonstrated a preliminary signature for glomerulonephritis, we unfortunately did not have an independent cohort to validate our finding. Finally, a proportion of our TX patients (10 (37%) did not have a biopsy but were designated as TX by clinical parameters. Therefore, (2–3 patients, 7–11%) of all TX patients could possibly have a subAR phenotype. We would however like to emphasize that our classifiers have been discovered and validated on subjects with active rejection (acute or chronic) and not on subclinical rejection phenotypes. Therefore, it is possible that our classifiers may incorrectly call these potential subAR phenotypes.
In conclusion, we present comprehensive gene expression profiling in both peripheral blood and matched biopsies in two cohorts of ethnically diverse kidney transplant patients with histological phenotypes of acute and chronic rejection and a proof of concept transplant glomerulonephritis signature. We cross-validated our blood and biopsy signatures for AR and CR in both cohorts with different racial/ethnic backgrounds. We show that there are shared pathways between AR and CR as well as between blood and biopsy suggesting similar mechanisms at play in the rejection processes. We hope this study will serve as the first step in the design of larger global cross-ethnic studies to refine diagnostic signatures and mechanistic pathways in kidney transplant rejection.
Supplementary Material
Acknowledgments
This study has been made possible by an NIH-funded grant (U19 AI063603) that supported TW, DRS and SMK and an International Society of Nephrology (ISN) fellowship to CGV.
Abbreviations
- AR
Acute Rejection
- AUC
Area Under the Curve
- CR
Chronic Rejection
- DEG
Differentially expressed genes
- eGFR
Estimated Glomerular Filtration Rate
- FDA
Food and Drug Administration
- FDR
False Discovery Rate
- GN
Glomerulonephritis recurrence
- IFTA
Interstitial Fibrosis/Tubular Atrophy
- IPA
Ingenuity Pathway Analysis
- KTPs
Kidney Transplant patients
- MDRD
Modification of Diet in Renal Disease
- NPV
Negative Predictive Value
- PPV
Positive Predictive Value
- qPCR
Real-Time Polymerase Chain Reaction
- ROC
Receiver Operating Curves
- subAR
Subclinical Acute Rejection
- TX
Transplant excellent
Footnotes
Disclosure
The authors of this manuscript have conflicts of interest to disclose as described by the American Journal of Transplantation. SK and TW have consulting agreements with Transplant Genomics Inc. The other authors have no conflicts of interest to disclose.
Supporting Information
Additional supporting information may be found online in the Supporting Information section at the end of this article.
References
- 1.Choi BS, Shin MJ, Shin SJ, Kim YS, Choi YJ, Kim YS et al. Clinical significance of an early protocol biopsy in living-donor renal transplantation: ten-year experience at a single center. Am J Transplant 2005;5(6):1354–1360. [DOI] [PubMed] [Google Scholar]
- 2.Nankivell BJ, Borrows RJ, Fung CL, O’Connell PJ, Allen RD, Chapman JR. Natural history, risk factors, and impact of subclinical rejection in kidney transplantation. Transplantation 2004;78(2):242–249. [DOI] [PubMed] [Google Scholar]
- 3.Nankivell BJ, Fenton-Lee CA, Kuypers DR, Cheung E, Allen RD, O’Connell PJ et al. Effect of histological damage on long-term kidney transplant outcome. Transplantation 2001;71(4):515–523. [DOI] [PubMed] [Google Scholar]
- 4.Roberts IS, Reddy S, Russell C, Davies DR, Friend PJ, Handa AI et al. Subclinical rejection and borderline changes in early protocol biopsy specimens after renal transplantation. Transplantation 2004;77(8):1194–1198. [DOI] [PubMed] [Google Scholar]
- 5.Seron D, Moreso F, Bover J, Condom E, Gil-Vernet S, Canas C et al. Early protocol renal allograft biopsies and graft outcome. Kidney Int 1997;51(1):310–316. [DOI] [PubMed] [Google Scholar]
- 6.Shapiro R, Randhawa P, Jordan ML, Scantlebury VP, Vivas C, Jain A et al. An analysis of early renal transplant protocol biopsies--the high incidence of subclinical tubulitis. Am J Transplant 2001;1(1):47–50. [DOI] [PMC free article] [PubMed] [Google Scholar]
- 7.Shishido S, Asanuma H, Nakai H, Mori Y, Satoh H, Kamimaki I et al. The impact of repeated subclinical acute rejection on the progression of chronic allograft nephropathy. J Am Soc Nephrol 2003;14(4):1046–1052. [DOI] [PubMed] [Google Scholar]
- 8.Yilmaz S, Isik I, Afrouzian M, Monroy M, Sar A, Benediktsson H et al. Evaluating the accuracy of functional biomarkers for detecting histological changes in chronic allograft nephropathy. Transpl Int 2007;20(7):608–615. [DOI] [PubMed] [Google Scholar]
- 9.Tondel C, Vikse BE, Bostad L, Svarstad E. Safety and complications of percutaneous kidney biopsies in 715 children and 8573 adults in Norway 1988–2010. Clin J Am Soc Nephrol 2012;7(10):1591–1597. [DOI] [PMC free article] [PubMed] [Google Scholar]
- 10.Whittier WL, Korbet SM. Timing of complications in percutaneous renal biopsy. J Am Soc Nephrol 2004;15(1):142–147. [DOI] [PubMed] [Google Scholar]
- 11.Li B, Hartono C, Ding R, Sharma VK, Ramaswamy R, Qian B et al. Noninvasive diagnosis of renal-allograft rejection by measurement of messenger RNA for perforin and granzyme B in urine. N Engl J Med 2001;344(13):947–954. [DOI] [PubMed] [Google Scholar]
- 12.Suthanthiran M, Muthukumar T. Urinary-cell mRNA and acute kidney-transplant rejection. The New England journal of medicine 2013;369(19):1860–1861. [DOI] [PubMed] [Google Scholar]
- 13.Suthanthiran M, Schwartz JE, Ding R, Abecassis M, Dadhania D, Samstein B et al. Urinary-cell mRNA profile and acute cellular rejection in kidney allografts. The New England journal of medicine 2013;369(1):20–31. [DOI] [PMC free article] [PubMed] [Google Scholar]
- 14.Li L, Khatri P, Sigdel TK, Tran T, Ying L, Vitalone MJ et al. A peripheral blood diagnostic test for acute rejection in renal transplantation. Am J Transplant 2012;12(10):2710–2718. [DOI] [PMC free article] [PubMed] [Google Scholar]
- 15.Roedder S, Li L, Alonso MN, Hsieh SC, Vu MT, Dai H et al. A Three-Gene Assay for Monitoring Immune Quiescence in Kidney Transplantation. J Am Soc Nephrol 2015;26(8):2042–2053. [DOI] [PMC free article] [PubMed] [Google Scholar]
- 16.Sarwal M, Chua MS, Kambham N, Hsieh SC, Satterwhite T, Masek M et al. Molecular heterogeneity in acute renal allograft rejection identified by DNA microarray profiling. N Engl J Med 2003;349(2):125–138. [DOI] [PubMed] [Google Scholar]
- 17.Kurian SM, Williams AN, Gelbart T, Campbell D, Mondala TS, Head SR et al. Molecular classifiers for acute kidney transplant rejection in peripheral blood by whole genome gene expression profiling. Am J Transplant 2014;14(5):1164–1172. [DOI] [PMC free article] [PubMed] [Google Scholar]
- 18.Roedder S, Sigdel T, Salomonis N, Hsieh S, Dai H, Bestard O et al. The kSORT assay to detect renal transplant patients at high risk for acute rejection: results of the multicenter AART study. PLoS Med 2014;11(11):e1001759. [DOI] [PMC free article] [PubMed] [Google Scholar]
- 19.Crespo E, Roedder S, Sigdel T, Hsieh SC, Luque S, Cruzado JM et al. Molecular and Functional Noninvasive Immune Monitoring in the ESCAPE Study for Prediction of Subclinical Renal Allograft Rejection. Transplantation 2017;101(6):1400–1409. [DOI] [PubMed] [Google Scholar]
- 20.Kurian SM, Velazquez E, Thompson R, Whisenant T, Rose S, Riley N et al. Orthogonal Comparison of Molecular Signatures of Kidney Transplants With Subclinical and Clinical Acute Rejection: Equivalent Performance Is Agnostic to Both Technology and Platform. Am J Transplant 2017;17(8):2103–2116. [DOI] [PMC free article] [PubMed] [Google Scholar]
- 21.Friedewald JJ, Kurian SM, Heilman RL, Whisenant TC, Poggio ED, Marsh C et al. Development and clinical validity of a novel blood-based molecular biomarker for subclinical acute rejection following kidney transplant. Am J Transplant 2019;19(1):98–109. [DOI] [PMC free article] [PubMed] [Google Scholar]
- 22.Levey AS, Bosch JP, Lewis JB, Greene T, Rogers N, Roth D. A more accurate method to estimate glomerular filtration rate from serum creatinine: a new prediction equation. Modification of Diet in Renal Disease Study Group. Ann Intern Med 1999;130(6):461–470. [DOI] [PubMed] [Google Scholar]
- 23.Haas M, Sis B, Racusen LC, Solez K, Glotz D, Colvin RB et al. Banff 2013 meeting report: inclusion of c4d-negative antibody-mediated rejection and antibody-associated arterial lesions. Am J Transplant 2014;14(2):272–283. [DOI] [PubMed] [Google Scholar]
- 24.Solez K, Colvin RB, Racusen LC, Haas M, Sis B, Mengel M et al. Banff 07 classification of renal allograft pathology: updates and future directions. Am J Transplant 2008;8(4):753–760. [DOI] [PubMed] [Google Scholar]
- 25.David-Neto E, David DS, Ginani GF, Rodrigues H, Souza PS, Castro MC et al. C4d staining in post-reperfusion renal biopsy is not useful for the early detection of antibody-mediated rejection when CDC crossmatching is negative. Nephrol Dial Transplant 2011;26(4):1388–1392. [DOI] [PubMed] [Google Scholar]
- 26.Smyth GK. LIMMA : Linear Models for Microarray Data In: Gentleman R, Carey V, Huber W, Irizarry R, Dudoit S, (eds). Bioinformatics and Computational Biology Solutions Using R and Bioconductor. New York: Springer-Verlag, 2005: 397–420. [Google Scholar]
- 27.Robin X, Turck N, Hainard A, Tiberti N, Lisacek F, Sanchez JC et al. pROC: an open-source package for R and S+ to analyze and compare ROC curves. BMC Bioinformatics 2011;12:77. [DOI] [PMC free article] [PubMed] [Google Scholar]
- 28.Reeve J, Sellarés J, Mengel M, Sis B, Skene A et al. Molecular Diagnosis of T Cell‐Mediated Rejection in Human Kidney Transplant Biopsies. Am J Transplant 2013; 13(3): 645–655. [DOI] [PubMed] [Google Scholar]
- 29.CareDx. The Standard of Care for the Management of Heart Transplant Patients. In.
- 30.Modena BD, Kurian SM, Gaber LW, Waalen J, Su AI, Gelbart T et al. Gene Expression in Biopsies of Acute Rejection and Interstitial Fibrosis/Tubular Atrophy Reveals Highly Shared Mechanisms That Correlate With Worse Long-Term Outcomes. Am J Transplant 2016;16(7):1982–1998. [DOI] [PMC free article] [PubMed] [Google Scholar]
Associated Data
This section collects any data citations, data availability statements, or supplementary materials included in this article.


