Abstract
Ferroptosis is a form of regulated cell death that is caused by the iron-dependent peroxidation of lipids1,2. The glutathione-dependent lipid hydroperoxidase glutathione peroxidase 4 (GPX4) prevents ferroptosis by converting lipid hydroperoxides into non-toxic lipid alcohols3,4. Ferroptosis has been implicated in the cell death that underlies several degenerative conditions2, and induction of ferroptosis by inhibition of GPX4 has emerged as a therapeutic strategy to trigger cancer cell death5. However, sensitivity to GPX4 inhibitors varies greatly across cancer cell lines6, suggesting that additional factors govern resistance to ferroptosis. Here, employing a synthetic lethal CRISPR/Cas9 screen, we identify ferroptosis suppressor protein 1 (FSP1) (previously known as apoptosis-inducing factor mitochondrial 2 (AIFM2)) as a potent ferroptosis resistance factor. Our data indicate that myristoylation recruits FSP1 to the plasma membrane where it functions as an oxidoreductase that reduces coenzyme Q10 (CoQ), generating a lipophilic radical-trapping antioxidant (RTA) that halts the propagation of lipid peroxides. We further find that FSP1 expression positively correlates with ferroptosis resistance across hundreds of cancer cell lines, and that FSP1 mediates resistance to ferroptosis in lung cancer cells in culture and in mouse tumor xenografts. Thus, our data identify FSP1 as a key component of a non-mitochondrial CoQ antioxidant system that acts in parallel to the canonical glutathione-based GPX4 pathway. These findings define a new ferroptosis suppression pathway and indicate that pharmacological inhibition of FSP1 may provide an effective strategy to sensitize cancer cells to ferroptosis-inducing chemotherapeutics.
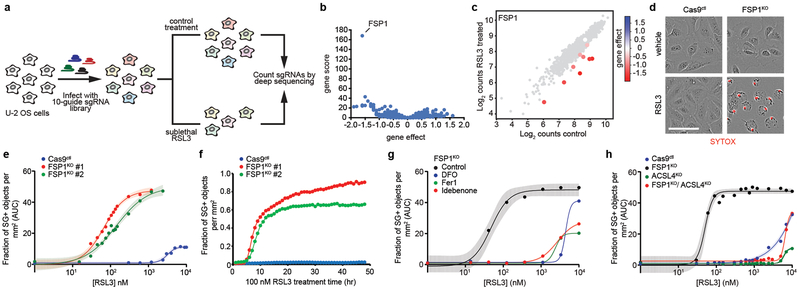
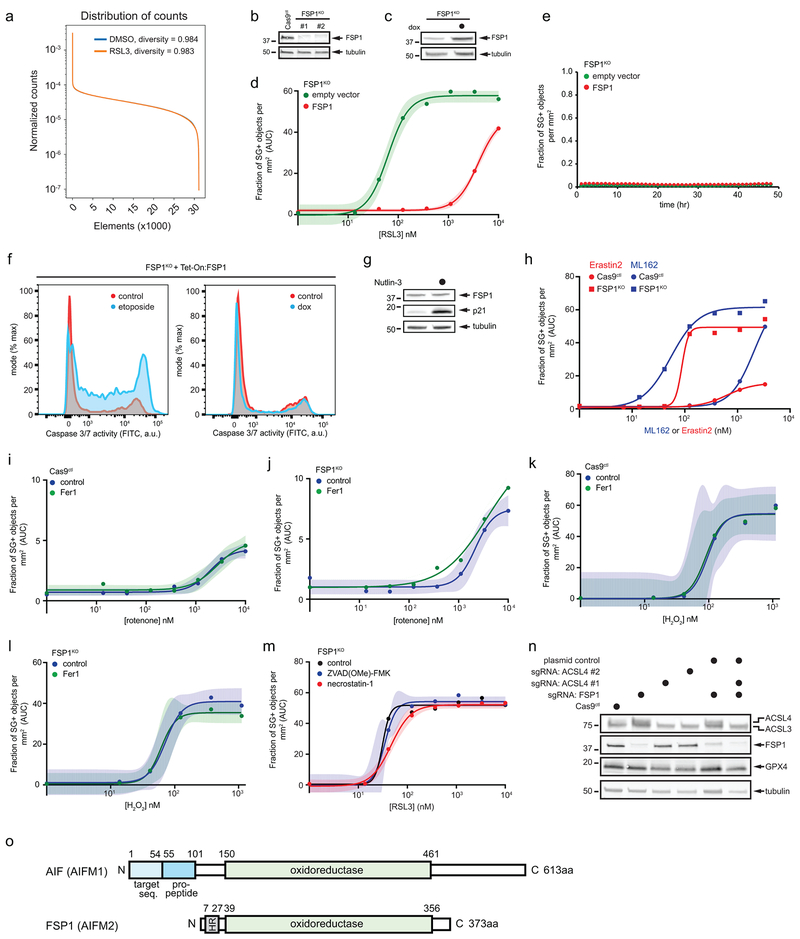
GPX4 is considered to be the primary enzyme that prevents ferroptosis2. The resistance of certain cancer cell lines to GPX4 inhibitors6 led us to search for additional protective pathways. To identify ferroptosis resistance genes, we performed a synthetic lethal CRISPR/Cas9 screen employing an apoptosis and cancer single-guide RNAs (sgRNAs) sublibrary in U-2 OS osteosarcoma cells treated with the GPX4 inhibitor 1S,3R-RSL3 (hereafter RSL3) (Fig. 1a). This screen revealed a significant disenrichment of sgRNAs targeting FSP1 in the RSL3-treated group (Fig. 1b,c, Extended Data Fig. 1a, Supplementary Table 1), indicating that deletion of the FSP1 gene is lethal in combination with RSL3 treatment. FSP1 was originally named AIFM2 based on its homology to apoptosis-inducing factor (AIF or AIFM1), a mitochondrial pro-apoptotic protein7,8. However, as reported here, FSP1 lacks the N-terminal mitochondrial targeting sequence in AIF, does not localize to mitochondria, and does not promote apoptosis. Thus, we renamed AIFM2 to FSP1 to reflect its cellular role as described in this study.
Fig. 1. A synthetic lethal CRISPR/Cas9 screen identifies FSP1 as a ferroptosis resistance factor.
a, Schematic of the CRISPR/Cas9 screening strategy. b, Gene effect and gene score calculated for individual genes analyzed in the CRISPR/Cas9 screen. c, Cloud plot indicating count numbers corresponding to FSP1 (color scale) and control (gray) sgRNAs. The gene effect of individual FSP1 sgRNAs is indicated by the heat map. d, Live cell imaging of control and FSP1KO cells incubated with SYTOX Green (SG+) and treated with 100 nM RSL3 for 48 hr. Scale bar = 75 μm. e, Dose response of RSL3-induced cell death of control and FSP1KO cells. f, Time-lapse cell death analysis of cells treated with 100 nM RSL3 over 48 hr. g, Dose response of RSL3-induced cell death in the presence of inhibitors of ferroptosis (Fer1: 1 μM, DFO: 100 μM, Idebenone: 10 μM), h, Dose response analysis of RSL3-induced cell death of the indicated cell lines. ACSL4KO and ACLS4KO/FSP1KO lines shown were generated using ACSL4 sgRNA #1. For figures e,g,h, shading indicates 95% confidence intervals for the fitted curves and each data point is the average of 3 technical replicates. Panels are representative of 2 biological replicates, except for figures b,c, which were derived from a single screen.
FSP1 is a potent ferroptosis suppressor
Quantification of cell viability using time-lapse microscopy revealed a profound increase in the sensitivity of FSP1 knockout (FSP1KO) cell lines to RSL3 (Fig. 1d-f, Extended Data Fig. 1b, Supplementary Table 2), which was rescued by expression of untagged FSP1 (Extended Data Fig. 1c,d). In contrast to previous reports7,8, overexpression of FSP1 did not induce apoptosis (Extended Data Fig. 1e,f) and activation of p53 did not increase FSP1 expression (Extended Data Fig. 1g). FSP1KO cells displayed increased sensitivity to additional ferroptosis inducers, including the GPX4 inhibitor ML162 and the system xc- inhibitor erastin29 (Extended Data Fig. 1h), but not to the Complex I inhibitor rotenone or hydrogen peroxide (Extended Data Fig. 1i-l). The viability of RSL3-treated FSP1KO cells was rescued by the iron chelator deferoxamine (DFO) and by the RTAs ferrostatin-1 (Fer1) and idebenone (Fig. 1g), but not by inhibitors of apoptosis (ZVAD(OMe)-FMK) or necroptosis (necrostatin-1) (Extended Data Fig. 1m). Knockout of ACSL4 in FSP1KO cells (FSP1KO/ACSL4KO) restored resistance to RSL3 to a similar extent as knockout of ACSL4 alone (ACSL4KO) (Fig. 1h, Extended Data Fig. 1n), consistent with the requirement for long-chain acyl-CoA synthetase 4 (ACSL4)-mediated incorporation of polyunsaturated fatty acids (PUFAs) into phospholipids for ferroptosis2,5. Together, these findings demonstrate that FSP1 is a strong suppressor of ferroptosis.
Plasma membrane FSP1 blocks ferroptosis
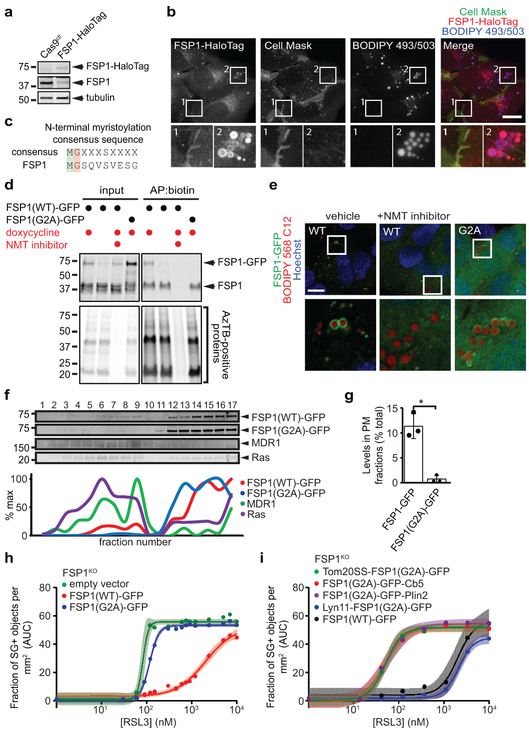
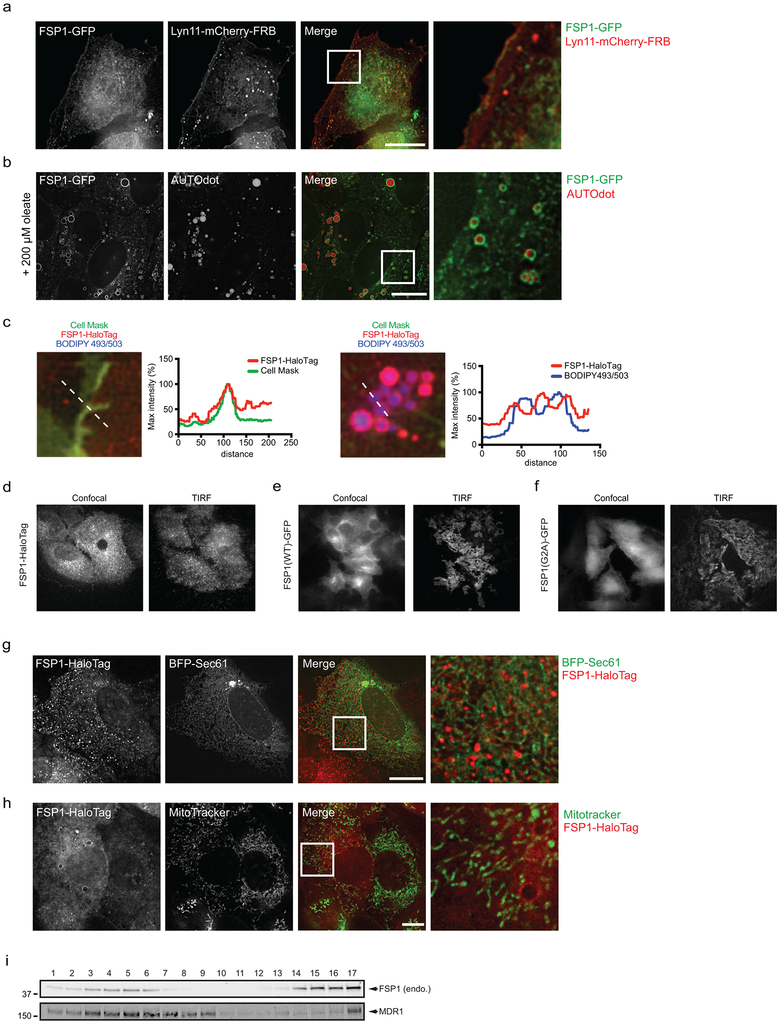
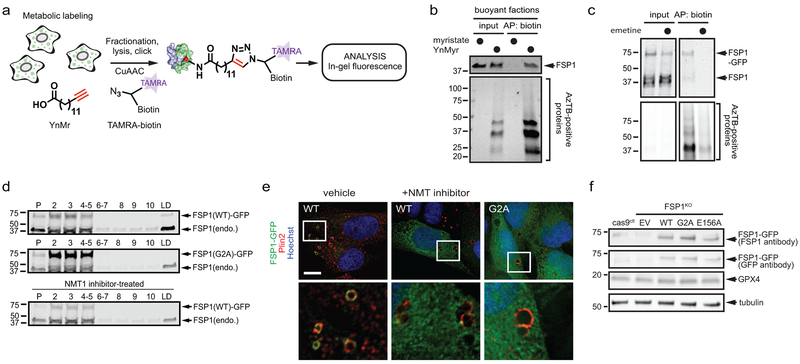
FSP1 contains a short N-terminal hydrophobic sequence and a canonical flavin adenine dinucleotide (FAD)-dependent oxidoreductase domain (Extended Data Fig. 1o). We previously detected FSP1 on lipid droplets (LDs)10. To further define the localization of FSP1, we inserted a C-terminal halogenase tag (HaloTag) into the FSP1 genomic locus (Fig. 2a). Similar to ectopically expressed FSP1 tagged at the C-terminus with green fluorescent protein (FSP1(WT)-GFP) (Extended Data Fig. 2a,b), FSP1-HaloTag localized to the periphery of LDs and to the plasma membrane (Fig. 2b, Extended Data Fig. 2c,d). FSP1-HaloTag did not co-localize with endoplasmic reticulum (ER) labeled with BFP-Sec61 or mitochondria labeled with MitoTracker (Extended Data Fig. 2g,h), consistent with the absence of an ER or mitochondrial targeting motif in FSP1. We noted an N-terminal consensus sequence for myristoylation (Fig. 2c), a fatty acid modification known to function in membrane targeting. FSP1 myristoylation was tested using a click chemistry method that enables affinity purification of myristoylated proteins (Extended Data Fig. 3a). Using this approach, endogenous FSP1 was affinity-purified from LD-enriched buoyant fractions (Extended Data Fig. 3b) and from whole cell lysates (Fig. 2d). Myristoylation of FSP1(WT)-GFP was blocked by inhibition of N-myristoyltransferase (NMT), mutation of FSP1 glycine-2 to alanine (FSP1(G2A)-GFP), and treatment with the translation inhibitor emetine (Fig. 2d, Extended Data Fig. 3c). Chemical and genetic perturbations of FSP1 myristoylation blocked FSP1 recruitment to LDs (Fig. 2e, Extended Data Fig. 3d,e). Although a portion of FSP1(G2A)-GFP was observed in proximity to the plasma membrane by TIRF microscopy (Extended Data Fig. 2f), fractionation of organelles in iodixanol (OptiPrep) gradients revealed that FSP1(G2A)-GFP was present at lower levels in plasma membrane-enriched fractions (Fig. 2f,g, Extended Data Fig. 2i). Together, these results indicate that myristoylation of FSP1 mediates its recruitment to LDs and the plasma membrane.
Fig. 2. Myristoylation-dependent recruitment of FSP1 to the plasma membrane promotes ferroptosis resistance.
a, Western blot of lysates from FSP1-HaloTag genomic knock-in cells. b, FSP1-HaloTag subcellular distribution by live cell microscopy. Cells were incubated with 100 nM JF549 to label FSP1-HaloTag, 5 μg/mL Cell Mask to label the plasma membrane and 1 μg/mL BODIPY 493/503 to label LDs. c, Consensus myristoylation sequence in FSP1. d, Analysis of FSP1-GFP myristoylation in whole cell lysates of the indicated cell lines treated for 24 hr with doxycycline to induce FSP1-GFP expression. Where indicated, 10 μM NMT inhibitor was added for 24 hr to inhibit myristoylation. e, Live cell microscopy of inducible FSP1-GFP cell lines treated with 200 μM oleate and 1 μM BODIPY 558/568 C12. Where indicated, cells were treated concurrently with 10 μM NMT inhibitor. f, Subcellular fractionation of organelles from cells expressing FSP1-GFP using OptiPrep gradient centrifugation. The densitometry plot shows the distribution of the indicated overexpressed and endogenous proteins. g, Quantification of FSP1-GFP levels in fractions 1-10 in (f) The graph shows mean ± SD of n = 3 biological replicates. *P = 0.0124 by two-tailed t-test. h, Dose response of RSL3-induced death of FSP1KO cells pretreated with doxycycline for 48 hr to induce expression of the indicated FSP1-GFP proteins. i, Dose response of RSL3-induced death of FSP1KO cells expressing the indicated inducible FSP1(G2A)-GFP constructs. For figures h,i, shading indicates 95% confidence intervals for the fitted curves and each data point is the average of 3 technical replicates. All figures are representative of two biological replicates. Images are representative of at least n = 10 imaged cells. Image scale bars = 10 μm.
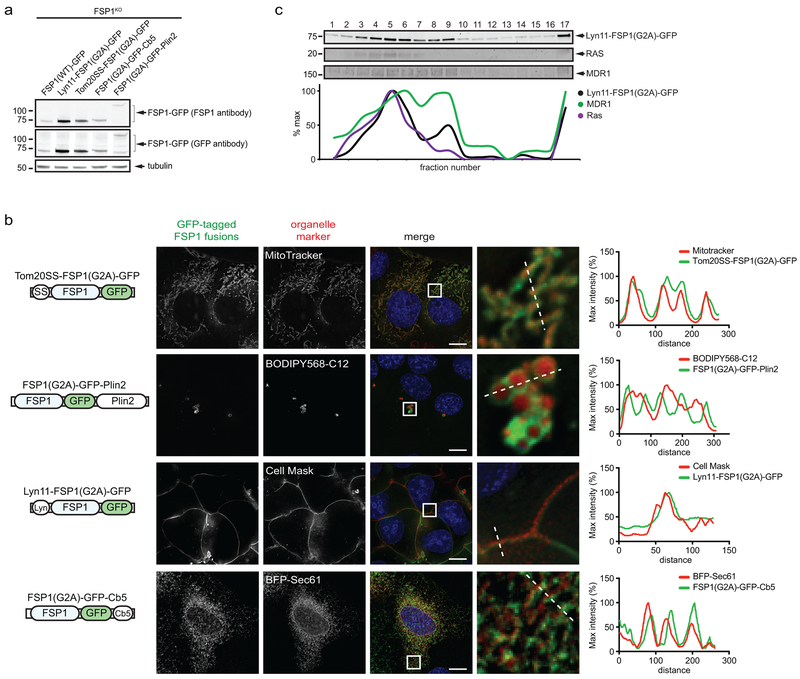
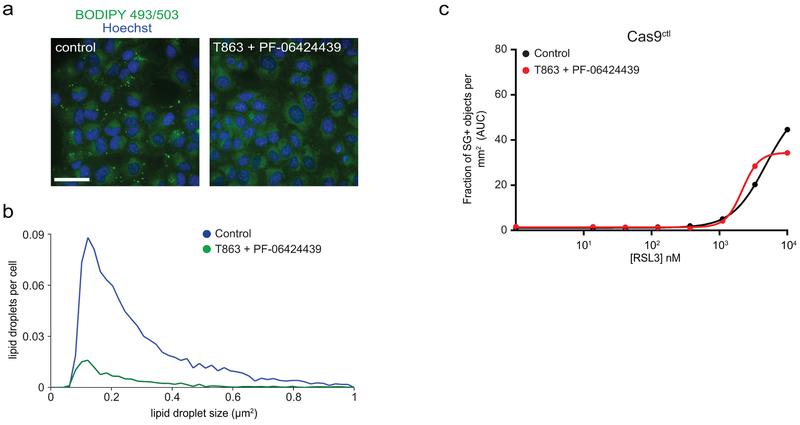
Expression of FSP1(WT)-GFP, but not FSP1(G2A)-GFP, rescued the resistance of FSP1KO cells to RSL3 (Fig. 2h, Extended Data Fig. 3f), indicating that FSP1 must be myristoylated to suppress ferroptosis. We generated fusion proteins that selectively target FSP1(G2A)-GFP to the ER (Cb5), the outer mitochondrial membrane (Tom20SS), LDs (Plin2), and the plasma membrane (Lyn11) (Extended Data Fig. 4a,b). Only expression of FSP1 targeted to the plasma membrane (Lyn11-FSP1(G2A)-GFP) was sufficient to restore ferroptosis resistance in FSP1KO cells (Fig. 2i, Extended Data Fig. 4c). In contrast, expression of FSP1(G2A)-GFP targeted to the ER, mitochondria, or LDs had no effect (Fig. 2i). Consistent with our previous results in HT1080 cells12, depletion of LDs using inhibitors of the diacylglycerol acyltransferase enzymes (DGAT1 and DGAT2) did not impact ferroptosis sensitivity (Extended Data Fig. 5a-c), supporting the conclusion that LD localization is not required for FSP1-mediated suppression of ferroptosis. Thus, FSP1 plasma membrane localization is necessary and sufficient to confer ferroptosis resistance.
FSP1 reduces CoQ to suppress ferroptosis
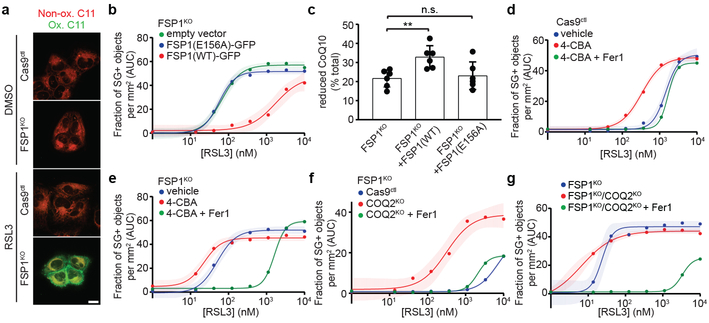
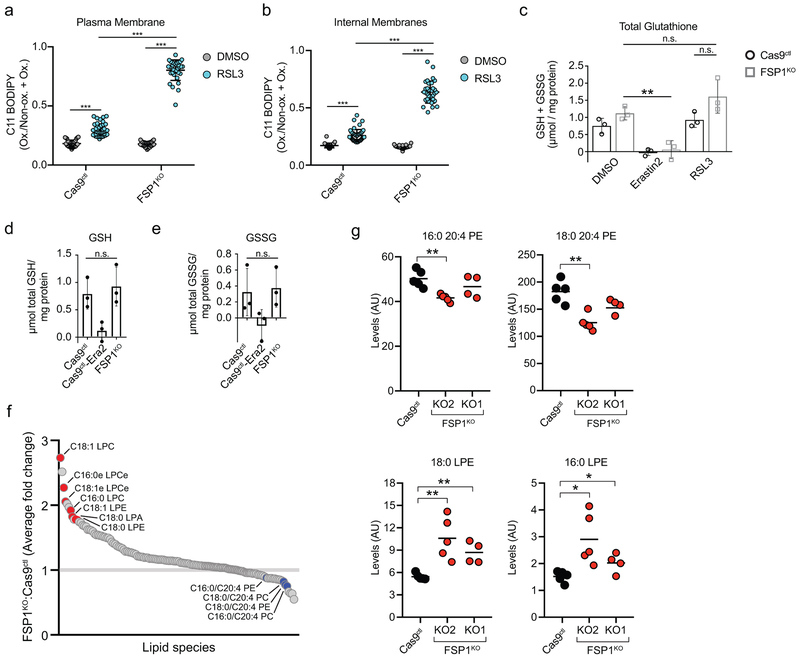
Under basal conditions, the ratiometric fluorescent lipid peroxidation sensor BODIPY 581/591 C11 exhibited similar levels of oxidation in control and FSP1KO cells (Fig. 3a, Extended Data Fig. 6a,b). However, a brief RSL3 treatment strongly increased C11 oxidation in FSP1KO cells relative to control (Fig. 3a, Extended Data Fig. 6a,b). Glutathione levels were unaffected in FSP1KO cells (Extended Data Fig. 6c-e), indicating that deletion of FSP1 does not inhibit system xc- or glutathione synthesis. FSP1KO cells also did not exhibit higher levels of PUFA-containing phospholipids (Extended Data Fig. 6f,g and Supplementary Table 3). Levels of PUFA-containing phospholipids were decreased while the corresponding lysophospholipids were elevated (Extended Data Fig. 6f,g and Supplementary Table 3), a known lipidomic signature of ferroptosis that reflects the removal of oxidized PUFAs from the sn-2 position of phospholipids3,15. These results suggest that loss of FSP1 results in increased phospholipid oxidation even when GPX4 is functional, and that FSP1 prevents lipid peroxidation through a mechanism that is distinct from glutathione-dependent protective pathways.
Fig. 3. FSP1 suppresses lipid peroxidation by reducing CoQ.
a, Control and FSP1KO cells treated with 250 nM RSL3 for 75 min were labeled with BODIPY 581/591 C11 and fixed prior to imaging. Ox. = oxidized; Non-ox. = non-oxidized. Images are representative of at least 30 cells imaged for each treatment condition. Scale bar = 20 μm. b, Dose response of RSL3-induced cell death of FSP1KO cells expressing the indicated inducible FSP1-GFP constructs. c, Reduced to oxidized CoQ ratio in FSP1KO and FSP1KO cells expressing the indicated FSP1-GFP constructs. Data represent mean ± SD of n = 6 biological replicates. **P = 0.0178; n.s., P > 0.99 by one-way ANOVA. d,e, Dose response of RSL3-induced death of control (d) and FSP1KO (e) cells pretreated for 24 hr with 3 mM 4-CBA. f,g, Dose response of RSL3-induced cell death of COQ2KO (f) and FSP1KO/COQ2KO (g) cells. For figures b,d-g, shading indicates 95% confidence intervals for the fitted curves and each data point is the average of 3 technical replicates. All figures are representative of two biological replicates.
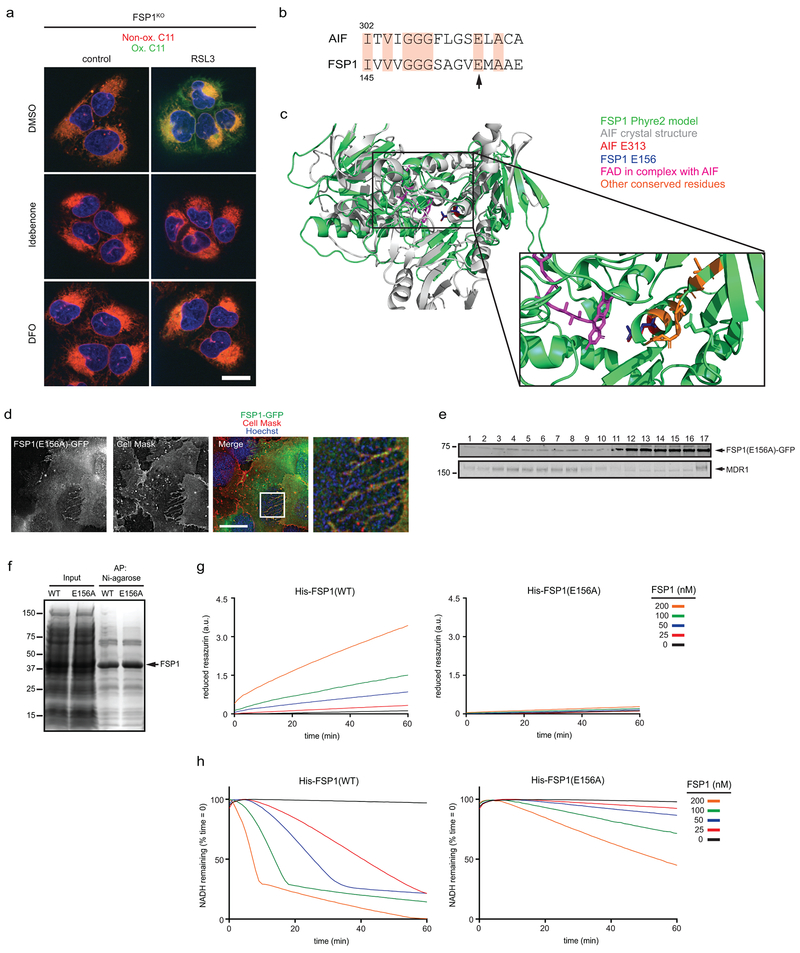
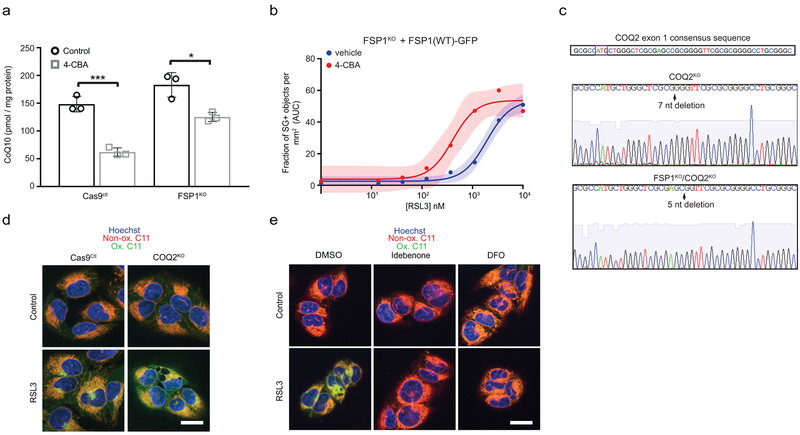
FSP1 functions as an NADH-dependent coenzyme Q (CoQ) oxidoreductase in vitro16. Reduced CoQ can act as an RTA, and idebenone, a soluble analog of CoQ, is sufficient to suppress lipid peroxidation (Extended Data Fig. 7a) and ferroptosis17 (Fig. 1g). Previous studies detected high levels of CoQ in non-mitochondrial compartments, including the plasma membrane18,19, but its function in these compartments remains unclear. To examine the role of FSP1 CoQ oxidoreductase activity in suppressing ferroptosis, we mutated a conserved glutamate residue (E313 in AIF, E156 in FSP1) that is required for binding of AIF to its cofactor, FAD (Extended Data Fig. 7b,c). Mutation of E156 in FSP1 (FSP1(E156A)-GFP) did not affect FSP1-GFP expression or localization (Extended Data Fig. 3f and 7d,e), but greatly impaired FSP1-mediated reduction of coenzyme Q1 and resazurin in vitro (Extended Data Fig. 7f-h) and abolished the ability of FSP1-GFP to rescue resistance of FSP1KO cells to RSL3 (Fig. 3b). Consistent with these findings, expression of FSP1(WT)-GFP, but not FSP1(E156A)-GFP, increased the ratio of reduced to oxidized CoQ (Fig. 3c). Acute reduction of cellular CoQ levels by inhibition of the CoQ biosynthesis enzyme COQ2 with 4-chlorobenzoic acid (4-CBA) strongly sensitized control cells, and to a lesser extent FSP1KO cells, to RSL3-induced ferroptosis (Fig. 3d,e, Extended Data Fig. 8a). 4-CBA also suppressed the ability of FSP1(WT)-GFP to rescue FSP1KO cells (Extended Data Fig. 8b). A similar degree of sensitization to RSL3 was observed following knockout of COQ2 in control but not FSP1KO cells (Fig. 3f,g, Extended Data Fig. 8c) and COQ2KO cells exhibited increased C11 oxidation after treatment with RSL3 that was suppressed by DFO and idebenone (Extended Data Fig. 8d,e). These data indicate that FSP1 and CoQ synthesis machinery function in the same pathway to suppress lipid peroxidation and ferroptosis.
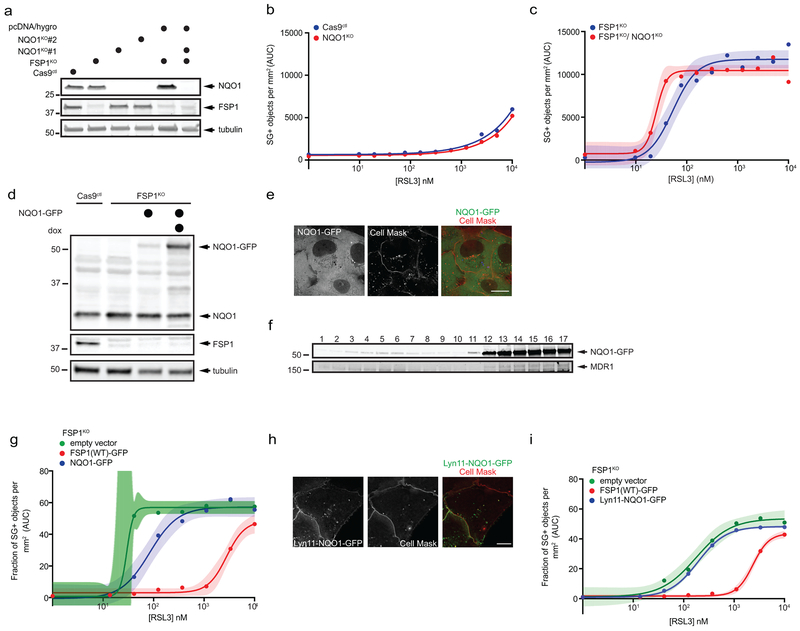
Deletion of NQO1, a quinone/CoQ oxidoreductase proposed to function in ferroptosis20, did not affect sensitivity to RSL3, but cells lacking both FSP1 and NQO1 (FSP1KO/NQO1KO) were more sensitive than FSP1KO cells (Extended Data Fig. 9a-c). NQO1-GFP failed to rescue ferroptosis resistance in FSP1KO cells to the same extent as FSP1-GFP (Extended Data Fig. 9d-g), even when targeted to the plasma membrane (Lyn11-NQO1-GFP) (Extended Data Fig. 9h,i). These results indicate that FSP1 is unique in its ability to suppress ferroptosis through the reduction of CoQ.
FSP1 in cancer ferroptosis resistance
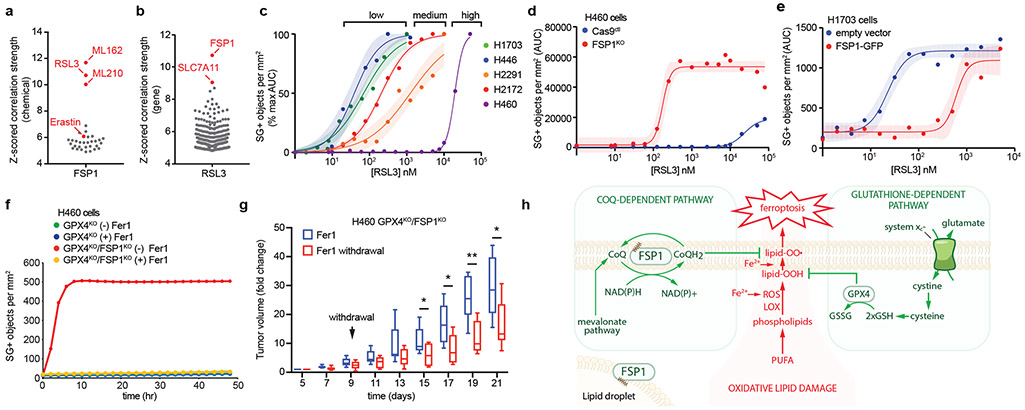
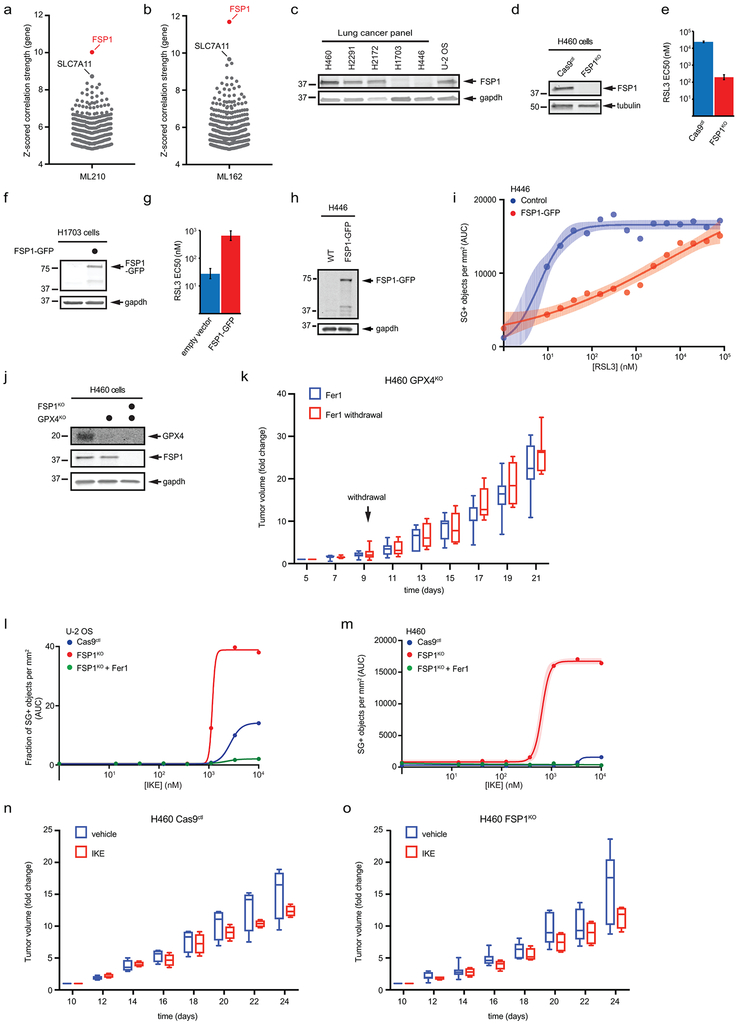
The Cancer Therapeutics Response Portal (CTRP) reports correlations between gene expression and drug resistance for over 800 cancer cell lines21. Remarkably, data mined from the CTRP indicate that FSP1 expression positively correlates with resistance to multiple GPX4 inhibitors – RSL3, ML210, and ML162 (Fig. 4a,b, Extended Data Fig. 10a,b, Supplementary Table 4), even more so than the system xc- component and erastin target SLC7A119. Thus, FSP1 is a biomarker of ferroptosis resistance in many types of cancer. Consistent with the correlations observed in the CTRP, lung cancer cell lines expressing low levels of FSP1 were the most sensitive to RSL3 and cell lines expressing high levels of FSP1 were the most resistant (Fig. 4b, Extended Data Fig. 10c). Knockout of FSP1 in the highly resistant H460 cell line resulted in a striking ~100-fold sensitization to RSL3 (Fig 4d, Extended Data Fig. 10d,e) and overexpression of FSP1-GFP in sensitive H1703 and H446 cells increased resistance to RSL3 by ~10–20 fold (Fig 4e, Extended Data Fig. 10f-i).
Fig. 4. FSP1 mediates ferroptosis resistance in lung cancer.
a,b, High expression of FSP1 is correlated with resistance to GPX4 inhibitors in non-hematopoietic cancer cells. Plotted data was mined from the CTRP database that contains correlation coefficients between gene expression and drug sensitivity for 907 cancer cell lines treated with 545 compounds. (a) shows the correlation between FSP1 expression and resistance to individual compounds and (b) shows the correlation between expression levels of individual genes and resistance to RSL3. Plotted values are z-scored Pearson’s correlation coefficients. c, Dose response of RSL3-induced cell death of the indicated cell lines. d, Dose response of RSL3-induced cell death of control and FSP1KO H460 cells. e, Dose response of RSL3-induced cell death of FSP1-GFP H1703 cells. f, Time lapse analysis of cell death of GPX4KO and GPX4KO/FSP1KO H460 cells in the presence and absence of 1 μM Fer1. g, GPX4KO/FSP1KO H460 tumor xenografts cells were initiated in immune-deficient SCID mice (n = 16). Following 5 days of daily Fer1 injections (2 mg/kg) to allow the cell lines to develop tumors, one set of mice (n = 8) continued to receive daily Fer1 injections and a second set (n = 8) received vehicle injections for the remaining 17 days. The distribution of fold changes in sizes of individual tumors during the treatment is shown. GPX4KO/FSP1KO (−) Fer1, n = 7); GPX4KO/FSP1KO (+) Fer1, n = 8. Box plots indicate median, 25th and 75th percentiles, minima and maxima of the distributions. Day 15, *P = 0.0397; Day 17, *P = 0.0187; Day 18, **P = 0.0025; Day 21, *P = 0.0327 by two-tailed t-test. h, Model illustrating the mechanism by which FSP1 suppresses ferroptosis. For figures c-e, shading indicates 95% confidence intervals for the fitted curves and each data point is the average of 3 technical replicates. Figures c-f are representative of two biological replicates.
To examine the possibility that inhibition of FSP1 could be a clinically relevant approach to sensitize tumors to ferroptosis-activating chemotherapies, we employed the ferroptosis-resistant H460 lung cancer cells in a preclinical tumor xenograft model. Due to the poor bioavailability of small molecule GPX4 inhibitors (e.g. RSL3), we adopted a recently developed strategy to acutely induce ferroptosis in vivo22,23 using GPX4 knockout cells (Extended Data Fig. 10j). These cell lines were maintained in Fer1-containing medium to prevent induction of ferroptosis. Fer1 washout had no effect on the viability of the GPX4KO cells but resulted in the rapid death of GPX4KO/FSP1KO cells (Fig. 4f), consistent with our findings that FSP1 compensates for loss of GPX4 activity. Tumor xenografts were generated with GPX4KO and GPX4KO/FSP1KO H460 cell lines, and Fer1 was injected daily to allow viable tumors to develop. After tumors were established, Fer1 injections were discontinued in one set of mice to induce ferroptosis. In contrast to the GPX4KO tumors, which continued to increase in size irrespective of Fer1 (Extended Data Fig. 10k), Fer1 withdrawal resulted in a significant reduction in the growth of the GPX4KO/FSP1KO tumors (Fig. 4g). These data demonstrate that FSP1 maintains growth of H460 lung cancer tumors in vivo when GPX4 is inactivated. To determine if growth of FSP1KO tumors can be inhibited by blocking cystine import, we treated H460 cells with imidazole-ketone-erastin (IKE), a system xc- inhibitor that can induce ferroptosis in vivo24. While U-2 OS and H460 FSP1KO cells exhibited increased sensitivity to IKE in cell culture (Extended Data Fig. 10i,m), IKE failed to inhibit the growth of H460 WT and FSP1KO tumor xenografts (Extended Data Fig. 10n,o). Since cells can overcome the effects of cystine depletion through the use of alternative pathways to generate glutathione25, our results underscore the need for GPX4 inhibitors that are efficacious in vivo.
Ferroptosis has emerged as a potential cause of cell death in degenerative diseases and as a promising strategy to induce the death of cancer cells that are resistant to other therapies1,2,5. Our studies identify FSP1 as a potent ferroptosis suppressor that operates in parallel to the canonical glutathione-dependent GPX4 pathway. Interestingly, FSP1KO mice are viable and display no obvious phenotypes29, consistent with the compensatory suppression of lipid peroxidation by GPX4. Mechanistically, our data support a model in which myristoylation targets FSP1 to the plasma membrane where it mediates NADH-dependent reduction of CoQ, which functions as an RTA that suppresses the propagation of lipid peroxides (Fig. 4h). Our data also reveal that a fundamental role of non-mitochondrial CoQ is to function as an antioxidant that prevents lipid damage, and consequently ferroptosis. Interestingly, localization of FSP1 at LDs is not required for protection from ferroptosis. One possibility is that FSP1-mediated regulation of lipophilic RTAs in LDs is important for the maintenance of lipid quality during prolonged periods of lipid storage, similar to the function of CoQ and tocopherol in preventing the oxidation of circulating lipoprotein particles13,14. Finally, our findings indicate that FSP1 expression is important in predicting the efficacy of ferroptosis-inducing drugs in cancers and highlight the potential for FSP1 inhibitors as a strategy to overcome ferroptosis resistance.
METHODS
Cell lines and culture conditions
U-2 OS T-Rex Flp-In cells, a gift from Dr. Daniel Durocher (The Lunenfeld-Tanenbaum Research Institute), and U-2 OS Tet-On cells (Clontech) were cultured in DMEM containing 4.5 g/L glucose and L-glutamine (Corning). NCI-H460, NCI-H2291, NCI-H1703 and NCI-H446 cells (ATCC) were cultured in RPMI1640 containing high glucose, L-glutamine and HEPES (ATCC). U-2 OS COQ2 knockout cells were grown in DMEM supplemented with 200 μM uridine and FSP1/COQ2 double knockout cells were grown in DMEM supplemented with 200 μM uridine and 1 μg/mL Ferrostatin-1. NCI-H460 GPX4 knockout lines and FSP1/GPX4 double knockout lines were grown in RPMI1640 supplemented with 1 μg/mL Ferrostatin-1. All media was supplemented with 10% fetal bovine serum (FBS, Thermo Fisher Scientific and Gemini Bio Products), and all cell lines were grown at 37°C with 5% CO2. All cell lines were tested for mycoplasma and were not authenticated.
Generation of doxycycline-inducible cell lines
U-2 OS expression lines were generated by transfection of U-2 OS T-Rex Flp-In cells with pOG44 Flp-Recombinase plasmid (Thermo Fisher Scientific) and pcDNA5/FRT/TO plasmid at a 9:1 ratio, followed by selection in 500 μg/mL hygromycin. NCI-H1703 and NCI-H446 expression lines were generated by infection with pLenti CMV TetR Blast virus (716-1) (Addgene plasmid #17492) in the presence of 8 μg/mL polybrene (Sigma-Aldrich), followed by selection in medium containing 2 μg/mL blasticidin for NCI-H1703 cells and 0.5 μg/mL blasticidin for NCI-H446 cells. TetR cells were subsequently infected with pLenti CMV/TO Hygro DEST virus (670-1) (Addgene plasmid #17293) containing the FSP1-GFP construct and were selected in medium containing 250 μg/mL hygromycin. FSP1-GFP-expressing cells were enriched by fluorescence-activated cell sorting of the GFP-positive populations.
Generation of CRISPR/Cas9 genome edited cell lines
For the CRISPR/Cas9 synthetic lethal screen, U-2 OS Tet-On lines stably expressing Cas9 were generated by infection with lentiCas9-Blast, a gift from Feng Zhang (Addgene plasmid #52962) and cells were selected in medium containing 1 μg/mL blasticidin. Active Cas9 expression was validated by flow cytometry analysis following infection with a self-cutting mCherry plasmid, which expresses mCherry and an mCherry gene targeting sgRNA.
U-2 OS FSP1 single knockout lines were generated using CRISPR/Cas9 technology by transfection with pSpCas9(BB)-2A-Puro (PX459), a gift from Feng Zhang (Addgene plasmid #48139), followed by selection in medium containing 1 μg/mL puromycin and isolation of individual clones using cloning rings. U-2 OS COQ2 single knockout and FSP1/COQ2, FSP1/ACSL4, and FSP1/NQO1 double knockout lines were generated by cotransfecting an FSP1 knockout clonal line (sgRNA guide 1, described below) with PX459 plasmids encoding the appropriate guides, together with pcDNA3.1/Hygro(−) (Thermo Fisher Scientific) at a 20:1 w/w ratio, selection in medium containing 500 μg/mL hygromycin, and isolation of individual clones using cloning rings. U-2 OS FSP1-HaloTag knock-in lines were generated by cotransfection of U-2 OS T-Rex Flp-In cells with the donor plasmid pUC57 (described below) and PX459 encoding FSP1 sgRNA guide 3 at a 2:1 w/w ratio in media containing 1 μM SCR7 non-homologous end joining (NHEJ) inhibitor (Xcess Biosciences, Inc.) for 48 hr, followed by selection in medium containing 1 μg/mL puromycin.
NCI-H460 FSP1 knockout lines were generated by infection with lentiCRISPR v2-Blast (Addgene plasmid #83489) virus, selection in medium containing 2 μg/mL blasticidin and isolation of single clones using cloning rings. NCI-H460 GPX4 knockout lines and FSP1/GPX4 double knockout lines were generated by infection with lentiCRISPR v2-Hygro (Addgene plasmid #98291) virus, selection in medium containing 250 μg/mL hygromycin, and isolation of single clones using cloning rings.
Plasmids
Cloning of all expression plasmids and the HaloTag donor plasmid was performed using restriction enzyme-independent fragment insertion by polymerase incomplete primer extension (PIPE). To generate the FSP1-HaloTag knock-in donor plasmid, 800 base pair homology arms flanking the FSP1 stop codon were amplified from U-2 OS genomic DNA and inserted in frame 5’ and 3’ to the linker-TEV-HaloTag sequence in pUC57 (a gift from Robert Tjian, UC Berkeley). The PAM site that corresponds to FSP1 sgRNA guide 3 was subsequently mutated in the donor sequence using mutagenesis primers to prevent cutting of the integrated donor sequence by Cas9. FSP1(WT)-GFP was generated by insertion of FSP1-GFP in pDEST4710 into pcDNA5/FRT/TO, and FSP1(G2A)-GFP and FSP1(E156A)-GFP were subsequently generated using site-directed mutagenesis. Tom20SS-FSP1(G2A)-GFP and Lyn11-FSP1(G2A)-GFP were generated by insertion of the signal sequence of Tom20 and the first 11 amino acids of Lyn kinase, respectively, at the N-terminus of FSP1(G2A)-GFP. FSP1(G2A)-GFP-Plin2 and FSP1(G2A)-GFP-Cb5 were generated by insertion of the full-length sequence for Plin2 and amino acids 100–134 of Cytochrome b5, respectively, at the C-terminus of FSP1(G2A)-GFP. Lyn11-mCherry-FRB was generated by replacement of CFP in Lyn11-CFP-FRB26 with the sequence for mCherry. BFP-Sec61 was a kind gift from Gia Voeltz, University of Colorado. FSP1-GFP in pLenti CMV/TO Hygro DEST (addgene #17291) was generated by insertion of FSP1-GFP into pENTR1A, followed by Gateway recombination cloning (Thermo Fisher Scientific). NQO1-GFP was generated by PCR amplification of NQO1 from U-2 OS cDNA and insertion into pcDNA5/FRT/TO encoding GFP. Lyn11-NQO1-GFP was generated by insertion of Lyn1–11 at the N-terminus of NQO1-GFP. For protein expression, FSP1(WT) and FSP1(E156A) lacking the ATG start codon were inserted into the pET-His6-TEV vector (Addgene plasmid #29653), C-terminal to the His6-TEV tag. LentiCas9-Blast was developed by the Zhang laboratory (Addgene plasmid #52962).
Plasmid transfections were performed in U-2 OS cells with Fugene6 (Promega) transfection reagent. Virus was produced by cotransfection of HEK293T cells with GAG, POL and pLenti expression plasmids at a 1:1:1 w/w/w ratio, using the X-tremeGENE HP (Roche) transfection reagent. Medium containing secreted virus was harvested after 48 hr and sterile filtered.
CRISPR guide RNA (sgRNA) sequences targeting FSP1, ACSL4, NQO1, GPX4 and COQ2 were designed using the online-available CRISPR design tool developed by the Zhang laboratory (http://crispr.mit.edu/). The oligo sequences preceding the protospacer motif were:
FSP1 guide 1, 5’ caccgGAATCGGGAGCTCTGCACG 3’,
FSP1 guide 2, 5’ caccgTCCCGATTCCACCGAGACCT 3’,
FSP1 guide 3, 5’ caccgTGAGGCAGTCTCCACCTTGA 3’
ACSL4 guide 1, 5’ caccgTGCAATCATCCATTCGGCCC 3’
ACSL4 guide 2, 5’ caccgTGGTAGTGGACTCACTGCAC 3’
NQO1 guide 1, 5’ caccgTTTGCAGCACTCACCGACCA 3’
NQO1 guide 2, 5’ caccgCAGAAGAGCACTGATCGTAC 3’
COQ2 guide, 5’ caccgATGCTGGGCTCGCGAGCCGC 3’
GPX4 guide, 5’ caccgAGCCCCGCCGCGATGAGCCT 3’
Nucleotides in italics show the overhangs introduced into oligos that are necessary for cloning into the BbsI restriction site of vector PX459 or BsmBI site of lentiCRISPR v2.
Chemicals and reagents
Reagents used in this study include: 1S-3R-RSL3 (Cayman Chemical), Ferrostatin-1 (Cayman Chemical), idebenone (Cayman Chemical), deferoxamine (Cayman Chemical), doxycycline (Sigma), Erastin2 (also known as compound 35MEW28) (synthesized by Acme, Palo Alto, CA), ML162 (Cayman Chemical), ZVAD(OMe)-FMK (Cayman Chemical), necrostatin-1 (Cayman Chemical), puromycin (Thermo Fisher Scientific), Nutlin-3 (Cayman Chemical), CellEvent™ Caspase-3/7 Green Detection Reagent (Thermo Fisher Scientific), etoposide (Sigma-Aldrich), rotenone (Sigma-Aldrich), blasticidin (Thermo Fisher Scientific), BODIPY 568 C12 (Thermo Fisher Scientific), BODIPY 493/503 (Thermo Fisher Scientific), BODIPY 581/591 C11 (Thermo Fisher Scientific), NMT inhibitor DDD85646 (Aobious), 4-CBA (Sigma-Aldrich), OptiPrep (Sigma-Aldrich), SYTOX Green Dead Cell Stain (Thermo Fisher Scientific), MitoTracker Green FM (Thermo Fisher Scientific), MitoTracker Orange CMTMRos (Thermo Fisher Scientific), CellMask Deep Red (Thermo Fisher Scientific), JF549 (kind gift from Luke Lavis, Janelia Research Campus), oleate (Sigma-Aldrich), polybrene (Sigma-Aldrich), myristate (Sigma-Aldrich), YnMyr (Iris Biotech GMBH), AutoDOT (Abgent), DGAT1 inhibitor T863 (Sigma-Aldrich), DGAT2 inhibitor PF-06424439 (Sigma-Aldrich), SCR7 NHEJ inhibitor (Xcess Biosciences, Inc.), TAMRA-Azide-PEG-Biotin (BroadPharm), coenzyme Q1 (Sigma-Aldrich), resazurin (Thermo Fisher Scientific), NADH (Sigma-Aldrich). IKE was synthesized as previously described24.
Cell death analysis
Cells were plated in triplicate at a density of 2,000–3,000 cells per well in black 96-well plates (Corning) 48 hr prior to start of imaging. To induce expression of FSP1, cells were treated with 10 ng/ml doxycycline at the time of plating. After 48 hr, the medium was replaced with fresh medium containing 30 nM SYTOX Green Dead Cell Stain, doxycycline (if needed) and the indicated drugs. The plates were immediately transferred to an IncuCyte Zoom imaging system (Essen Bioscience) enclosed in an incubator set to 37°C and 5% CO2. Three images per well were captured in the green and phase channels every 1 or 2 hr over a 48 hr period, and the ratio of SYTOX Green-positive objects (dead cells) to phase objects (total cells) was quantified using Zoom image analysis software (Essen Bioscience). For each treatment condition, the SYTOX to phase object ratio was plotted against the 48 hr imaging interval, the area under the curve (AUC) was calculated, and the average AUC was plotted as a function of drug concentration (e.g. RSL3) using Prism (GraphPad). To calculate the EC50 values, the AUC curve was fit to a variable slope function comparing response to drug concentration. To quantify death in NQO1KO cells, NQO1KO/FSP1KO cells and lung cancer lines, SYTOX counts were used to calculate the AUC. To compare cell death between parental lung cell lines, the AUC values were normalized by the maximum value for each cell line.
For the 4-CBA treatment experiments, cells were treated with vehicle (1% v/v ethanol) or 3 mM 4-CBA 24 hr after plating. 48 hr after plating, the media was replaced with fresh media containing 4-CBA and the indicated drugs. For experiments comparing control to COQ2 knockout cells, all cells were cultured in 200 μM uridine during imaging.
Western blotting
Cells were washed twice with PBS, lysed in 1% SDS, sonicated for 10 s, and incubated for 5 min at 100°C. Protein concentrations were determined using the bicinchoninic acid (BCA) protein assay (Thermo Fisher Scientific), and equal amounts of protein by weight were combined with 1X Laemmli buffer, separated on 4–20% polyacrylamide gradient gels (Bio-Rad Laboratories, Inc.) and transferred onto nitrocellulose membranes (Bio-Rad Laboratories, Inc.). Membranes were washed in PBS with 0.1% Tween-20 (PBST) and blocked in PBST containing 5% (wt/vol) dried milk for 30 min. Membranes were incubated for 24 hr in PBST containing 5% bovine serum albumin (BSA) (Sigma Aldrich) and primary antibodies. After washing with PBST, membranes were incubated at room temperature for 30 min in 5% BSA/PBST containing fluorescent secondary antibodies. Immunoblots were imaged on a LI-COR imager (LI-COR Biosciences).
The following blotting reagents and antibodies were used: anti-Plin2 (Abgent), anti-AIFM2 (Proteintech Group, Inc. and Santa Cruz Biotechnology), anti-α-tubulin (Cell Signaling Technology, Inc. and Santa Cruz Biotechnology), anti-GPX4 (Abcam), anti-ACSL4 (Sigma-Aldrich), anti-GFP (Poteintech Group, Inc.), anti-NQO1 (Proteintech Group, Inc.), anti-GAPDH (EMD Millipore), anti-RAS (Cell Biolabs, Inc.), anti-MDR1 (Cell Signaling Technology, Inc.), anti-p21 (Cell Signaling Technology, Inc.), anti-rabbit IRDye800 conjugated secondary (LI-COR Biosciences), anti-mouse Alexa Fluor 680 conjugated secondary (Invitrogen).
Fluorescence microscopy
For fluorescence microscopy of Plin2 and FSP1-GFP in fixed cells, cells grown on coverslips were treated with 200 μM oleate/BSA complex for 24 hr, washed 3X with PBS, fixed for 15 min in PBS containing 4% (wt/vol) paraformaldehyde, and washed 3X again with PBS. Cells were permeabilized for 15 min with blocking solution (1% BSA/PBS) containing 0.01% digitonin, washed 3X, and incubated in blocking solution for an additional 15 min. Cells were incubated with anti-Plin2 antibody in blocking solution (1:500 dilution) for 2 hr at room temperature, washed 3X, and incubated for 1 hr in blocking solution containing anti-rabbit secondary antibody conjugated to Alexa Fluor 594 (1:500 dilution) (Thermo Fisher Scientific). After additional 3X washes, coverslips were mounted on glass slides using Fluoromount G (Southern Biotech). For fluorescence microscopy of FSP1-GFP and Lyn-mCherry-FRB, cells were fixed in PBS containing 4% (wt/vol) paraformaldehyde and washed 3X with PBS prior to mounting.
For live-cell microscopy, cells were grown in 4-well or 8-well Lab-Tek II Chambered Coverglass (Thermo Fisher Scientific) imaging chambers. To image LDs, cells were incubated for 24 hr with 1 μM BODIPY 558/568 C12 (Thermo Fisher Scientific) or treated with 100 μM AutoDOT prior to imaging. To image the cell membrane, cells were incubated with 5 μg/mL CellMask Deep Red for 30 min, and the medium was replaced prior to imaging. To image mitochondria, cells were incubated with 100 nM MitoTracker Orange CMTMRos or MitoTracker Green FM for 15 min. For imaging that required prior transfection, cells were transiently transfected with the indicated plasmids in 6-well plates using Fugene6, incubated for 48 hr and seeded in Lab-Tek II chambers prior to imaging. To image FSP1-HaloTag, cells were incubated with 100 nM JF549 dye for 30 min, washed 3X with PBS, and imaged in fresh medium.
Cells were imaged using a Deltavision Elite widefield epifluoresence deconvolution microscope (GE Healthcare) equipped with a 60x oil immersion objective (Olympus), using DAPI, FITC, Tx-Red and Cy5 filters. For live-cell microscopy, cells were imaged in an enclosure heated to 37°C and exposed to a continuous perfusion of a gas mixture containing 5% CO2, 21% O2 and 74% N2 (BioBlend, Praxair). Z-stacks of 0.2 μm slices totaling 4–6 μm in thickness were acquired for deconvolution using SoftWoRx software (GE Life Sciences). Single deconvolved slices for each channel were analyzed and merged using ImageJ (http://imagej.nih.gov/ij/).
Lipid droplet fractionation
10 15-cm plates of U-2 OS cells expressing inducible FSP1-GFP were induced with 10 ng/mL doxycycline for 48 hr. Cells were harvested by scraping into PBS and centrifuged for 10 min at 500 x g. Cell pellets were resuspended in cold hypotonic lysis medium (HLM, 20 mM Tris-HCl pH 7.4, 1 mM EDTA) supplemented with 1X cOmplete™, Mini, EDTA-free Protease Inhibitor Cocktail (Sigma-Aldrich), incubated on ice for 10 min, dounced using 80X strokes and centrifuged at 1000 x g for 10 min. The supernatant was subsequently transferred to Ultra-Clear ultracentrifuge tubes (Beckman-Coulter), diluted with 60% sucrose/HLM to a final concentration of 20% sucrose/HLM, and overlaid by 4 ml of 5% sucrose/HLM followed by 4 ml of HLM. Overlaid samples were centrifuged for 30 min at 15,000 x g in an ultracentrifuge using a SW41 swinging bucket rotor (Beckman-Coulter). Buoyant fractions were collected using a tube slicer (Beckman-Coulter), additional fractions were pipetted from the top of the sucrose gradient in 1 mL increments, and pellets were resuspended in 1 mL HLM. 100 μL of 10% SDS was added to each fraction, yielding a final concentration of 1% SDS. Samples were then sonicated for 15 s and incubated for 10 min at 65°C. Buoyant fractions were incubated at 37°C for 1 hr and sonicated every 20 min, followed by a final incubation at 65°C for 10 min.
Plasma membrane fractionation
Plasma membrane subdomains were separated using a continuous OptiPrep gradient as previously described27. 6 15-cm plates of cells expressing inducible FSP1-GFP were incubated with 10 ng/ml doxycycline for 48 hr and harvested by scraping into PBS, centrifuged for 10 min at 500 x g and resuspended in 1 mL of base buffer (20 mM Tris-HCl pH 7.8, 250 mM sucrose) supplemented with 1 mM MgCl2, 1 mM CaCl2, and 1X cOmplete™, Mini, EDTA-free Protease Inhibitor Cocktail. Cells were passed 40X through a 1.5” 22-gauge needle and centrifuged at 1000 x g for 10 min. The supernatant was retained, and the pellet was resuspended in an additional 1 mL base buffer containing 1 mM MgCl2 and 1 mM CaCl2. The resuspended pellet was passed 40X through a 22-gauge needle, centrifuged at 1000 x g for 10 min and the supernatant was combined with 1 mL of supernatant from the previous step to make 2 mL total. OptiPrep mixing solution was prepared by combining 60% OptiPrep stock solution with buffer containing 120 mM Tris-HCl pH 7.8, 250 mM sucrose in a 5:1 v/v ratio. 2 mL OptiPrep mixing solution was combined with 2 mL of sample supernatant from the previous centrifugation steps to yield 4 mL of a sample containing 25% OptiPrep. This OptiPrep-mixed sample was gently pipetted under 8 mL of a continuous 5–20% OptiPrep gradient prepared in base buffer in an UltraClear tube. The loaded sample was subsequently centrifuged for 90 min at 52,000 x g at 4°C using a SW41 swinging bucket rotor. After centrifugation, individual 0.67 mL fractions were collected by pipetting from the top of the gradient and analyzed by Western blot. The plasma membrane-localized proteins Ras and MDR1 were used as markers of plasma membrane fractions.
CRISPR/Cas9 synthetic lethal screen
The CRISPR/Cas9 screen was performed as previously described28. The “Apoptosis and Cancer” sublibrary of sgRNAs28 comprising 31,324 elements, including 29,824 sgRNAs targeting 3,015 genes (~10 sgRNAs per gene) and 1,500 negative control sgRNAs was employed. To generate lentiviral particles, the sublibrary was co-transfected with 3rd generation lentiviral packaging plasmids (pVSVG, pRSV and pMDL) into HEK293T cells. Medium containing lentivirus was harvested 48 and 72 hr after transfection, combined, filtered, and then used to infect ~2.1×10⁷ U-2 OS Tet-On cells stably expressing Cas9. After 72 hr of growth, infected cells were selected in medium containing 1 μg/mL puromycin until over 90% cells were mCherry positive. Cells were then re-seeded in 500 cm2 plates (∼8 × 10⁶ cells/plate) and recovered in medium lacking puromycin for 24 hr. For the screen, a total of ∼3.2 × 10⁷ cells (i.e. ~1000-fold library coverage) were treated with either DMSO or 0.5 μM RSL3 for 5 days. Cells were then trypsinized, collected by centrifugation at 1000 x g, washed twice with PBS, and pellets were frozen at −80°C. Genomic DNA was extracted using the QIAamp DNA Blood Maxi Kit (QIAGEN) according to the manufacturer’s instructions. sgRNA sequence libraries were prepared from genomic DNA by two rounds of PCR using the Herculase II Fusion DNA Polymerase (Agilent). sgRNA sequences were amplified by the primers oMCB1562 and oMCB1563 and then indexed using the Illumina TruSeq LT adaptor sequences AD006 (GCCAAT; DMSO) or AD012 (CTTGTA; RSL-3) for downstream deep sequencing analysis. PCR products were separated on a 2% tris-borate-ethylenediaminetetraacetic acid (TBE)-agarose gel, purified using the QIAquick Gel Extraction Kit (QIAGEN), and assessed for quality using a Fragment Analyzer (Agilent). PCR amplicons from each sample were pooled in a 1:1 ratio based on their concentrations as determined by Qubit Fluorometric Quantification. sgRNA sequences were analyzed by deep sequencing using the primer oMCB1672 on an Illumina MiSeq instrument at the Oklahoma Medical Research Foundation. Sequence reads were aligned to the sgRNA reference library using Bowtie software. For each gene, a gene effect and score (likely maximum effect size and score), and P value were calculated using the casTLE statistical framework as previously described28.
Click chemistry and in-gel fluorescence
To analyze myristoylated proteins in LD-enriched buoyant fractions, 20 15-cm plates of U-2 OS cells were incubated with 100 μM myristic Acid or 100 μM YnMyr for 48 hr. Buoyant fractions were isolated by sucrose gradient fractionation as described above, combined with SDS (1% final concentration), and dialyzed into a 0.1% SDS/PBS solution. A click mixture was prepared by adding reagents in the following order and by vortexing after the addition of each reagent: 10 μL of 10 mM TAMRA-Azide-PEG-Biotin (BroadPharm), 20 μL of 50 mM Copper (II) sulfate, 20 μL of 50 mM tris(2-carboxyethyl)phosphine (TCEP), 10 μL of 10 mM tris(benzyltriazolylmethyl)amine (TBTA). 60 μL of click mixture was then added to 1 mL of the dialyzed samples. The samples were then vortexed and incubated for 1 hr at room temperature. 1 mL of cold methanol containing 10 mM EDTA was added to each sample, and the samples were briefly vortexed and stored at −80°C overnight. The following day, the samples were centrifuged at 17,000 x g at 4°C for 30 min to pellet precipitated proteins. Pellets were washed twice with 1 mL cold methanol, dried in a speed-vac centrifuge under medium heat, and resuspended in 80 μL PBS containing 1% SDS. Once dissolved, proteins were resuspended in 1X Laemmli loading buffer and analyzed by SDS-PAGE. To visualize proteins using fluorescence, the gel was washed 3X with milliQ water and imaged using a ChemiDoc XRS+ Imaging System (Bio-Rad Laboratories, Inc.).
To analyze myristoylated proteins in whole cell lysates, U-2 OS cells were incubated with 100 μM Myristic Acid or 100 μM YnMyr for 48 hr. Cells were washed twice with PBS and lysed in buffer containing 1% SDS/PBS and 1 x EDTA-free complete protease inhibitor. Equal amounts of protein by weight were diluted to 0.1% SDS/PBS and subjected to click chemistry with TAMRA-Azide-PEG-Biotin as described above.
Enrichment of N-myristoylated proteins
YnMr-labeled proteins in cell lysates were conjugated to TAMRA-Azide-PEG-Biotin using click chemistry as described above. After protein precipitation in cold methanol, the pellet was resuspended in 80 μL of 1% SDS/PBS. Once the pellet was completely dissolved, 65 μL was diluted 10-fold with PBST. 15 μL of Streptavidin Agarose Resin (Thermo Fisher Scientific) was washed 3X with PBST. The diluted sample was added to the bead resin and rotated for 3 hr at room temperature. Beads were washed 5X with PBST and bound proteins were eluted by boiling the beads for 5 min in 2X Laemmli buffer containing 2 mM biotin.
Lipidomic profiling using liquid chromatography-tandem mass spectrometry
Cas9ctl and FSP1KO U-2 OS cells grown in 10 cm plates were scraped into PBS, centrifuged at 500 x g for 5 min, and processed as described previously29. After addition of internal standards (10 nmol of dodecylglycerol and 10 nmol of pentadecanoic acid), lipids were extracted in a 4 mL solution of 2:1:1 choloroform:methanol:PBS. The organic and aqueous layers were separated by centrifugation at 1000 x g for 5 min. Following the collection of the organic layer, the remaining organic material in the aqueous layer was acidified by addition of 0.1% formic acid and re-extracted with 2 mL of chloroform. Extracts were combined, dried down under a stream of nitrogen, and then resolubilized in 120 μL of chloroform. 10 μL of sample was analyzed by single reaction monitoring (SRM)-based LC-MS. LC separation was performed using a Luna reverse-phase C5 column, and MS analysis was preformed using an Agilent 6400 triple quadrupole (QQQ)-liquid chromatography-mass spectrometry instrument. Metabolites were quantified by integrating the area under the curve, and the values were normalized to the internal standards.
Glutathione measurements
The day before the experiment, 2 × 10⁵ Cas9ctl and FSP1KO U-2 OS cells per well were seeded into 6-well dishes. Cells were treated with DMSO (vehicle), Erastin2 (1 μM) for 6 h or RSL3 (250 nM) for 1 h. Cells were harvested by scraping and prepared for measurement of glutathione (GSH+GSSG) using the Cayman Chemical Glutathione Assay Kit (Cayman Chemical) according to the manufacturer’s protocol. The GSH and GSSG concentrations were calculated using a standard curve and normalized to the total protein level in each sample. Three independent biological replicates were performed for each condition.
BODIPY 581/591 C11 analysis
The day before the experiment, 2 × 10⁵ U-2 OS cells per well were seeded into 6-well dishes containing a 22 mm2 glass coverslip in each well. Cells were treated with DMSO (vehicle) or RSL3 (250 nM) for 75 minutes. At the end of the treatment, the treatment medium was removed and cells were washed once with HBSS. Cells were then labeled in 1 mL HBSS containing 5 μM BODIPY 581/591 C11 and incubated at 37 °C for 10 min. The label mixture was removed and 1 mL of fresh HBSS was added to the cells. The cover slip was transferred to a glass microscope slide onto which 25 μL of fresh HBSS had been applied. Confocal imaging and quantification of BODIPY 581/591 C11 were performed as described previously12 on two independent biological replicates per treatment. Using ImageJ, each nucleus was attributed two regions of interest (ROI), one perinuclear and one plasma membrane-localized. Red and green fluorescence values were quantified for each ROI and corrected for background by subtracting the red or green fluorescence in cell-free areas. The BODIPY 581/591 C11 value was calculated as the ratio of the green fluorescence (which indicates oxidized probe) to total (green + red, which indicates total reduced plus oxidized probe) fluorescence.
Tumor xenograft growth studies
For Ferrostatin-1 withdrawal experiments, tumor xenografts were established by injection of GPX4KO and GPX4KO/FPS1KO H460 cells into the flank of male C.B17 SCID mice, 6 weeks of age (Taconic Farms) (n = 8). Briefly, cells were washed with PBS, trypsinized, and collected in serum-containing medium. Harvested cells were then washed with serum free medium once and resuspended in serum free medium at a concentration of 2 × 10⁴ cells/μL. 100 μL of cells (2 × 10⁶ cells) were injected per animal. Ferrostatin-1 was prepared at a concentration of 0.2 mg/mL in 18:1:1 v/v PBS:ethanol:PEG40. Mice were injected intraperitoneally (IP) with Ferrostatin-1 daily (2 mg/kg), and tumor size was measured using calipers. Ferrostatin-1 injections were discontinued in one set of mice 5 days after cell injection, and tumor size was measured once every 2 days in each mouse for an additional 17 days. Animals not included in the analysis included mice that were sacrificed early due to sickness (n = 1 of GPX4KO (+) Fer1) and mice whose tumors were determined to be outliers according to the statistical test described below (n = 1 of GPX4KO (−) Fer1 and n = 1 of GPX4KO/FSP1KO (−) Fer1). The number of mice represented in the final analysis was GPX4KO (−) Fer1 (n = 7), GPX4KO (+) Fer1 (n = 7), GPX4KO/FSP1KO (−) Fer1 (n = 7), and GPX4KO/FSP1KO (+) Fer1 (n = 8).
For IKE injection experiments, IKE was resuspended at 4 mg/mL in an HBSS pH 4 solution containing 4% DMSO, 2% ethanol and 4% PEG40. To prepare this solution, 24 mg of IKE was dissolved in 200 μL DMSO, and 100 μL ethanol and 250 μL PEG40 were sequentially added. This mixture was added to 5.4 mL of HBSS pH 4 (Gibco) and sterile filtered. Tumor xenografts were established by injection of Cas9ctl (n = 8) or FSP1KO H460 (n = 8) cells as described above. After 10 days, each group of mice (n = 8) was injected daily with vehicle or 40 mg/kg IKE (250 μL total volume), and the fold change in tumor size was measured over a 24 day period. Animals not included in the analysis included mice that were sacrificed early due to development of exceedingly large tumors (n = 1 of Cas9KO (+) IKE, n = 3 of Cas9KO (−) IKE, n = 3 of FSP1KO (+) IKE and n = 1 of FSP1KO (−) IKE), mice in which tumors failed to initiate (n = 2 of Cas9KO (+) IKE), and mice whose tumors were determined to be statistical outliers according to the test described below (n = 1 of Cas9KO (+) IKE, n = 1 of Cas9KO (−) IKE, n =1 of FSP1KO (+) IKE). The number of mice represented in the final analysis was Cas9KO (−) IKE (n = 4), Cas9KO (+) IKE (n = 4), FSP1KO (−) IKE (n = 7), and FSP1KO (+) IKE (n = 4).
No statistical tests were used to calculate sample size. Sample size was n = 8 for each treatment group to account for differences in tumor formation and growth, and to ensure recovery of a sufficient quantity of mice with tumors of approved size at each time point of the study. Following injection of H460 cells, the mice were randomly assigned into 2 treatment groups for the ferrostatin-1 withdrawal experiments and into 2 treatment groups for the IKE injection experiments. Fold change in tumor volume was statistically analyzed using the unpaired, two-way t-test. Outliers were identified using the Grubbs method and were removed from analyses. Blinding was not possible because the experiments were performed by a single researcher. All animal experiments were conducted in accordance with the guidelines of the Institutional Animal Care and Use Committees (IACUC) of the University of California, Berkeley. Animals were euthanized when the xenograft tumor size reached 2-cm in any two dimensions. No mouse exhibited severe loss of body weight (>15%) or evidence of infections or wounds.
TIRF microscopy
Cells were imaged at room temperature using a Nikon Ti-E inverted microscope (Nikon Instruments) outfitted with a TIRF 60X/1.49 NA oil objective, an Andor Laser Combiner and an electron-multiplying charge-coupled device camera (iXon ULTRA 897BV; Andor Technology). Samples were excited with a 488nm laser line, and emission was collected through a single band-pass filter centered on 510 nm. All images were acquired using iQ3 acquisition software (Andor Technology). The depth of the evanescent field was approximately 150 nm.
CoQ measurements
CoQ measurements were performed as previously described 30. To simultaneously measure the reduced and oxidized form of CoQ10, a cold butylhydroxytoluene (BHT) solution was added to prevent auto-oxidation at the beginning of sample extraction. 100 μL of a cold BHT-in-propanol solution (5 mg/mL) and 600 μL of cold 1-propanol were added to each tube containing cells in the frozen state. Immediately after this, the mixture was subjected to sonication for 2 min. Subsequently, 100 μL of cold ubiquinone-9 solution (2 μg/mL), which was used as internal standard, was added, and the mixture was vortex-mixed for 1 min. It was then centrifuged for 10 min at 3500 rpm and 1°C, and the propanol organic supernatant layer was transferred to an autosampler vial. 100 μL aliquots of the 1-propanol extract were immediately analyzed and the reduced and oxidized CoQ10 levels were determined using HPLC. HPLC analysis was performed using an automated Hitachi Chromaster™ system equipped with a Model 5110 quaternary pump, Model 5210 autosampler, Model 5310 column oven and ESA CouloChem III detector. The EZChrom Elite® software (Agilent) was used for monitoring output signal and processing the results. The analytical column was a 150-mm x 4.6-mm C18 column with 5-μm spherical particles connected to a Security Guard equipped with a C18 cartridge (4-mm x 3-mm).
Apoptosis activation assay
Cells grown in 6-cm plates were washed with PBS, trypsinized and centrifuged for 5 min at 500 x g. Cell pellets were resuspended in PBS containing 5% FBS and 5 μM CellEvent™ Caspase-3/7 Green Detection Reagent and were incubated for 30 min at 37°C. Cells were analyzed on a LSRFortessa™ (Becton-Dickinson) flow cytometer, and the raw data was processed using the FlowJo software package (TreeStar). Apoptotic cells were gated using the same FSC threshold across all samples, and FITC fluorescence of the gated populations was determined.
Protein purification and activity assays
Expression vectors were transformed into Rosetta™ DE3 competent cells (EMD Millipore) and LB cultures were inoculated for overnight growth at 37°C while shaking. The following day, the cultures were diluted 1:100 into 500 mL of LB and allowed to grow to OD600 of 0.5, at which point the incubator was set to start cooling to 20°C. The cultures were grown further to an OD600 of 0.7 and induced with 1 mM isopropyl β-D-1-thiogalactopyranoside (IPTG) overnight. Bacterial pellets were resuspended in 2 mL of cold lysis buffer containing 50 mM potassium phosphate, 300 mM KCl, and 30 mM imidazole, supplemented with 1X cOmplete™, Mini, EDTA-free Protease Inhibitor Cocktail. The resuspended cells were sonicated 5X on ice at 50% power for 10 s, with 2 minute incubations on ice in between sonications, and were centrifuged at 20,000 x g for 15 min at 4°C. The supernatant was combined with 200 μL of Ni-NTA agarose beads (Thermo Fisher Scientific) washed 3X with lysis buffer, and the supernatant-bead mixture was rotated for 1 hr at 4°C. The beads were subsequently washed 5X with cold lysis buffer, and bound proteins were eluted by incubating beads for 15 min in 500 uL of cold lysis buffer containing 250 mM imidazole while rotating. The eluted proteins were dialyzed into PBS containing 10% glycerol and snap frozen in liquid N2. Protein concentration was determined by measuring the absorbance at 280 nm.
To measure NADH oxidation kinetics, recombinant FSP1 was combined with 500 μM NADH and 200 μM coenzyme Q1 in a total volume of 100 μL PBS. A reduction in absorbance at 340 nm, corresponding to NADH oxidation, was determined over the course of 1 hr. To measure resazurin reduction kinetics, recombinant FSP1 was combined with 500 μM NADH and 500 μM resazurin in a total volume of 100 μL PBS. Fluorescence (emission at 590 nm) corresponding to reduced resazurin was determined over the course of 1 hr. All measurements were taken using a SpectraMax i3 Multi-Mode Platform plate reader (Molecular Devices).
Analysis of CTRP dataset
Data for significant correlations between FSP1 gene expression and resistance to RSL3, ML162, and ML210 was downloaded from the CTRP v2 website21. Data for non-hematopoeitic cancer cells was extracted from the v21.data.gex_global_analysis.txt table and plotted using Prism.
Code availability
The casTLE statistical framework software for analysis of data from the CRISPR screen can be accessed at bitbucket.org/dmorgens/castle. Bowtie software can be accessed at bowtie-bio.sourceforge.net/bowtie2/index.shtml. MATLAB image analysis software to analyze lipid droplet distributions can be obtained at www.dropletproteome.org.
Statistical analysis and reproducibility
All figures, including western blots, dose response curves and enzymatic activity assay panels are representative of two biological replicates unless stated otherwise. Images are representative of at least n = 10 imaged cells. P values for pairwise comparisons were calculated using the two tailed t-test. For comparison across multiple experimental groups, P values were calculated using one way ANOVA, and adjusted using Bonferroni correction for multiple comparisons. For figures 4a,b and 10a,b, the normalized z-scored Pearson correlation coefficients were obtained from CTRP v2 (portals.broadinstitute.org). For xenograft experiments, all mice were randomized following tumor cell injection into treatment groups. Outliers were identified using the Grubbs method, and were removed from analyses. To compare between groups of mice in each time point, P values were calculated using the unpaired, two way t-test.
Data Availability Statement
All data that support the conclusions in this manuscript are available from the corresponding author upon reasonable request. Raw data for figure 1 can be accessed in Supplementary Table 1. Raw data for figure 3 can be accessed in Supplementary Table 3. Raw data for figure 4 can be accessed in Supplementary Table 4 and are publicly available from the CCLE and CTRP databases (portals.broadinstitute.org).
Extended Data
Extended Data Fig. 1. Synthetic lethal screen coverage and validation.
a, Distribution of counts across all sgRNA elements from the CRISPR/Cas9 screen. b, Western blot of control and FSP1KO cells. c,d, Western blot analysis (c) and dose response of RSL3-induced death (d) of FSP1KO cells expressing doxycycline-inducible, untagged FSP1. e, Time-lapse analysis of cell death of FSP1KO cells expressing inducible, untagged FSP1. f, Flow cytometric analysis of caspase 3/7 activity in FSP1KO cells expressing inducible, untagged FSP1 treated with doxycycline for 48 hr. For a positive control, non-induced cells were treated with 50 μM etoposide for 24 hr prior to analysis. g, Western blot analysis of lysates from control cells treated with 10 μM Nutlin-3 for 48 hr. h, Dose response of ML162 and Erastin2-induced cell death. i,j, Dose response of rotenone-induced death of control (i) and FSP1KO (j) cells. k,l, Dose response of hydrogen peroxide-induced death of control (k) and FSP1KO (l) cells. m, Dose response of RSL3-induced cell death in the presence of inhibitors of apoptosis (ZVAD(OMe)-FMK: 10 μM) and necroptosis (necrostatin-1: 1 μM). n, Western blot analysis of lysates from ACSL4KO and FSP1KO/ACSL4KO cells. o, Schematic of domains present in AIF and FSP1. For figures d,i-m, shading indicates 95% confidence intervals for the fitted curves and each data point is the average of 3 technical replicates. Figures are representative of two biological replicates except figures c-e and k,l, which show single experiments.
Extended Data Fig. 2. Subcellular distribution of FSP1.
a, Inducible FSP1-GFP cells were transiently transfected with Lyn11-mCherry-FRB for 24 hr, induced with doxycycline for 48 hr and fixed prior to imaging. b, FSP1-GFP cells were treated with 200 μM oleate for 24 hr to induce LDs and treated with 100 μM AutoDOT to label LDs prior to imaging. c, Line intensity plots showing colocalization between FSP1-HaloTag and organelle markers. d-f, Confocal and TIRF microscopy of FSP1-HaloTag (d), and inducible FSP1(WT)-GFP (e) and FSP1(G2A)-GFP (f) cells. g, FSP1-HaloTag cells were transiently transfected with BFP-Sec61 for 48 hr prior to imaging to label the endoplasmic reticulum. h, FSP1-HaloTag cells were incubated with 100 nM MitoTracker Green FM to label mitochondria. i, Plasma membrane subdomains from control cells were enriched by OptiPrep gradient centrifugation. Endo., endogenous FSP1. Western blot is representative of two biological replicates. Images are representative of at least n = 10 imaged cells. Image scale bars = 10 μm.
Extended Data Fig. 3. Myristoylation and lipid droplet localization of FSP1.
a, Schematic showing the procedure for metabolic labeling of cells with the myristate-alkyne YnMyr and conjugation of YnMyr-labeled proteins with TAMRA-biotin using click chemistry. b, Analysis of FSP1 myristoylation in LD-enriched buoyant fractions by streptavidin enrichment of YnMyr-labeled proteins, click chemistry and SDS-PAGE. Cells were treated with 200 μM oleate to induce LDs and with 100 μM YnMyr or 100 μM myristate for 24 hr. c, FSP1-GFP was induced with doxycycline for 24 hr and cells were incubated with 100 μM YnMyr for an additional 24 hr to label proteins in the presence or absence of 75 μM emetine. YnMyr-labeled proteins were affinity-purified and analyzed by click chemistry and SDS-PAGE. d, LD-enriched buoyant fractions from cells expressing inducible FSP1-GFP were isolated by sucrose gradient fractionation and analyzed by western blot. Endo., endogenous FSP1. e, Inducible FSP1-GFP cells were treated with 200 μM oleate in the presence or absence of 10 μM NMT inhibitor, fixed, and stained with anti-PLIN2 antibody prior to imaging. Images are representative of at least n = 10 imaged cells. Scale bar = 10 μm. f, Western blot analysis of FSP1KO cells induced for 48 hr with doxycycline to express the indicated proteins. All figures are representative of two biological replicates.
Extended Data Fig. 4. Targeting of FSP1 to subcellular compartments.
a, Western blot analysis of FSP1KO cells induced for 48 hr with doxycycline to express the indicated proteins. b, Live cell microscopy of cells expressing the indicated FSP1(G2A)-GFP constructs, incubated with 100 nM Mitotracker Orange to label mitochondria, 1 μM BODIPY 558/568 C12 to label LDs or 5 μg/mL Cell Mask to label the plasma membrane. To label the endoplasmic reticulum, cells were transiently transfected with BFP-Sec61 48 hr prior to imaging. Images are representative of at least n = 10 imaged cells. Line intensity plots show colocalization between FSP1 and organelle markers. Scale bar = 10 μm. c, Plasma membrane subdomains from FSP1KO cells expressing inducible Lyn11-FSP1(G2A)-GFP were enriched by OptiPrep gradient centrifugation. The densitometry plot indicates the distribution of overexpressed and endogenous proteins. Figures are representative of two biological replicates except figure c, which shows a single experiment.
Extended Data Fig. 5. Lipid droplets are not required for inhibition of ferroptosis by FSP1.
a, Control cells were treated with inhibitors of DGAT1 (20 μM T863) and DGAT2 (10 μM PF-06424439) for 48 hr, stained with 1 μM BODIPY 493/503 and imaged by fluorescence microscopy. The image is representative of n = 50 imaged fields. Scale bar = 10 μm. b, The size and number of LDs were quantified from cells (n > 5000) in panel (a). c, Dose response of RSL3-induced cell death of control cells pretreated for 48 hr with 20 μM T863 and 10 μM PF-06424439 prior to addition of RSL3. Each data point is the average of 3 technical replicates. All figures are representative of two biological replicates.
Extended Data Fig. 6. Analysis of lipid peroxidation, glutathione and lipid levels in FSP1KO cells.
a,b, Ratio of oxidized to total BODIPY 581/591 C11 from images in figure 3a, at the plasma membrane (b) or at internal membranes (c). Each data point represents an individual cell quantified in one of two biological replicates. For (a), Cas9ctl DMSO, n = 34; Cas9ctl RSL3, n = 45; FSP1KO DMSO, n = 30; FSP1KO RSL3, n = 33; ***P < 0.001 by one-way ANOVA. For (b), Cas9ctl DMSO, n = 33; Cas9ctl RSL3, n = 45; FSP1KO DMSO, n = 30; FSP1KO RSL3, n = 33; ***P < 0.001 by one-way ANOVA. Error bars show mean ± SD. c, Total intracellular glutathione (GSH + GSSG) levels in control and FSP1KO were determined following treatment with 250 nM RSL3 or 1 μM Erastin2. The graph shows mean ± SD of n = 3 biological replicates. n.s., FSP1KO DMSO versus RSL3, P = 0.7278; n.s., FSP1KO RSL3 versus Cas9ctl RSL3, P = 0.1522, **P = 0.0072 by one-way ANOVA. d,e, GSH and GSSG levels in control and FSP1KO were measured. Where indicated, cells were treated with 1 μM Erastin2. The graph shows mean ± SD of n = 3 biological replicates. n.s., GSH P = 0.6269; n.s., GSSG P = 0.8284 by two-tailed t-test. f, The plot shows the average of the fold change in lipids measured in two FSP1KO cell lines, generated using sgRNA 1 and sgRNA 2, relative to control cells. Cas9ctl, n = 5; KO1, n = 4; KO2, n = 5 biological replicates (Supplemental Table 3). g, Levels of select lipid species in biological replicates of control and FSP1KO cells measured in (f). The average values are indicated. 16:0 20:4 PE, **P = 0.0017; 18:0 20:4 PE, **P = 0.0011; 18:0 LPE, KO2 **P = 0.0036, KO1 **P = 0.0019; 16:0 LPE, KO2 *P = 0.0133, KO1 *P = 0.0335 by two-tailed t-test.
Extended Data Fig. 7. Analysis of the FSP1 oxidoreductase mutant.
a. FSP1KO cells were treated with 250 nM RSL3 and 10 μM idebenone or 50 μM DFO for 75 min, labeled with BODIPY 581/591 C11 and fixed prior to imaging. Ox. = oxidized; Non-ox. = non-oxidized. Images are representative of at least n = 10 cells imaged for each treatment condition. Scale bar = 20 μm. b, Sequence alignment showing residues conserved between AIF and FSP1. The arrow points to E313 in AIF (aligns to E156 in FSP1) that functions in FAD binding. c, Structural alignment between the crystal structure of mouse AIF (PDB 1GV4) and the Phyre2-generated model of FSP1. d, Live cell microscopy of FSP1KO cells expressing inducible FSP1(E156A)-GFP labeled with 5 μg/mL Cell Mask. The image is representative of at least n = 10 imaged cells. Scale bar = 10 μm. e, Plasma membrane subdomains from FSP1KO cells expressing FSP1(E156A)-GFP were enriched by OptiPrep gradient centrifugation. f, SDS-PAGE and Coomassie brilliant blue stain of recombinant His-FSP1(WT) and His-FSP1(E156A) purified with Ni-NTA agarose beads. g, Reduction of resazurin by recombinant FSP1 in the presence of NADH. h, Oxidation of NADH by recombinant FSP1 in the presence of coenzyme Q1. Figures g,h are representative of two biological replicates, and figure e shows a single experiment.
Extended Data Fig. 8. Lipid peroxidation in CoQ-depleted cells.
a, Total CoQ levels in control and FSP1KO cells treated for 48 hr with 3 mM 4-CBA. The graph shows mean ± SD of n = 3 biological replicates. ***P = 0.0007; *P = 0.0132 by two-tailed t-test. b, Dose response of RSL3-induced death of inducible FSP1-GFP cells pretreated for 48 hr with 3 mM 4-CBA and doxycycline prior to addition of RSL3. Shading indicates 95% confidence intervals for the fitted curves and each data point is the average of 3 technical replicates. The figure is representative of two biological replicates. c, Genomic sequencing of the COQ2 gene in COQ2KO and FSP1KO/COQ2KO cells. The ATG start codon is boxed in the COQ2 consensus sequence. d, Control and COQ2KO cells treated with 250 nM RSL3 for 3 hr were labeled with BODIPY 581/591 C11 and fixed prior to imaging. Ox. = oxidized; Non-ox. = non-oxidized. e, COQ2KO cells were treated with 250 nM RSL3 and 10 μM idebenone or 50 μM DFO for 3 hr, labeled with BODIPY 581/591 C11 and fixed prior to imaging. Ox. = oxidized; Non-ox. = non-oxidized. For figures d,e, images are representative of at least n = 10 cells imaged for each treatment condition. Image scale bars = 20 μm.
Extended Data Fig. 9. Role of NQO1 in ferroptosis resistance.
a, Western blot analysis of lysates from NQO1KO and NQO1KO/FSP1KO cells. b, Dose response of RSL3-induced death of control and NQO1KO cells. c, Dose response of RSL3-induced death of FSP1KO and NQO1KO/FSP1KO cells. Cells in (b,c) were generated using NQO1 sgRNA 1. d, Western blot analysis of lysates of FSP1KO cells expressing doxycycline-inducible NQO1-GFP. e, Live cell microscopy of inducible NQO1-GFP cells labeled with 5 μg/mL Cell Mask. f, Plasma membrane subdomains from FSP1KO cells expressing NQO1-GFP were enriched by OptiPrep gradient centrifugation. g, Dose response of RSL3-induced death of FSP1KO cells expressing the indicated inducible constructs. h, Live cell microscopy of FSP1KO cells expressing inducible Lyn11-NQO1-GFP cells labeled with 5 μg/mL Cell Mask. i, Dose response of RSL3-induced death of FSP1KO expressing the indicated inducible constructs. For figures b,c,g,i, shading indicates 95% confidence intervals for the fitted curves and each data point is the average of 3 technical replicates. Figures are representative of two biological replicates except figures f,I, which show the results of single experiments. For figures e,h, the images are representative of at least n = 10 imaged cells. Image scale bars = 10 μm.
Extended Data Fig. 10. The role of FSP1 in cancer.
a,b, High expression of FSP1 is correlated with resistance to the GPX4 inhibitors ML210 (a) and ML162 (b) in non-hematopoietic cancer cells. Plotted data was mined from the CTRP database that contains correlation coefficients between gene expression and drug sensitivity for 907 cancer cell lines treated with 545 compounds. Plotted values are z-scored Pearson’s correlation coefficients. c, Western blot of FSP1 expression in a panel of lung cancer lines. d, Western blot of lysates from control and FSP1KO H460 cells. e, EC50 RSL3 dose for the indicated H460 cell lines was calculated from the results in Fig. 1d. Bars indicate 95% confidence intervals. f, Western blot of lysates from control and H1703 cells. g, EC50 RSL3 dose for the indicated H1703 cell lines was calculated from the results in Fig. 1e. Bars indicate 95% confidence intervals. h, Western blot analysis of H446 cells expressing doxycycline-inducible FSP1-GFP. i, Dose response of RSL3-induced death of control and FSP1-GFP H446 cells. j, Western blot of lysates from GPX4KO and GPX4KO/FSP1KO H460 cells. k, GPX4KO H460 tumor xenografts cells were initiated in immune-deficient SCID mice (n = 16). Following 5 days of daily Fer1 injections (2 mg/kg) to allow lines to develop tumors, one set of mice (n = 8) continued to receive daily Fer1 injections and a second set (n = 8) received vehicle injections for the remaining 17 days. The distribution of fold changes in sizes of individual tumors during the treatment is shown. GPX4KO (−) Fer1, n = 7; GPX4KO (+) Fer1, n = 7. l, Dose response of IKE-induced death of control and FSP1KO U-2 OS cells. m, Dose response of IKE-induced death of control and FSP1KO H460 cells. n,o, Control (n) and FSP1KO (o) H460 tumor xenografts were initiated in immune-deficient SCID mice (n = 16). After 10 days, each group of mice (n = 8) was injected daily with 40 mg/kg IKE or vehicle. The distribution of fold changes in sizes of individual tumors during the treatment is shown. Cas9KO (−) IKE, n = 4; Cas9KO (+) IKE, n = 4; FSP1KO (−) IKE, n = 7; FSP1KO (+) IKE, n = 4. For figures k,n,o box plots show median, 25th and 75th percentiles, minima and maxima of the distributions. Figures are representative of two biological replicates expect figures l,m, which show the results of single experiments. For figures i,l,m, shading indicates 95% confidence intervals for the fitted curves and each data point is the average of 3 technical replicates.
Supplementary Material
ACKNOWLEDGEMENTS
This research was supported by grants from the National Institutes of Health (R01GM112948 to J.A.O., 1R01GM122923 to S.J.D., P42 ES004705 to D.K.N., and 1DP2CA195761–01 to R.Z.). J.A. Olzmann is a Chan Zuckerberg Biohub investigator. D.K.N. was supported by a Cancer Research ASPIRE award from the Mark Foundation. P.H.T. was supported by the Internal Research Fund of the Division of Pathology and Laboratory Medicine, Cincinnati Children’s Hospital Medical Center. We thank Pin-Joe Ko (Stanford) for assistance with confocal imaging, and Dara Leto (Stanford) and Ron Kopito (Stanford) for helpful discussions.
Footnotes
COMPETING INTERESTS
S.J.D. is a member of the scientific advisory board for Ferro Therapeutics.
REFERENCES
- 1.Dixon SJ et al. Ferroptosis: an iron-dependent form of nonapoptotic cell death. Cell 149, 1060–1072 (2012). [DOI] [PMC free article] [PubMed] [Google Scholar]
- 2.Stockwell BR et al. Ferroptosis: A regulated cell death nexus linking metabolism, redox biology, and disease. Cell 171, 273–285 (2017). [DOI] [PMC free article] [PubMed] [Google Scholar]
- 3.Yang WS et al. Regulation of ferroptotic cancer cell death by GPX4. Cell 156, 317–331 (2014). [DOI] [PMC free article] [PubMed] [Google Scholar]
- 4.Ingold I et al. Selenium Utilization by GPX4 Is Required to Prevent Hydroperoxide-Induced Ferroptosis. Cell 172, 409–422.e21 (2018). [DOI] [PubMed] [Google Scholar]
- 5.Dixon SJ & Stockwell BR The hallmarks of ferroptosis. Annu. Rev. Cancer Biol 3, 35–54 (2019). [Google Scholar]
- 6.Zou Y et al. A GPX4-dependent cancer cell state underlies the clear-cell morphology and confers sensitivity to ferroptosis. Nat. Commun 10, 1617 (2019). [DOI] [PMC free article] [PubMed] [Google Scholar]
- 7.Wu M, Xu L-G, Li X, Zhai Z & Shu H-B AMID, an apoptosis-inducing factor-homologous mitochondrion-associated protein, induces caspase-independent apoptosis. J. Biol. Chem 277, 25617–25623 (2002). [DOI] [PubMed] [Google Scholar]
- 8.Ohiro Y et al. A novel p53-inducible apoptogenic gene, PRG3, encodes a homologue of the apoptosis-inducing factor (AIF). FEBS Lett. 524, 163–171 (2002). [DOI] [PubMed] [Google Scholar]
- 9.Dixon SJ et al. Pharmacological inhibition of cystine-glutamate exchange induces endoplasmic reticulum stress and ferroptosis. Elife 3, e02523 (2014). [DOI] [PMC free article] [PubMed] [Google Scholar]
- 10.Bersuker K et al. A Proximity Labeling Strategy Provides Insights into the Composition and Dynamics of Lipid Droplet Proteomes. Dev. Cell 44, 97–112.e7 (2018). [DOI] [PMC free article] [PubMed] [Google Scholar]
- 11.Heal WP, Wickramasinghe SR, Leatherbarrow RJ & Tate EW N-Myristoyl transferase-mediated protein labelling in vivo. Org. Biomol. Chem 6, 2308–2315 (2008). [DOI] [PubMed] [Google Scholar]
- 12.Magtanong L et al. Exogenous Monounsaturated Fatty Acids Promote a Ferroptosis-Resistant Cell State. Cell Chem. Biol 26, (2018). [DOI] [PMC free article] [PubMed] [Google Scholar]
- 13.Tribble DL et al. Oxidative susceptibility of low density lipoprotein subfractions is related to their ubiquinol-10 and alpha-tocopherol content. Proc. Natl. Acad. Sci. USA 91, 1183–1187 (1994). [DOI] [PMC free article] [PubMed] [Google Scholar]
- 14.Stocker R, Bowry VW & Frei B Ubiquinol-10 protects human low density lipoprotein more efficiently against lipid peroxidation than does alpha-tocopherol. Proc. Natl. Acad. Sci. USA 88, 1646–1650 (1991). [DOI] [PMC free article] [PubMed] [Google Scholar]
- 15.Yang WS et al. Peroxidation of polyunsaturated fatty acids by lipoxygenases drives ferroptosis. Proc. Natl. Acad. Sci. USA 113, E4966–75 (2016). [DOI] [PMC free article] [PubMed] [Google Scholar]
- 16.Marshall KR et al. The human apoptosis-inducing protein AMID is an oxidoreductase with a modified flavin cofactor and DNA binding activity. J. Biol. Chem 280, 30735–30740 (2005). [DOI] [PubMed] [Google Scholar]
- 17.Shimada K et al. Global survey of cell death mechanisms reveals metabolic regulation of ferroptosis. Nat. Chem. Biol 12, 497–503 (2016). [DOI] [PMC free article] [PubMed] [Google Scholar]
- 18.Arroyo A, Navarro F, Navas P & Villalba JM Ubiquinol regeneration by plasma membrane ubiquinone reductase. Protoplasma 205, 107–113 (1998). [Google Scholar]
- 19.Takahashi T, Okamoto T, Mori K, Sayo H & Kishi T Distribution of ubiquinone and ubiquinol homologues in rat tissues and subcellular fractions. Lipids 28, 803–809 (1993). [DOI] [PubMed] [Google Scholar]
- 20.Sun X et al. Activation of the p62-Keap1-NRF2 pathway protects against ferroptosis in hepatocellular carcinoma cells. Hepatology 63, 173–184 (2016). [DOI] [PMC free article] [PubMed] [Google Scholar]
- 21.Rees MG et al. Correlating chemical sensitivity and basal gene expression reveals mechanism of action. Nat. Chem. Biol 12, 109–116 (2016). [DOI] [PMC free article] [PubMed] [Google Scholar]
- 22.Hangauer MJ et al. Drug-tolerant persister cancer cells are vulnerable to GPX4 inhibition. Nature 551, 247–250 (2017). [DOI] [PMC free article] [PubMed] [Google Scholar]
- 23.Viswanathan VS et al. Dependency of a therapy-resistant state of cancer cells on a lipid peroxidase pathway. Nature 547, 453–457 (2017). [DOI] [PMC free article] [PubMed] [Google Scholar]
- 24.Zhang Y et al. Imidazole ketone erastin induces ferroptosis and slows tumor growth in a mouse lymphoma model. Cell Chem. Biol 26, 623–633.e9 (2019). [DOI] [PMC free article] [PubMed] [Google Scholar]
- 25.Hayano M, Yang WS, Corn CK, Pagano NC & Stockwell BR Loss of cysteinyl-tRNA synthetase (CARS) induces the transsulfuration pathway and inhibits ferroptosis induced by cystine deprivation. Cell Death Differ. 23, 270–278 (2016). [DOI] [PMC free article] [PubMed] [Google Scholar]
- 26.Inoue T, Heo WD, Grimley JS, Wandless TJ & Meyer T An inducible translocation strategy to rapidly activate and inhibit small GTPase signaling pathways. Nat. Methods 2, 415–418 (2005). [DOI] [PMC free article] [PubMed] [Google Scholar]
- 27.Macdonald JL & Pike LJ A simplified method for the preparation of detergent-free lipid rafts. J. Lipid Res 46, 1061–1067 (2005). [DOI] [PubMed] [Google Scholar]
- 28.Morgens DW et al. Genome-scale measurement of off-target activity using Cas9 toxicity in high-throughput screens. Nat. Commun 8, 15178 (2017). [DOI] [PMC free article] [PubMed] [Google Scholar]
- 29.Nguyen TB et al. DGAT1-Dependent Lipid Droplet Biogenesis Protects Mitochondrial Function during Starvation-Induced Autophagy. Dev. Cell 42, 9–21.e5 (2017). [DOI] [PMC free article] [PubMed] [Google Scholar]
- 30.Tang PH, Miles MV, DeGrauw A, Hershey A & Pesce A HPLC analysis of reduced and oxidized coenzyme Q(10) in human plasma. Clin. Chem 47, 256–265 (2001). [PubMed] [Google Scholar]
Associated Data
This section collects any data citations, data availability statements, or supplementary materials included in this article.
Supplementary Materials
Data Availability Statement
All data that support the conclusions in this manuscript are available from the corresponding author upon reasonable request. Raw data for figure 1 can be accessed in Supplementary Table 1. Raw data for figure 3 can be accessed in Supplementary Table 3. Raw data for figure 4 can be accessed in Supplementary Table 4 and are publicly available from the CCLE and CTRP databases (portals.broadinstitute.org).


