Abstract
Purpose
To evaluate the performance of deep learning for robust and fully automated quantification of epicardial adipose tissue (EAT) from multicenter cardiac CT data.
Materials and Methods
In this multicenter study, a convolutional neural network approach was trained to quantify EAT on non–contrast material–enhanced calcium-scoring CT scans from multiple cohorts, scanners, and protocols (n = 850). Deep learning performance was compared with the performance of three expert readers and with interobserver variability in a subset of 141 scans. The deep learning algorithm was incorporated into research software. Automated EAT progression was compared with expert measurements for 70 patients with baseline and follow-up scans.
Results
Automated quantification was performed in a mean (± standard deviation) time of 1.57 seconds ± 0.49, compared with 15 minutes for experts. Deep learning provided high agreement with expert manual quantification for all scans (R = 0.974; P < .001), with no significant bias (0.53 cm3; P = .13). Manual EAT volumes measured by two experienced readers were highly correlated (R = 0.984; P < .001) but with a bias of 4.35 cm3 (P < .001). Deep learning quantifications were highly correlated with the measurements of both experts (R = 0.973 and R = 0.979; P < .001), with significant bias for reader 1 (5.11 cm3; P < .001) but not for reader 2 (0.88 cm3; P = .26). EAT progression by deep learning correlated strongly with manual EAT progression (R = 0.905; P < .001) in 70 patients, with no significant bias (0.64 cm3; P = .43), and was related to an increased noncalcified plaque burden quantified from coronary CT angiography (5.7% vs 1.8%; P = .026).
Conclusion
Deep learning allows rapid, robust, and fully automated quantification of EAT from calcium scoring CT. It performs as well as an expert reader and can be implemented for routine cardiovascular risk assessment.
© RSNA, 2019
See also the commentary by Schoepf and Abadia in this issue.
Summary
Deep learning allows for fast, robust, and fully automated quantification of epicardial adipose tissue from non–contrast material–enhanced calcium-scoring CT.
Key Points
■ Deep learning can be used for robust and fast epicardial adipose tissue quantification, with performance similar to that of a human expert.
■ Progression of epicardial adipose tissue volume as detected by the deep learning system showed strong agreement with the expert reader and was related to increase in noncalcified coronary plaque volume.
Introduction
Epicardial adipose tissue (EAT) is a visceral fat deposit surrounding the coronary arteries that produces proinflammatory cytokines (1). EAT volume helps to predict the development of atherosclerosis (2–4) and is related to atrial fibrillation when adjusted for risk factors (5). EAT density has also recently been related to subclinical atherosclerosis and major adverse cardiac events (6,7). In addition, it was suggested that systematic quantification of EAT in clinical routine could improve risk assessment in asymptomatic patients with no prior coronary artery disease (8). The feasibility and reproducibility of quantifying EAT from non–contrast material–enhanced CT performed for coronary artery calcium (CAC) scoring have been demonstrated (9).
However, it remains a tedious manual process and is not suitable for clinical practice. Semiautomated EAT quantification has been widely investigated (10–14) but still lacks a robust, fast, validated solution. Deep learning methods, especially convolutional neural networks (CNNs), have been extensively used for automated image segmentation, such as segmentation of cardiac structures from both MR images and contrast-enhanced CT images (15). A previously proposed deep learning method based on two CNNs allowed automated quantification in a single-center, single-protocol cohort of 250 non–contrast-enhanced CT scans (16); however, large-scale application has still not been described.
Our study objective was to develop an improved CNN architecture and training method and to validate it in the largest dataset to date with multicenter CT data and multiple expert reader annotations for automated quantification of EAT volume and density. We also aimed to test the proposed approach by comparing it to interreader variability and to manually quantified EAT changes on serial scans. We further assessed the clinical relevance of automated EAT quantification by comparing its volumetric progression to high-risk noncalcified plaque progression measured at coronary CT angiography.
Materials and Methods
Data and Study Design
Population.—This study was based on non–contrast-enhanced CT data from consecutive patients undergoing routine CAC scoring. Scans were obtained from four different cohorts in three centers: (a) consecutive patients from the Early Identification of Subclinical Atherosclerosis by Noninvasive Imaging Research (EISNER) trial (17) (August 2002–January 2005) and (b) a cohort of patients undergoing serial cholesterol measurements, CAC scoring, and coronary CT angiography measurements (the low-density lipoprotein [LDL] cohort) (18) (March 2007–June 2015), both at Cedars-Sinai Medical Center, Los Angeles, Calif; (c) consecutive patients undergoing CAC scoring at the Friedrich-Alexander University Erlangen-Nürnberg, Erlangen, Germany (January 2018–February 2018); and (d) consecutive patients undergoing CAC scoring at the Yonsei University, Seoul, Korea (March 2017–July 2018).
Cohorts and risk factors are described in Table 1. In each cohort, non–contrast-enhanced CT images were acquired with prospective electrocardiographic triggering according to the standard protocol and a section collimation of 1.5, 2.5, or 3 mm extending over the heart. The CT scanners, reconstruction protocols, and voxel sizes used in these cohorts are listed in Table 2. The institutional review boards of the study centers approved this multicenter study, and all patients provided written informed consent.
Table 1:
Population and Risk Factors
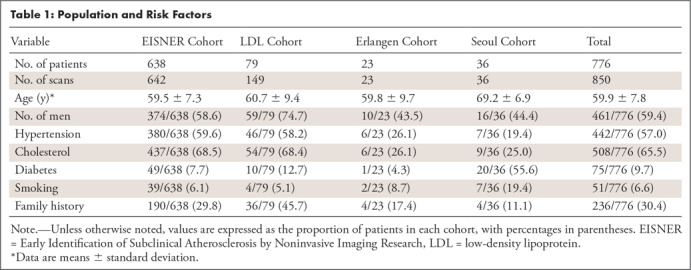
Table 2:
Scanning and Reconstruction Characteristics of the Study Cohorts

Teaching the deep learning model to quantify EAT.— A stratified 10-fold cross-validation was used to teach the deep learning model with the first dataset of 614 scans (EISNER, 431; LDL, 149; Erlangen, 23; Seoul, 11) from 540 patients (320 of 540 [59.3%] were men; mean age ± standard deviation, 60.1 years ± 7.8). For each fold, the dataset was separated into three subsets: a training subset (80%) used to optimize the computational graph of the model; a validation subset (10%) used to evaluate the best configuration, state of the model, and hyperparameter tuning; and a test subset (10%) used to assess the performance of the model. More details on the model training are provided in the section “Implementation and Training of the Deep Learning Method.” During this process, 10 versions of the model were obtained, providing results for all 614 scans. By using these results, model quantifications were compared with manual measurements. We also compared the performance of the model to interobserver variability in a subset of 141 scans from the EISNER cohort and to manual measurement for EAT volume progression in a subset of 70 patients with serial scans from the LDL cohort, as described in the section “Quantitative EAT and Coronary Plaque Progression from Coronary CT Angiography.”
Additional validation of the deep learning model.— After the development of the method, a final model was trained with all of the scans from the first dataset. A second dataset of 236 new scans (EISNER, 211; Seoul, 25) was used for the validation and additional evaluation of the final model. None of these scans had been included in the previous stage of model development. From this dataset, 85 scans from the EISNER cohort were used to select the best state of the model. The remaining 151 scans were used to assess performance. Thus, EAT biomarkers were compared between the algorithm and the expert readers for a total of 765 scans (the entire first dataset of 614 scans and 151 additional scans from the second dataset); automatically quantified EAT biomarkers from these scans were compared with clinical risk factors.
Expert Reader Manual Measurements
To manually measure EAT, superior and inferior limits of the pericardium were first identified as the bifurcation of the pulmonary trunk and the posterior descending artery, respectively. For each section between the limits, a contour was manually drawn on the pericardium to define the intrapericardial soft tissues. Fat tissue was identified by using the standard fat attenuation range, from −190 HU to −30 HU. Median filtering was applied to limit noise. The total volume of EAT was then quantified from the number of fat voxels inside the pericardial contour, and mean EAT density was obtained as the mean attenuation in Hounsfield units. Manual measurements were performed by three expert readers. To assess the interobserver variability, a subset of 141 scans from the EISNER trial was independently annotated by two experienced readers (M.G., >3 years of relevant experience, A.R. >4 years of relevant experience) who were blinded to each other’s annotations. The QFAT (version 2.0) research software tool developed at Cedars-Sinai Medical Center was used for the manual measurement.
Quantitative EAT and Coronary Plaque Progression from Coronary CT Angiography
The LDL cohort comprised 79 patients who underwent electrocardiographically triggered non–contrast-enhanced CT, followed by coronary CT angiography for clinical indications. The acquisition protocol for coronary CT angiography has been previously described (18). After a median follow-up time of 3.67 years (interquartile range [IQR], 2.04–4.61 years), a subset of 70 patients underwent follow-up scanning with the use of the same imaging protocol. EAT progression was defined by subtracting the baseline EAT volume from the EAT measured at follow-up. Coronary plaque was quantified during each coronary CT angiographic examination at baseline and follow-up by using semiautomated software (Autoplaque, version 2.0; Cedars-Sinai Medical Center) as described previously (18), and noncalcified and calcified plaque were characterized. Patients were separated into two groups (n = 33 and 37) on the basis of their increase in noncalcified plaque volume.
Implementation and Training of the Deep Learning Method
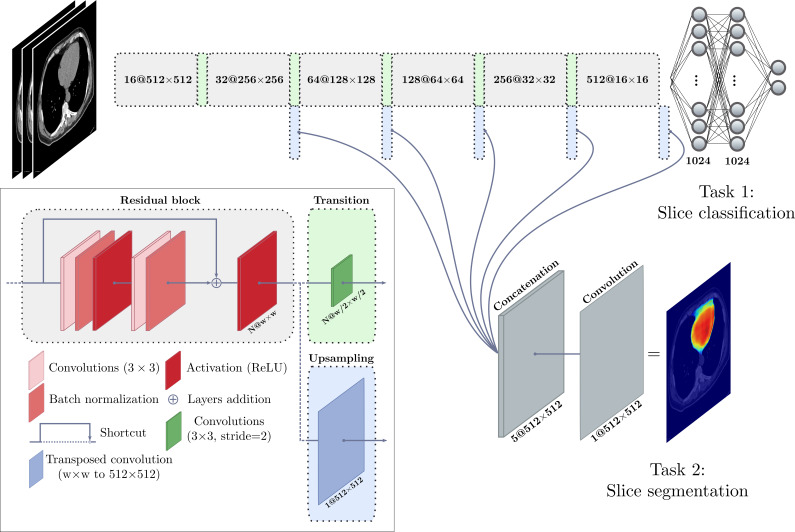
We implemented our deep learning model by using a CNN with the TensorFlow framework, version 1.10.1 (http://www.tensorflow.org), and the Keras library, version 2.2.2 (https://keras.io). Our network consists of a multitask computational graph that, similarly to the expert performing manual measurement, (a) identifies the inferior and superior limits of the heart and (b) segments the interior region of the pericardium. The graph is provided with three consecutive axial sections: the one to be classified and segmented, as well as the previous and next sections. The EAT in a whole scan is quantified by repeating this procedure for each section and applying the postprocessing steps, including median filtering and Hounsfield unit thresholding for fat tissue. Residual learning was used to optimize deeper networks (19). The graph architecture is presented in Figure 1.
Figure 1:
Illustration shows the deep learning model used for quantification of epicardial adipose tissue. A deep convolutional neural network was trained to perform intrapericardial segmentation. Each section (or slice) of a scan is given as input with the immediate previous and next sections. The model performs a first task of classification to determine whether the input section is located between heart limits (see text) and performs segmentation of the pericardium as a second task. ReLU = rectified linear unit.
For each fold of the 10-fold cross-validation, data augmentation was used by applying random affine transforms and Gaussian noise to the training data during model training. Optimization was performed by using the Adam method (20) to minimize the binary cross-entropy for classification and to maximize the Dice score coefficient (21) for segmentation, which is used to measure the overlap between two structures, with values ranging from 0 (no overlap) to 1 (same structures). Xavier initialization (22) was used, along with a starting learning rate set to 1e-3; the learning rate decreased to 1e-4 after the loss plateaued. A mini-batch strategy was used with a batch size of 20. Input images were all mean centered initially; batch normalization layers were then used in residual blocks (Fig 1). Validation was performed after every epoch by computing the Dice score coefficient on each scan from the training and validation subsets. Training and validation loss curves were monitored to ensure optimal convergence and reduce overfitting. The state of the model providing the best result on the validation data in terms of the median Dice score coefficient was used for the evaluation on the test subset.
Statistical Analysis and Evaluation
EAT volumes automatically quantified by the model were compared with EAT volumes manually measured by the readers on the test data. Agreement was assessed by using correlation and Bland-Altman analysis. For intraobserver comparison, we also report the repeatability coefficient, defined as 1.96 times the standard deviation between the two readers. Because several patients had two scans or expert measurements, mixed-effect modeling was used in the global comparison. The adjusted correlation coefficient was obtained from the marginal R2, computed as proposed by Nakagawa et al (23). Wilcoxon signed-rank or Wilcoxon rank-sum tests were used to assess significant differences between automated and manual quantifications. EAT volumes for patients with and without an increased noncalcified plaque volume were compared by using the Wilcoxon rank-sum test. A P value of less than .05 was considered to indicate a statistically significant difference. The statistical analysis was performed in the Python programming language (www.python.org) by using the SciPy package (www.scipy.org) (24).
Results
The mean EAT duration of volume quantification was 1.57 seconds ± 0.49 per scan with the use of computation by a graphics processing unit and 6.37 seconds ± 1.47 with the use of a central processing unit only. The mean duration for manual measurement was 15 minutes.
Results from 10-Fold Cross-Validation
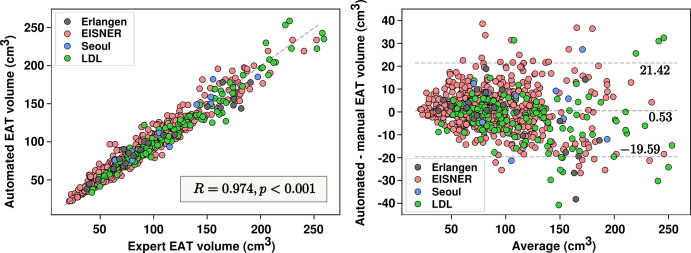
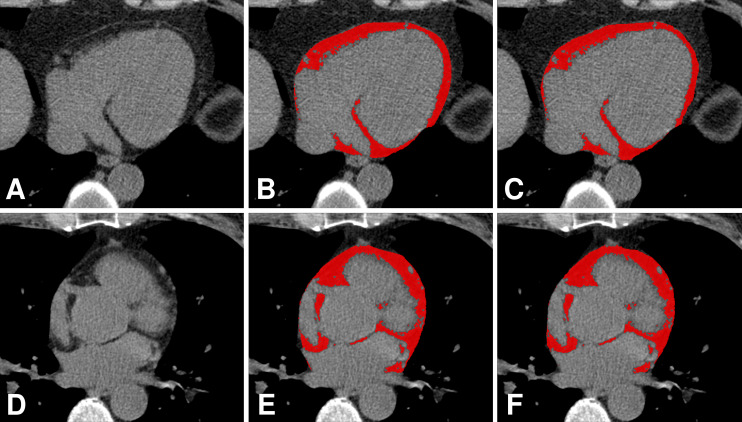
Multicenter and multiprotocol.— Figure 2 summarizes our results from the entire first dataset of 614 scans. The automated approach achieved a median Dice score coefficient of 0.873 (IQR, 0.842–0.895) for EAT segmentation. The median Dice score coefficient in the tuning dataset was 0.871 (IQR, 0.837–0893). Median EAT volumes were 86.75 cm3 (IQR, 64.23–119.61 cm3) and 85.57 cm3 (IQR, 62.49–119.23 cm3) for automated and manual measurements, respectively. After mixed-effect modeling, a high correlation was observed between the readers and the algorithm (R = 0.974; P < .001; Fig 2). Fixed-effect regression between automated and manual EAT volume resulted in a coefficient and intercept of 0.920 and 8.009, respectively; a similar regression was observed for a standard linear model, providing a coefficient and intercept of 0.935 and 6.673, respectively. No significant bias was observed in the automated quantification (0.53 cm3; P = .13). The 95% limits of agreement ranged from −19.59 cm3 to 21.42 cm3. Densities obtained from automated quantifications and manual measurements were highly correlated (R = 0.954; P < .001), with no significant bias (0.06 HU; P = .177). An example of EAT segmentation is presented in Figure 3. Section thickness invariance was also assessed by comparing expert and automated quantifications for scans with section thickness of 1.5 mm, 2.5 mm, and 3 mm separately. No significant differences were found among the three groups (P = .49, P = .40, and P = .45, respectively).
Figure 2:
Automated volume quantifications versus human measurements. Scatterplot (left) and Bland-Altman plot (right) show epicardial adipose tissue (EAT) volume measurements and agreement between the automated quantifications and the expert manual measurements. EISNER = Early Identification of Subclinical Atherosclerosis by Noninvasive Imaging Research, LDL = low-density lipoprotein.
Figure 3:
Comparison of manual annotation by an expert reader and automatic segmentation of epicardial adipose tissue by an algorithm. A, D, Axial non–contrast-enhanced CT images show the heart without the EAT identified; B, E, EAT as identified by the expert (red areas); and C, F, EAT as identified automatically by the algorithm (red areas).
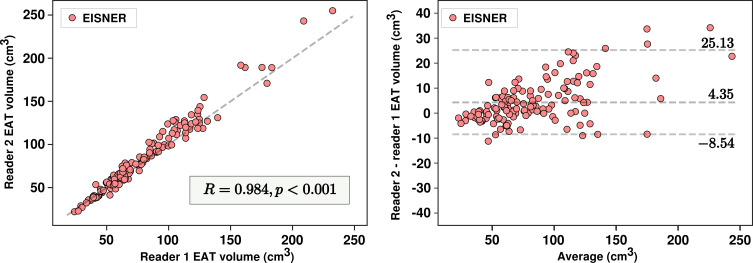
Performance versus interreader variability.— In 141 scans from the EISNER trial with manual measurements from two readers, median EAT volumes were 69.18 cm3 (IQR, 55.74–102.95 cm3) and 75.88 cm3 (IQR, 56.34–112.91 cm3) for readers 1 and 2, respectively. Measured volumes were highly correlated (R = 0.984; P < .001) but presented a significant bias of 4.23 cm3 (P < .001). The 95% limits of agreement by Bland-Altman analysis ranged from −8.54 cm3 to 25.17 cm3, with an absolute range of 33.71 cm3 and a repeatability coefficient of 17.0 cm3 (Fig 4). EAT densities from both readers were highly correlated (R = 0.969; P < .001), but also significantly different (2.54 HU; P < .001), with a repeatability coefficient of 2.6 HU.
Figure 4:
Interreader variability in epicardial adipose tissue (EAT) volume measurements. Scatterplot (left) and Bland-Altman plot (right) show variability in measurements between reader 1 and reader 2. EISNER = Early Identification of Subclinical Atherosclerosis by Noninvasive Imaging Research.
We assessed the performance of the automated model in these 141 scans with manual measurements from both readers and compared the performance to interreader variability. The median volume quantified by the automated method was 79.20 cm3 (IQR, 57.42–110.52 cm3). The algorithm presented excellent correlations for EAT volumes with both experts (R = 0.973, P < .001; R = 0.979, P < .001). A significant difference was observed with reader 1 (5.11 cm3; P < .001) but not with reader 2 (0.88 cm3; P = .26). Automated EAT density was different with both readers (1.83 HU, P < .001; −0.72 HU, P < .001) but was highly correlated (R = 0.964, P < .001; R = 0.963, P < .001). The 95% limits of agreement for volume quantification with both experts ranged from −8.65 cm3 to 22.82 cm3 and from −17.17 cm3 to 17.76 cm3, with absolute ranges of 31.47 cm3 and 34.93 cm3, respectively. These high correlations, similar or even nonsignificant bias, and identical absolute ranges between the 95% limits of agreement suggest that the proposed approach can perform as well as an independent reader.
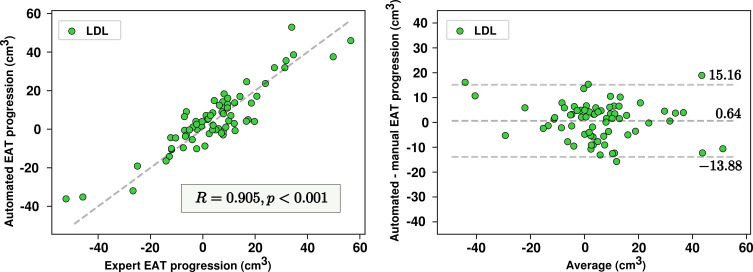
Automated quantification of EAT progression and relation to coronary plaque features.— EAT progression was quantified by the proposed method in the 70 patients from the LDL cohort with serial scans. A high correlation for EAT progression was observed between the automated method and the observer (R = 0.905; P < .001), with no significant bias of 0.64 cm3 (P = .43) (Fig 5). The 95% limits of agreement ranged from −13.88 cm3 to 15.16 cm3. Progression of automatically quantified EAT was associated with an increase in noncalcified plaque burden (5.7% vs 1.8%; P = .026). No significant difference in density change was found between the two groups (0.12 HU; P = .2).
Figure 5:
Algorithm versus human reader for epicardial adipose tissue (EAT) progression on serial scans. Scatterplot (left) and Bland-Altman plot (right) show comparison of automated quantifications and expert measurements for EAT progression. LDL = low-density lipoprotein.
Additional Validation
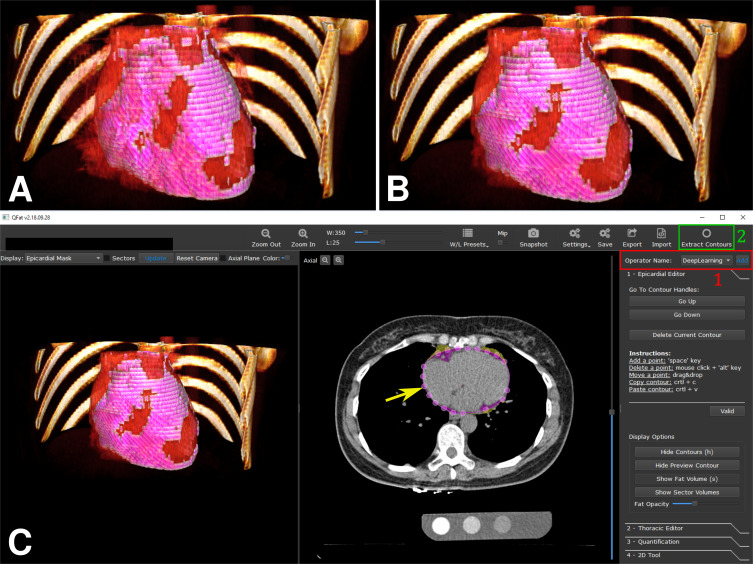
After the 10-fold cross-validation, a subset of 85 scans from the second population (all from EISNER) was used to select the best state of the model, which was then used to quantify EAT on the remaining 151 additional scans (126 from EISNER and 25 from Seoul), for added validation. EAT volumes automatically quantified were highly correlated to EAT volumes measured by readers 2 and 3 (R = 0.975; P < .001). A bias was observed when we considered both cohorts (−1.86 cm3; P = .027) and the 95% limits of agreement ranged from −22.37 cm3 to 15.80 cm3. When we looked at cohorts independently, the differences were significant for scans from the Seoul cohorts (−5.67 cm3; P = .028) but not for scans from the EISNER trial (−1.11 cm3; P = .224). Correlations were still high (R = 0.966, P < .001; R = 0.976, P < .001), and the 95% limits of agreement ranged from −23.30 cm3 to 19.71 cm3 and −19.26 cm3 to 15.63 cm3 for Seoul and EISNER, respectively. The proposed method was integrated in the QFAT research software, allowing the clinician to obtain fast EAT quantification with two clicks (Fig 6).
Figure 6:
Algorithm embedded in research software QFAT. Three-dimensional representations of epicardial adipose tissue (EAT) (EAT in pink overlaid on heart rendered in red), A, as manually identified by the expert and, B, as automatically identified by the algorithm. C, Screenshot of QFAT software with the integrated deep learning approach. The pericardium is automatically identified (yellow arrow) by selecting a new operator (1, red) and by using the “extract contours” option (2, green).
EAT and Risk Factors
An increase in EAT volumes, as quantified by the automated algorithm, was associated with hypertension (increase of 18.02 cm3; P < .001). Similar results were observed for cholesterol (increase of 7.33 cm3; P = .039) and diabetes (increase of 18.33 cm3; P < .001). No significant increase was found in patients with smoking or family history of cardiovascular disease.
Discussion
In this large multicenter and multireader study with different acquisition protocols, we showed that deep learning allows for fast, automated, and accurate quantification of EAT. We demonstrated that our approach performs as well as experienced readers. Our approach could be incorporated into software and potentially reduce the burden imposed on physicians, because it allows EAT to be quantified in seconds. Moreover, we show that the automatically quantified EAT progression is equivalent to EAT progression measured by the expert reader and is related to an increase in high-risk noncalcified plaque burden.
EAT has been associated with major adverse cardiovascular events, and risk assessment in clinical practice could benefit from its routine quantification (2–4,6,8). Because EAT is related to coronary atherosclerosis through early plaque formation and the development of noncalcified and high-risk atherosclerotic plaques (6,25), automated EAT measures in combination with CAC scoring may provide a more accurate method of risk stratification than would otherwise be possible. The main limitation for implementing EAT quantification in practice is the lack of robust and fast automated methods, because manual methods require excessively long processing times.
Automated approaches have been proposed for this purpose, combining atlas-based methods and standard techniques of image processing, such as filtering and classic machine learning, to first perform rough localization of the heart and then refine the pericardium detection (11–13). However, all of these studies were validated in small datasets. In a similar approach of initialization and segmentation refinement, two sequential CNNs were used for the quantification of EAT in a dataset of 250 consecutive scans from the EISNER trial with a single expert reader (16).
In this study, we proposed an improved deep learning–based approach by using only one network for fully automated and fast EAT volume and density quantification, providing high agreement with reader manual measurement in a larger multicenter and multiprotocol dataset of 850 scans. A new training strategy was used to ensure that the capacity of the network performs well on new data with high variations.
We also validated our approach by using ground truth measurements from multiple readers to account for interobserver variability. On 141 scans, the measures from two readers presented a high correlation, but a bias was observed. The variability between both experts was mostly due to the difference in the identification of the inferior and superior limits of the pericardium, especially for the identification of the lowest section showing the posterior descending artery. On these same scans, the model also presented a high correlation with both readers. A significant difference was observed only with volume for the first reader and with density for both readers. This observation suggests the influence of having more annotations from reader 2 than reader 1; reader 1 annotated 303 of the scans used for the development of the method whereas reader 2 annotated 441 scans. Variability in automated volume quantification compared with expert measurements was equivalent to interobserver variability, as shown by the 95% limits of agreement in the Bland-Altman analyses.
In 70 patients, the method showed strong agreement with the reader for the estimation of EAT progression in serial scans, with no significant differences. The automated quantification demonstrated an association between EAT progression and high-risk plaque progression (increase in noncalcified plaque burden), as previously found in the literature (2). This result supports the hypothesis that the proposed approach provides quantifications with a potential prognostic value for risk assessment. Change in EAT density automatically quantified by the method was not different from the corresponding values measured by the reader.
Finally, the model was retrained on the 614 training scans after the 10-fold cross-validation and applied to additional data; results were similar to those from 10-fold cross-validation. The model did not present a significant bias with reader 2 but did with reader 3, whose number of annotations in the training step was small (n = 11), and the 95% limits of agreement were equivalent to those obtained in the interobserver variability analysis. Despite the low number of scans from Seoul that were used to develop the method, the model still provided robust results in the additional 25 scans, as shown by the correlation and agreement.
This study presented some limitations. Although the proposed approach provided robust results in the overall data and performed well in a cohort with a small influence in the training, suggesting the genericity of the method, the interobserver variability evaluation was performed in only one cohort (scans from the EISNER trial). More annotations from different readers in different cohorts are necessary to validate the generalizability of the method. Moreover, the different cohorts presented in this study were unbalanced, and the training and test datasets were heavily from the EISNER trial, which may have led to improved performance in the EISNER datasets. Further, the training model had 614 scans in 540 patients (ie, more than one scan per patient in 74 patients), also leading to improved performance in these similar serial scans. Although we used cross-validation, a leave-one-cohort-out validation method could not be considered with our current data.
As a future perspective for this work, it could be interesting to focus on localized quantification of adipose tissue surrounding the coronary arteries. The combination of the proposed method in this article with cardiac structure segmentation, as proposed previously (15) could provide localized characterization of adipose tissue and potentially increase the predictive power compared with global EAT volume or density, as suggested by recent work with pericoronary adipose tissue (26).
In conclusion, deep learning allows rapid, robust, and fully automated quantification of EAT from non–contrast-enhanced calcium-scoring CT; it performs as well as an expert reader and can be implemented in clinical routine for cardiovascular risk assessment. Fully automated EAT quantification can improve the risk assessment and treatment of asymptomatic patients.
M.M.H., M.M., and S.A. supported by Bundesministerium für Bildung und Forschung (01EX1012B). P.J.S., D.D., F.C., S.C., M.G., X.C,. A.R., and B.K.T. partly supported by the National Institutes of Health and the National Heart, Lung, and Blood Institute (R01HL133616). J.K. and S.C. partly supported by Dr. Miriam and Sheldon G. Adelson Medical Research Foundation (Private foundation grant).
Disclosures of Conflicts of Interest: F.C. disclosed no relevant relationships. M.G. disclosed no relevant relationships. A.R. disclosed no relevant relationships. S.C. Activities related to the present article: disclosed no relevant relationships. Activities not related to the present article: royalties from Cedars-Sinai Medical Center for the autoplaque software. Other relationships: disclosed no relevant relationships. M.M.H. disclosed no relevant relationships. J.K. disclosed no relevant relationships. X.C. disclosed no relevant relationships. H.J.C. disclosed no relevant relationships. M.M. Activities related to the present article: disclosed no relevant relationships. Activities not related to the present article: payment for lectures from Edwards Lifescience and Siemens Healthineers. Other relationships: disclosed no relevant relationships. S.A. disclosed no relevant relationships. D.S.B. Activities related to the present article: disclosed no relevant relationships. Activities not related to the present article: grants/grants pending from HeartFlow and software royalties from Cedars-Sinai Medical Center. Other relationships: disclosed no relevant relationships. P.J.S. Activities related to the present article: disclosed no relevant relationships. Activities not related to the present article: research grant from Siemens Healthineers, patent for CT angiography plaque analysis method, and royalties from Cedars-Sinai Medical Center for nuclear cardiology software. Other relationships: disclosed no relevant relationships. B.K.T. disclosed no relevant relationships. D.D. Activities related to the present article: disclosed no relevant relationships. Activities not related to the present article: patent and software licensing royalties from Cedars-Sinai Medical Center. Other relationships: disclosed no relevant relationships.
Abbreviations:
- CAC
- coronary artery calcium
- CNN
- convolutional neural network
- EAT
- epicardial adipose tissue
- EISNER
- Early Identification of Subclinical Atherosclerosis by Noninvasive Imaging Research
- IQR
- interquartile range
- LDL
- low-density lipoprotein
References
- 1.Sacks HS, Fain JN. Human epicardial adipose tissue: a review. Am Heart J 2007;153(6):907–917. [DOI] [PubMed] [Google Scholar]
- 2.Hwang IC, Park HE, Choi SY. Epicardial adipose tissue contributes to the development of non-calcified coronary plaque: a 5-year computed tomography follow-up study. J Atheroscler Thromb 2017;24(3):262–274. [DOI] [PMC free article] [PubMed] [Google Scholar]
- 3.Tamarappoo B, Dey D, Shmilovich H, et al. Increased pericardial fat volume measured from noncontrast CT predicts myocardial ischemia by SPECT. JACC Cardiovasc Imaging 2010;3(11):1104–1112. [DOI] [PMC free article] [PubMed] [Google Scholar]
- 4.Mazurek T, Zhang L, Zalewski A, et al. Human epicardial adipose tissue is a source of inflammatory mediators. Circulation 2003;108(20):2460–2466. [DOI] [PubMed] [Google Scholar]
- 5.Mahabadi AA, Lehmann N, Kälsch H, et al. Association of epicardial adipose tissue and left atrial size on non-contrast CT with atrial fibrillation: the Heinz Nixdorf Recall Study. Eur Heart J Cardiovasc Imaging 2014;15(8):863–869. [DOI] [PubMed] [Google Scholar]
- 6.Goeller M, Achenbach S, Marwan M, et al. Epicardial adipose tissue density and volume are related to subclinical atherosclerosis, inflammation and major adverse cardiac events in asymptomatic subjects. J Cardiovasc Comput Tomogr 2018;12(1):67–73. [DOI] [PMC free article] [PubMed] [Google Scholar]
- 7.Abazid RM, Smettei OA, Kattea MO, et al. Relation between epicardial fat and subclinical atherosclerosis in asymptomatic individuals. J Thorac Imaging 2017;32(6):378–382. [DOI] [PubMed] [Google Scholar]
- 8.Cheng VY, Dey D, Tamarappoo B, et al. Pericardial fat burden on ECG-gated noncontrast CT in asymptomatic patients who subsequently experience adverse cardiovascular events. JACC Cardiovasc Imaging 2010;3(4):352–360. [DOI] [PMC free article] [PubMed] [Google Scholar]
- 9.Nakazato R, Shmilovich H, Tamarappoo BK, et al. Interscan reproducibility of computer-aided epicardial and thoracic fat measurement from noncontrast cardiac CT. J Cardiovasc Comput Tomogr 2011;5(3):172–179. [DOI] [PMC free article] [PubMed] [Google Scholar]
- 10.Barbosa JG, Figueiredo B, Bettencourt N, Tavares JMR. Towards automatic quantification of the epicardial fat in non-contrasted CT images. Comput Methods Biomech Biomed Engin 2011;14(10):905–914. [DOI] [PubMed] [Google Scholar]
- 11.Ding X, Terzopoulos D, Diaz-Zamudio M, Berman DS, Slomka PJ, Dey D. Automated pericardium delineation and epicardial fat volume quantification from noncontrast CT. Med Phys 2015;42(9):5015–5026. [DOI] [PubMed] [Google Scholar]
- 12.Norlén A, Alvén J, Molnar D, et al. Automatic pericardium segmentation and quantification of epicardial fat from computed tomography angiography. J Med Imaging (Bellingham) 2016;3(3):034003. [DOI] [PMC free article] [PubMed] [Google Scholar]
- 13.Shahzad R, Bos D, Metz C, et al. Automatic quantification of epicardial fat volume on non-enhanced cardiac CT scans using a multi-atlas segmentation approach. Med Phys 2013;40(9):091910. [DOI] [PubMed] [Google Scholar]
- 14.Dey D, Wong ND, Tamarappoo B, et al. Computer-aided non-contrast CT-based quantification of pericardial and thoracic fat and their associations with coronary calcium and Metabolic Syndrome. Atherosclerosis 2010;209(1):136–141. [DOI] [PMC free article] [PubMed] [Google Scholar]
- 15.Mortazi A, Burt J, Bagci U. Multi-planar deep segmentation networks for cardiac substructures from MRI and CT. International Workshop on Statistical Atlases and Computational Models of the Heart. Cham, Switzerland: Springer, 2017; 199–206. [Google Scholar]
- 16.Commandeur F, Goeller M, Betancur J, et al. Deep learning for quantification of epicardial and thoracic adipose tissue from non-contrast CT. IEEE Trans Med Imaging 2018;37(8):1835–1846. [DOI] [PMC free article] [PubMed] [Google Scholar]
- 17.Rozanski A, Gransar H, Shaw LJ, et al. Impact of coronary artery calcium scanning on coronary risk factors and downstream testing the EISNER (Early Identification of Subclinical Atherosclerosis by Noninvasive Imaging Research) prospective randomized trial. J Am Coll Cardiol 2011;57(15):1622–1632. [DOI] [PMC free article] [PubMed] [Google Scholar]
- 18.Tamarappoo B, Otaki Y, Doris M, et al. Improvement in LDL is associated with decrease in non-calcified plaque volume on coronary CTA as measured by automated quantitative software. J Cardiovasc Comput Tomogr 2018;12(5):385–390. [DOI] [PubMed] [Google Scholar]
- 19.He K, Zhang X, Ren S, Sun J. Deep residual learning for image recognition. Proceedings of the IEEE Conference on Computer Vision and Pattern Recognition. Las Vegas, Nevada; June 27–June 30, 2016; 770–778. [Google Scholar]
- 20.Kingma DP, Ba J. Adam: A method for stochastic optimization. ArXiv 14126980 [preprint]. https://arxiv.org/abs/1412.6980. Posted December 22, 2014. Accessed November 19, 2019. [Google Scholar]
- 21.Dice LR. Measures of the amount of ecologic association between species. Ecology 1945;26(3):297–302. [Google Scholar]
- 22.Glorot X, Bengio Y. Understanding the difficulty of training deep feedforward neural networks. Proceedings of the Thirteenth International Conference on Artificial Intelligence and Statistics, Sardinia, Italy; May 13–15, 2010; 249–256. [Google Scholar]
- 23.Nakagawa S, Johnson PCD, Schielzeth H. The coefficient of determination R2 and intra-class correlation coefficient from generalized linear mixed-effects models revisited and expanded. J R Soc Interface 2017;14(134):20170213. [DOI] [PMC free article] [PubMed] [Google Scholar]
- 24.Jones E, Oliphant T, Peterson P. SciPy: open source scientific tools for Python. http://www.scipy.org/. Published 2014. Accessed November 19, 2019.
- 25.Rajani R, Shmilovich H, Nakazato R, et al. Relationship of epicardial fat volume to coronary plaque, severe coronary stenosis, and high-risk coronary plaque features assessed by coronary CT angiography. J Cardiovasc Comput Tomogr 2013;7(2):125–132. [DOI] [PMC free article] [PubMed] [Google Scholar]
- 26.Goeller M, Tamarappoo BK, Kwan AC, et al. Relationship between changes in pericoronary adipose tissue attenuation and coronary plaque burden quantified from coronary computed tomography angiography. Eur Heart J Cardiovasc Imaging 2019;20(6):636–643. [DOI] [PMC free article] [PubMed] [Google Scholar]


