Abstract
Purpose:
Previous approaches using deep learning algorithms to classify glaucomatous damage on fundus photographs have been limited by the requirement for human labeling of a reference training set. We propose a new approach using quantitative spectral-domain optical coherence tomography (SDOCT) data to train a deep learning algorithm to quantify glaucomatous structural damage on optic disc photographs.
Design:
Cross-sectional study
Participants:
32,820 pairs of optic disc photos and SDOCT retinal nerve fiber layer (RNFL) scans from 2,312 eyes of 1,198 subjects.
Methods:
The sample was randomly divided into validation plus training (80%) and test (20%) sets, with randomization performed at the patient level. A deep learning convolutional neural network was trained to assess optic disc photographs and predict SDOCT average RNFL thickness.
Main Outcome Measures:
The performance of the deep learning algorithm was evaluated in the test sample by evaluating correlation and agreement between the predictions and actual SDOCT measurements. We also assessed the ability to discriminate eyes with glaucomatous visual field loss from healthy eyes with the area under the receiver operating characteristic curve (ROC).
Results:
The mean prediction of average RNFL thickness from all 6,292 optic disc photos in the test set was 83.3 ± 14.5 μm, whereas the mean average RNFL thickness from all corresponding SDOCT scans was 82.5 ± 16.8 μm (P = 0.164). There was a very strong correlation between predicted and observed RNFL thickness values (Pearson’s r = 0.832; R2 = 69.3%; P<0.001), with mean absolute error (MAE) of the predictions of 7.39 μm. The areas under the ROC curves for discriminating glaucomatous from healthy eyes with the deep learning predictions and actual SDOCT average RNFL thickness measurements were 0.944 (95% CI: 0.912– 0.966) and 0.940 (95% CI: 0.902 – 0.966), respectively (P = 0.724).
Conclusion:
We introduced a novel deep learning approach to assess fundus photographs and provide quantitative information about the amount of neural damage that can be used to diagnose and stage glaucoma. In addition, training neural networks to objectively predict SDOCT data represents a new approach that overcomes limitations of human labeling and could be useful in other areas of ophthalmology.
PRÉCIS
A deep learning neural network was trained to quantitatively assess optic disc photographs and predict the amount of neural damage from glaucoma. The predictions closely replicated measurements acquired with optical coherence tomography.
Glaucoma is a progressive optic neuropathy that results in characteristic changes to the optic disc and retinal nerve fiber layer.1 Although damage from glaucoma is irreversible, early treatment can usually prevent or slow down progression to functional damage and visual impairment.2 Assessment of structural damage is essential for early detection of glaucoma. Fundus photographs are a low-cost and easy to perform method to document and identify optic disc features characteristic of glaucoma. However, it is well-established that subjective evaluation of optic disc photographs suffers from low reproducibility, even when performed by expert graders.3–5 In addition, graders frequently under- or over-estimate glaucoma likelihood when evaluating disc photographs.6 Recent progress in artificial intelligence and machine learning has led to the development of algorithms capable of objective assessment of fundus photographs for identification of signs of ocular diseases.7–11 Li et al7 evaluated the ability of a deep learning neural network algorithm to identify signs of glaucomatous neuropathy on color fundus photographs. The authors reported excellent sensitivity and specify to diagnose “referable” glaucomatous optic neuropathy, which was defined based on subjective grading of the photographs by a group of trained ophthalmologists.
A fundamental step in the development of any machine learning algorithm is the training process by which the algorithm “learns” to correctly make classifications and predictions. Essentially, the algorithm cannot perform better than the reference standard used to train it, and its best hope is to perfectly replicate the classifications or predictions that would have been made by the reference standard. Although the work by Li et al7 provides important insights into how machine learning could be used to assess glaucomatous damage on fundus photographs, their algorithm suffers from the limitation that subjective gradings were used as the reference standard to train the deep learning network.
In recent decades, spectral-domain optical coherence tomography (SDOCT) has become the de facto standard in objective quantification of structural damage in glaucoma.12 Measurements of the retinal nerve fiber layer (RNFL) thickness with SDOCT demonstrate high reproducibility and have been shown to accurately diagnose the disease, detect its progression, and measure rates of change.12–15 As such, it is conceivable that an accurate machine learning classifier could be obtained if it is trained to evaluate fundus photographs using SDOCT measurements as the reference standard, rather than subjective assessment by graders. Automated SDOCT measurements are easier to obtain and thus may make training of classifiers on large datasets more feasible. Such an algorithm could also be trained to obtain quantitative rather than just qualitative assessments of the amount of neural damage from disc photographs.
In the present work, we report on a novel deep learning algorithm trained to assess optic disc photographs from results of SDOCT and investigate its ability to provide objective quantification of glaucomatous neural loss.
METHODS
The dataset for this study was collected from the Duke Glaucoma Repository, a database of electronic medical and research records at the Vision, Imaging and Performance (VIP) Laboratory from the Duke Eye Center. The Institutional Review Board from Duke University approved this study, and a waiver of informed consent was provided due to the retrospective nature of this work. All methods adhered to the tenets of the Declaration of Helsinki for research involving human subjects and the study was conducted in accordance with regulations of the Health Insurance Portability and Accountability Act.
The database contained information on comprehensive ophthalmologic examinations during follow-up, diagnoses, medical history, visual acuity, slit-lamp biomicroscopy, intraocular pressure measurements, results of gonioscopy and dilated slit-lamp funduscopic examinations. In addition, the repository contained stereoscopic optic disc photographs (Nidek 3DX, Nidek, Japan), standard automated perimetry (SAP; Humphrey Field Analyzer II, Carl Zeiss Meditec, Inc., Dublin, CA) and Spectralis SDOCT (Software version 5.4.7.0, Heidelberg Engineering, GmbH, Dossenheim, Germany) images and data. SAP was acquired with the 24–2 Swedish interactive threshold algorithm (Carl Zeiss Meditec, Inc., Dublin, CA). Only subjects with open angles on gonioscopy were included. Visual fields were excluded if they had more than 33% fixation losses or more than 15% false-positive errors. Patients were excluded if they had a history of other ocular or systemic diseases that could affect the optic nerve or the visual field.
Diagnosis of glaucoma was defined based on the presence of glaucomatous repeatable visual field loss in SAP (pattern standard deviation [PSD] < 5% or glaucoma hemifield test outside normal limits) and signs of glaucomatous optic neuropathy as based on records of slit-lamp fundus examination. Glaucoma suspects were those with history of elevated intraocular pressure, suspicious appearance of the optic disc on slit-lamp fundus examination, or with other risk factors for the disease. Healthy subjects were required to have a normal optic disc appearance on slit-lamp fundus examination in both eyes as well as no history of elevated intraocular pressure and normal SAP results.
Images were acquired with the Spectralis SDOCT to assess the RNFL. The device uses a dual-beam SDOCT and a confocal laser-scanning ophthalmoscope that employs a super luminescent diode light with a center wavelength of 870 nm and an infrared scan to provide simultaneous images of ocular microstructures. The Spectralis RNFL circle scan was used for this study. A total of 1535 A-scan points were acquired from a 3.45-mm circle centered on the optic disc. Axial length and corneal curvature measurements were entered into the instrument software to ensure accurate scaling of all measurements, and the device’s eye-tracking capability was used during image acquisition to adjust for eye movements and to ensure that the same location of the retina was scanned over time. Images were manually reviewed to ensure quality, scan centration and no coexistent retinal pathologic abnormalities. Images that had been inverted or clipped, or with signal strength below 15 dB were excluded. The average circumpapillary RNFL thickness corresponds to the 360° measure automatically calculated by the SD-OCT software.
For each eye of each subject, we considered all the available optic disc photographs that had been acquired over time and matched them to the closest Spectralis SDOCT RNFL scan acquired within 6 months from the photo date. As subjects were followed over time, multiple pairs of SDOCT and disc photos were available for each subject. This was important in order to increase the heterogeneity of the dataset for deep learning training.
Development of the Deep Learning Algorithm
A deep learning algorithm was trained to predict SDOCT average RNFL thickness from assessment of optic disc photographs. The target value, i.e., the variable we wanted to predict from analysis of optic disc photographs was the SDOCT average RNFL thickness. Therefore, for training the neural network, a pair of train-target consisted of the optic disc photograph and the SDOCT average RNFL thickness value. The sample of pairs of photos-OCT was split into a training plus validation set (80%) and test sample (20%). Importantly, in order to prevent leakage and biased estimates of test performance, the random sampling process was at the patient level, so no data of any patient was present in both the training and the test samples.
The optic disc stereophotographs were initially preprocessed to derive data for the deep learning algorithm. Each stereoscopic photograph was split creating a pair of photos from the stereo views. The images were then downsampled to 256 × 256 pixels and pixel values were scaled to range from 0 to 1. Data augmentation was performed to increase heterogeneity of the photographs, reducing the possibility of overfitting and allowing the algorithm to learn the most relevant features. Data augmentation included the following: random lighting, consisting of subtle changes in image brightness and contrast of up to 5%; random rotation, consisting of rotations of up to 10 degrees in the image; and random flips, consisting of flipping the image vertically or horizontally.
We used the Residual deep neural Network (ResNet34) architecture. The ResNet is a revolutionary deep residual network that has allowed relatively rapid training of very deep convolutional neural networks in a way that had not been previously possible.16 In brief, these networks use identity shortcut connections that skip one or more layers and greatly decrease the vanishing gradient problem when training deep networks. In the present work, a ResNet that had been previously trained on the ImageNet dataset17 was used. However, as the recognition task of the present work largely differs from that of ImageNet, further training was performed by initially unfreezing the last 2 layers. Subsequently, all layers were unfrozen, and training was performed using differential learning rates, where different learning rates are used for different parts of the network with a lower rate for the earlier layers and gradually increasing it for the later layers. The network was trained with minibatches of size 64 and Adam optimizer.18,19 The best learning rate was found using the cyclical learning method with stochastic gradient descent with restarts.20
As a variant of the training process described above, we also trained the deep learning network to classify optic disc photographs in normal versus abnormal according to the SDOCT average RNFL thickness categorical classification as provided by the instrument’s normative database. This was done in order to allow investigation of how deep learning assessment of photographs would perform in classifying and categorizing the presence of damage. The SDOCT instrument classifies the average RNFL thickness in one of three possible categories by comparing the measurement to values from the instrument’s normative database. These three categories are normal, borderline, and abnormal. In our analysis, we collapsed the borderline and normal categories into the “normal” one so that we had a binary target variable (normal versus abnormal) which retained high specificity. The deep learning model then calculated the probability of abnormality based on assessment of optic disc photos. We built heatmaps corresponding to the Gradient-weighted class activation maps over the input images.21,22 These heatmaps indicate how important each location of the image is with respect to the class under consideration. This technique allows one to visualize the parts of the image that are most important in the deep neural network classification.
Statistical Analyses
The performance of the deep learning algorithm in quantifying glaucomatous damage in optic disc photographs was evaluated in the test sample by comparing the predictions with the actual SDOCT average RNFL thickness. Generalized estimating equations (GEE) were used to account for the fact that multiple measures were obtained per patient.23 We calculated the mean absolute error (MAE) of the predictions as well as Pearson’s correlation coefficient and agreement by the Bland-Altman plot and 95% confidence limits of agreement. We also investigated the correspondence between classifications performed by the deep learning system and those given by the SDOCT normative database.
We also investigated the relationship between predicted and observed values of RNFL thickness and SAP mean deviation (MD) with locally weighted scatterplot smoothing (LOWESS).24 The closest visual field to the SDOCT was used to assess the structure-function relationship. Receiver operating characteristic curves were used to assess and compare the ability of the deep learning algorithm on photographs versus SDOCT average RNFL thickness in discriminating eyes with glaucoma from healthy eyes, as defined above for inclusion in the study. The ROC curve provides the tradeoff between the sensitivity and 1 − specificity. The area under the ROC curve (AUC) was used to summarize the diagnostic accuracy of each parameter. An AUC of 1.0 represents perfect discrimination, whereas an area of 0.5 represents chance discrimination. Sensitivity at fixed specificities of 80% and 95% were also reported. To account for using multiple images of both eyes of the same participant in the analyses, a bootstrap resampling procedure was used to derive confidence intervals and P-values, where the cluster of data for the participant was considered as the unit of resampling to adjust standard errors. This procedure has been previously used to adjust for the presence of multiple correlated measurements from the same unit.25
RESULTS
The dataset included 32,820 pairs of optic disc photos and SDOCT scans from 2,312 eyes of 1,198 subjects. The test sample consisted of 6,292 pairs of disc photos and SDOCTs from 463 eyes of 240 subjects. Table 1 shows demographic and clinical characteristics of the subjects and eyes in the training and test samples.
Table 1.
Demographic and clinical characteristics of the eyes and subjects included in the training and test samples.
| Training sample (26,528 pairs of disc photos and SDOCT scans from 1,849 eyes of 958 subjects) | |||
|---|---|---|---|
| Normal | Suspect | Glaucoma | |
| Number of eyes | 476 | 674 | 699 |
| Number of images | 3,982 | 13,410 | 9,136 |
| Age (years) | 57.8 ± 13.9 | 65.4 ± 11.1 | 69.7 ± 11.2 |
| Female gender (%) | 64.7 | 60.5 | 53.1 |
| Race(%) | |||
| African-American | 43.3 | 38.2 | 39.8 |
| SAP MD (dB) | 0.05 ± 1.10 | −0.62 ±1.91 | −7.37 ± 6.95 |
| SAP PSD (dB) | 1.60 ± 0.40 | 1.94 ± 1.10 | 6.40 ± 3.94 |
| SDOCT Average RNFL Thickness (μm) | 96.8 ± 10.9 | 89.1 ±12.8 | 68.3 ±14.8 |
| Test sample (6,292 pairs of disc photos and SDOCT scans from 463 eyes of 240 subjects) | |||
| Number of eyes | 128 | 164 | 171 |
| Number of images | 877 | 3,345 | 2,070 |
| Age (years) | 56.5 ± 15.9 | 65.5 ± 11.3 | 68.1 ± 12.8 |
| Female gender (%) | 59.1 | 64.5 | 45.2 |
| Race(%) | |||
| African-American | 48.2 | 34.2 | 42.0 |
| SAP MD (dB) | −0.06 ± 1.10 | −0.62 ± 2.36 | −7.65 ± 6.9 |
| SAP PSD (dB) | 1.61 ± 0.35 | 2.00 ± 1.19 | 6.63 ± 3.99 |
| SDOCT Average RNFL Thickness (μm) | 97.6 ± 9.3 | 87.1 ± 12.5 | 68.8 ± 16.0 |
SAP = Standard Automated Perimetry; MD = Mean Deviation; PSD = Pattern Standard Deviation; dB = decibel; SDOCT = Spectral-Domain Optical Coherence Tomography; RNFL = Retinal Nerve Fiber Layer
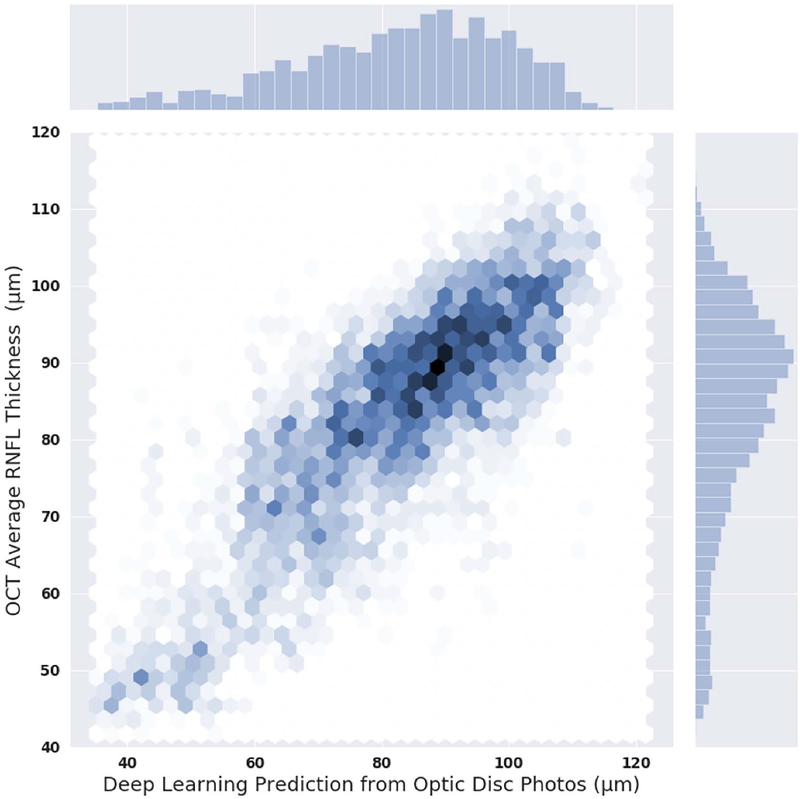
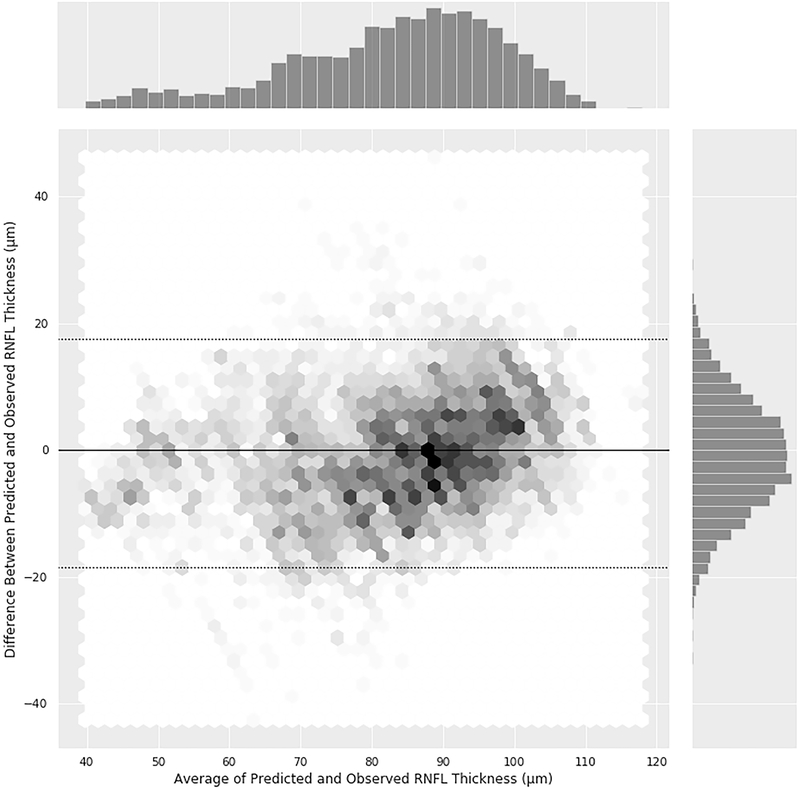
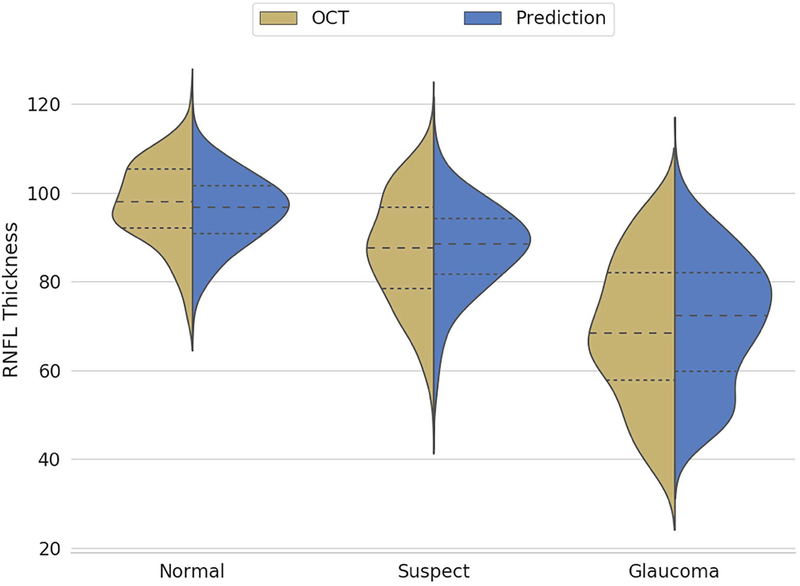
Figure 1 shows the relationship between deep learning predictions of average RNFL thickness from optic disc photographs and the actual SDOCT measurements in the test sample. The mean prediction of average RNFL thickness from all 6,292 optic disc photos was 83.3 ± 14.5 μm, whereas the mean average RNFL thickness from all the 6,292 corresponding SDOCT scans was 82.5 ± 16.8 μm (P = 0.164; GEE). There was a very strong correlation between the predicted and the observed RNFL thickness values (Pearson’s r = 0.832; R2 = 69.3%; P<0.001), with MAE of 7.39 μm. Figure 2 (available at www.aaojournal.org) shows the Bland-Altman plot assessing the agreement between predictions and observations. The 95% confidence limits of agreement ranged from −18.5 μm to 17.5 μm, with no statistically significant evidence of proportional bias (P = 0.074). Figure 3 shows violin plots illustrating the distribution of predicted and observed RNFL thickness values in normal, suspect, and glaucomatous eyes in the test sample. Average predictions were 96.1 ± 7.8 μm, 87.5 ± 9.9 μm and 71.0 ± 14.4 μm in normal, suspect and glaucomatous eyes, respectively. There was a statistically significant difference between average predictions for all pairwise comparisons between the 3 groups (P<0.001, GEE). Corresponding numbers for SDOCT mean average RNFL thickness in the three groups were 97.6 ± 9.3 μm, 87.1 ± 12.5 μm and 68.8 ± 16.0 μm (P<0.001 for all pairwise comparisons, GEE).
Figure 1.
Scatterplot and histograms illustrating the relationship between predictions obtained by the deep learning algorithm evaluating optic disc photographs and actual average retinal nerve fiber layer thickness measurements from spectral-domain optical coherence tomography (OCT). Data is from the independent test set.
Figure 2 (online only).
Bland-Altman plot illustrating the agreement between deep learning predicted and observed average retinal nerve fiber layer thickness measurement. The plot shows the relationship between the difference (observed – predicted) versus mean of observed and predicted.
Figure 3.
Violin plots illustrating the distribution of deep learning predictions and optical coherence tomography average retinal nerve fiber layer thickness in normal, suspect and glaucomatous eyes.
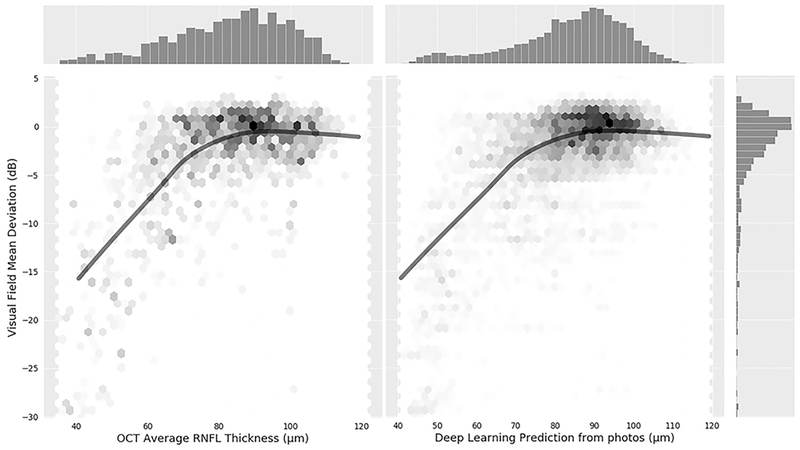
Figure 4 (available at www.aaojournal.org) illustrates the relationship between SAP MD versus observed and predicted RNFL thickness values. The ROC curve area for discriminating glaucomatous from normal eyes with the deep learning optic disc photo predictions was 0.944 (95% CI: 0.912– 0.966), whereas the ROC curve area for actual SDOCT average RNFL thickness was 0.940 (95% CI: 0.902 – 0.966). There was no statistically significant difference between the ROC curve areas (P = 0.724). For specificity at 95%, the predicted measurements had sensitivity of 76% (95% CI: 64% – 84%), whereas actual SDOCT measurements had sensitivity of 73% (95% CI: 59% −85%). For specificity at 80%, the predicted measurements had sensitivity of 90% (95% CI: 82% – 95%), whereas actual SDOCT measurements had sensitivity of 90% (95% CI: 83% - 95%).
Figure 4 (online only).
Scatterplots with fitted locally weighted scatterplot smoothing (LOWESS) curves illustrating the relationship between visual field mean deviation and average retinal nerve fiber layer thickness from deep learning optic disc photographs predictions (right) and actual optical coherence tomography (left).
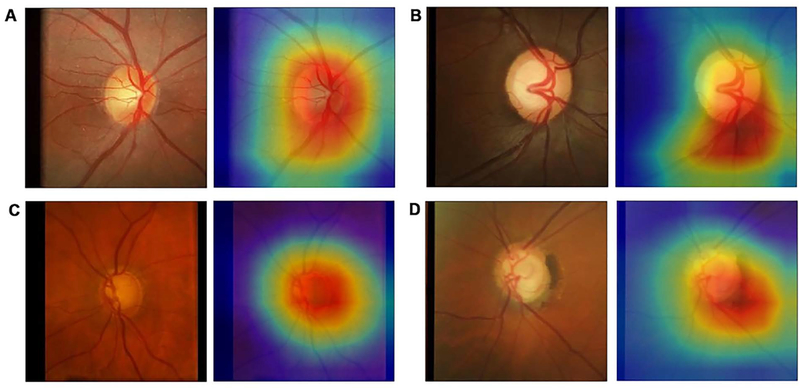
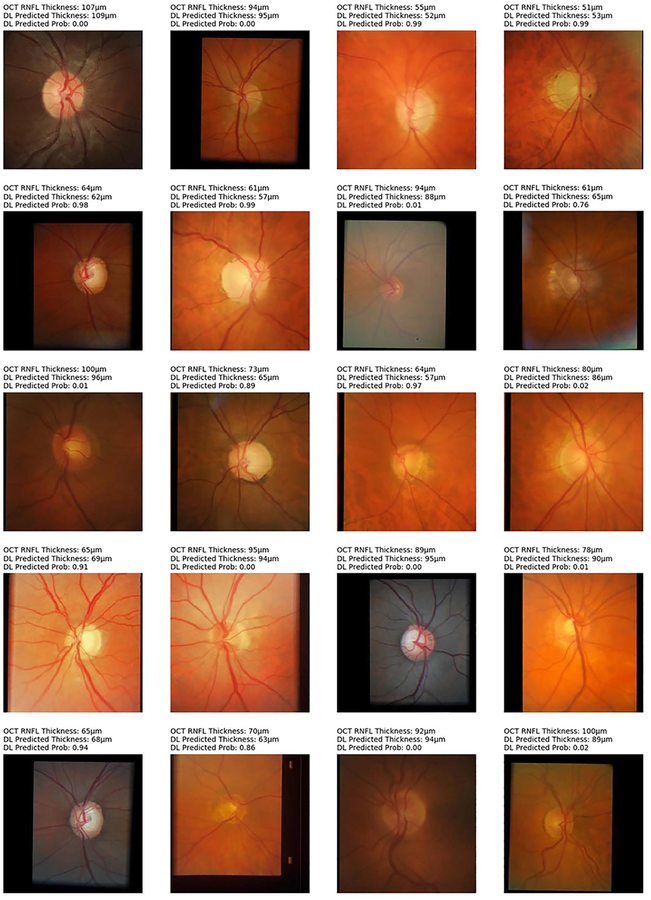
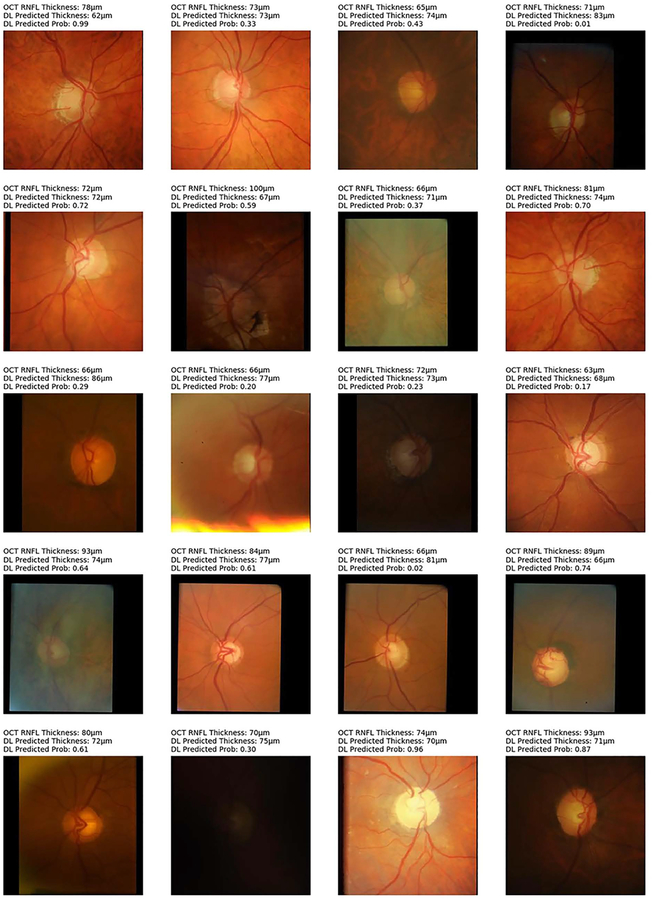
From the 6,292 OCT scans in the test set, 1,908 (30.3%) were classified as abnormal and 4,384 (69.7%) as normal, according to the instrument’s normative database. The deep learning network trained on photographs achieved an overall accuracy of 83.7% to replicate such classification. Figure 5 shows examples of optic disc photos and corresponding class activation maps (heatmaps) of the deep learning network. The heatmaps show that the activations were most strongly found in the area of the optic nerve and adjacent retinal nerve fiber layer on the photographs, indicating that these areas were the most important for the network classifications. Figures 6 and 7 show several random examples of optic disc photos from the test sample where the deep learning algorithm correctly and incorrectly predicted the classification given by the SDOCT average RNFL thickness, respectively.
Figure 5.
Class activation maps (heatmaps) showing the regions of the photograph that had greatest weight in the deep learning algorithm classification. A was from a normal eye, B from a glaucoma suspect, and C and D are from glaucomatous eyes.
Figure 6.
Random examples of optic disc photographs that were correctly classified according to the reference classification of the Spectralis spectral domain-optical coherence tomography (OCT) normative database for average retinal nerve fiber layer thickness (RNFL). Above each photo is shown the OCT average thickness measurement, the deep learning (DL) prediction of average RNFL thickness from the optic disc photograph, and the probability of abnormality estimated by the DL algorithm.
Figure 7.
Random examples of optic disc photographs that were incorrectly classified according to the reference classification of the Spectralis spectral-domain optical coherence tomography (OCT) normative database for average retinal nerve fiber layer thickness. Above each photo is shown the OCT average thickness measurement, the deep learning (DL) prediction of average RNFL thickness from the optic disc photograph, and the probability of abnormality estimated by the DL algorithm.
DISCUSSION
In the present study, we developed and validated a novel deep learning algorithm to assess optic disc photographs for the presence of glaucomatous damage. In contrast to previous works in this area, our algorithm was capable of outputting continuous predictions of estimated RNFL thickness, therefore allowing for quantitative assessment of the amount of neural damage on disc photos. This was achieved by training the network with RNFL thickness measurements extracted from SDOCT. To the best of our knowledge, such an approach has not been previously described in the literature.
Previous investigators have described machine learning approaches to assess optic disc photographs for glaucomatous damage.7,9 In these investigations, human graders were asked to label the photos for the presence of glaucomatous damage and this labeling was used as the reference standard to train the classifier. Such an approach presents several limitations. Gradings of optic disc photos by human graders are subjective and known to have relatively poor reproducibility.3–5 Furthermore, misclassifications are very likely to occur. For example, graders tend to frequently misclassify eyes with physiologic large cups as having glaucoma and they often miss signs of glaucomatous damage in eyes with small optic discs. If a machine learning classifier is trained using human labeling of optic disc photos, it will essentially replicate those errors and is likely to have poor performance as a screening tool, even if it shows high accuracy when compared to the human gradings. Our study proposes a novel approach in training the classifier by using RNFL thickness measurements extracted from SDOCT. This presents some obvious advantages. First, it provides an objective and reproducible metric to serve as a target. Average RNFL thickness measurements have been shown to accurately detect glaucomatous damage and can, for example, discriminate eyes with large physiologic cups from those with actual glaucomatous damage.26–28 In addition, training a network with objective SDOCT data obviates the need for the time-consuming task of subjective labeling by human graders.
The predictions obtained from deep learning analysis of optic disc photographs showed very strong correlation with the actual RNFL thickness measurements in the independent test sample. Furthermore, the MAE of the predictions was only about 7μm. Interestingly, a previous study29 reported an R2 of 70% for the correlation between two different SD-OCT devices, and another study reported Bland-Altman limits of agreement that are not far from those reported in our investigation.30 As a result, it was not surprising that the predictions performed well to discriminate eyes with glaucomatous visual field loss from healthy eyes. In fact, the ROC curve area for the predictions was almost identical to that for actual SDOCT RNFL thickness values. This provides important validation of our deep learning model. As described before, previous models have essentially attempted to replicate human grading of photographs but have provided no evidence that the algorithm classifications or predictions actually corresponded to clinically relevant outcomes. By showing a correspondence to visual field loss in a similar degree to SDOCT, our work provides essential validation of the quantitative deep learning approach to assess disc photographs.
Although SDOCT has become the reference standard for quantification of structural damage in glaucoma, assessment of optic disc photographs may present several advantages. SDOCTs are still generally expensive and non-portable machines, which can be difficult to implement in screening settings, especially in underserved populations. In contrast, photographs may provide a quick and inexpensive method for documenting the optic disc appearance. Recent work has demonstrated the feasibility of acquiring fundus photographs with portable devices and cell phones.31–33 Although using SDOCT may still be relatively unfeasible in most screening settings, our approach demonstrates that a deep learning algorithm can closely replicate general SDOCT average RNFL thickness measurements from optic disc photos and could be potentially implemented in low-cost screening settings using fundus photographs. Further investigations should evaluate the feasibility and accuracy of such approaches.
Another important advantage of the quantitative approach for assessing optic disc photos presented in this work is the potential for assessing changes over time in settings where SDOCT is not available. A qualitative yes/no assessment of disc photos as performed previously does not generally allow assessment of changes over time, notably in those already classified as glaucomatous at baseline. By providing a continuous output, our approach could potentially be used to extract progression information from optic disc photographs that could be used for monitoring glaucomatous damage. However, validation of such an approach will require longitudinal investigations.
The activation heatmaps showed that the locations in the optic disc photos that were most important for the deep learning algorithm corresponded very closely to the optic disc and adjacent RNFL, as seen in Figure 5. Retinal blood vessels or areas further from the optic disc had much smaller activations. This provides further confirmation that the algorithm is indeed identifying the area of the photo that is important for diagnosing glaucoma. The approach presented here may allow future investigations of features of optic discs that present the greatest challenges for recognition of signs of the disease, increasing awareness for their significance and opening opportunities for better training of clinicians on how to recognize them in clinical practice.
A large proportion of our patient population was African American. Population-based studies have demonstrated that African Americans have an increased prevalence of primary open angle glaucoma compared to Caucasians.34–36 Moreover, they may progress at a faster rate and experience a greater degree of functional impairment from glaucoma at a younger age.36–38 Therefore, improved screening and testing methods are needed to target this potentially high-risk group. Our algorithm may be particularly useful in this regard and could find use in teleophthalmology programs targeting individuals at greatest risk for visual impairment. Further studies should investigate this approach and should also incorporate images acquired from patients of other races and ethnicities to improve the generalizability of the algorithm.
Our study has limitations. It should be noted that although the deep learning algorithm presented in this study performed well in identifying glaucomatous damage, approximately 30% of the variance of SDOCT measurements remained unexplained. Many factors can explain this, such as variability of optic disc appearances and SDOCT measurements, as well as differences in photo quality. In fact, it would be surprising to find higher correlations between photo predictions and SDOCT, considering that SDOCT obtains precise measurements of tissue thickness at a micrometer scale. We have also not performed a qualitative assessment of the optic disc photographs for quality. It is possible that removing poor quality photographs would result in even better performance of the algorithm. In fact, Figure 7 shows some random cases that were misclassified by the deep learning algorithm and it is possible to see that some of them had relatively low quality photographs. However, retention of disc photos of lower quality could improve the generalizability of our model in its application to clinical and teleophthalmology settings. Furthermore, the algorithm was trained to replicate average thickness measurements from SDOCT rather than segmental SDOCT loss. It is likely that more sophisticated approaches could be created by having different SDOCT measurements as target values, including sectoral measurements from other areas of the optic disc or macula. In fact, in one of the examples shown in Figure 7 (second row, first photo from the left), the deep learning algorithm classification (abnormal, with P=0.72) disagreed with the SDOCT average RNFL classification (normal), but subjective analysis of the disc photo actually shows inferior localized rim thinning. Further training of the deep learning network with bigger datasets is likely to improve its performance even further.
In conclusion, we introduced a novel deep learning approach to assess optic disc photographs and provide quantitative information about the amount of neural damage. By analyzing disc photos, the deep learning algorithm was trained to closely replicate measurements obtained from average SDOCT RNFL thickness. The approach presented in this work could potentially be used to diagnose and stage glaucomatous damage from optic disc photographs. In addition, it is possible that the innovative approach first proposed in this study of using OCT to train deep learning models may find use in other areas of ophthalmology.
Supplementary Material
Financial Support:
Supported in part by National Institutes of Health/National Eye Institute grant EY027651 (FAM), EY025056 (FAM), EY021818 (FAM), Conselho Nacional de Desenvolvimento Científico e Tecnológico (AAJ) and the Heed Foundation (ACT). The funding organizations had no role in the design or conduct of this research.
Abbreviations:
- DL
Deep Learning
- GEE
Generalized Estimating Equations
- MD
Mean Deviation
- PSD
Pattern Standard Deviation
- ResNet
Residual deep neural Network
- ROC
Receiver Operating Characteristic
- MAE
Mean Absolute Error
- RNFL
Retinal Nerve Fiber Layer
- SAP
Standard Automated Perimetry
- SDOCT
Spectral-Domain Optical Coherence Tomography
Footnotes
This article contains additional online-only material. The following should appear online-only: Figures 2 and 4.
Conflict of Interest:
FAM.: Alcon Laboratories (C, F, R), Allergan (C, F), Bausch&Lomb (F), Carl Zeiss Meditec (C, F, R), Heidelberg Engineering (F), Merck (F), nGoggle Inc. (F), Sensimed (C), Topcon (C), Reichert (C, R). AAJ.: none. ACT.: none.
REFERENCES
- 1.Weinreb RN, Aung T, Medeiros FA. The pathophysiology and treatment of glaucoma: a review. JAMA. 2014;311(18):1901–1911. [DOI] [PMC free article] [PubMed] [Google Scholar]
- 2.Garway-Heath DF, Crabb DP, Bunce C, et al. Latanoprost for open-angle glaucoma (UKGTS): a randomised, multicentre, placebo-controlled trial. Lancet. 2015;385(9975):1295–1304. [DOI] [PubMed] [Google Scholar]
- 3.Tielsch JM, Katz J, Quigley HA, Miller NR, Sommer A. Intraobserver and interobserver agreement in measurement of optic disc characteristics. Ophthalmology. 1988;95(3):350–356. [DOI] [PubMed] [Google Scholar]
- 4.Varma R, Steinmann WC, Scott IU. Expert agreement in evaluating the optic disc for glaucoma. Ophthalmology. 1992;99(2):215–221. [DOI] [PubMed] [Google Scholar]
- 5.Jampel HD, Friedman D, Quigley H, et al. Agreement among glaucoma specialists in assessing progressive disc changes from photographs in open-angle glaucoma patients. Am J Ophthalmol. 2009;147(1):39–44 e31. [DOI] [PMC free article] [PubMed] [Google Scholar]
- 6.Chan HH, Ong DN, Kong YX, et al. Glaucomatous optic neuropathy evaluation (GONE) project: the effect of monoscopic versus stereoscopic viewing conditions on optic nerve evaluation. Am J Ophthalmol. 2014;157(5):936–944. [DOI] [PubMed] [Google Scholar]
- 7.Li Z, He Y, Keel S, Meng W, Chang RT, He M. Efficacy of a Deep Learning System for Detecting Glaucomatous Optic Neuropathy Based on Color Fundus Photographs. Ophthalmology. 2018;125(8):1199–1206. [DOI] [PubMed] [Google Scholar]
- 8.Raju M, Pagidimarri V, Barreto R, Kadam A, Kasivajjala V, Aswath A. Development of a Deep Learning Algorithm for Automatic Diagnosis of Diabetic Retinopathy. Stud Health Technol Inform. 2017;245:559–563. [PubMed] [Google Scholar]
- 9.Ting DSW, Cheung CY, Lim G, et al. Development and Validation of a Deep Learning System for Diabetic Retinopathy and Related Eye Diseases Using Retinal Images From Multiethnic Populations With Diabetes. JAMA. 2017;318(22):2211–2223. [DOI] [PMC free article] [PubMed] [Google Scholar]
- 10.Takahashi H, Tampo H, Arai Y, Inoue Y, Kawashima H. Applying artificial intelligence to disease staging: Deep learning for improved staging of diabetic retinopathy. PLoS One. 2017;12(6):e0179790. [DOI] [PMC free article] [PubMed] [Google Scholar]
- 11.Gulshan V, Peng L, Coram M, et al. Development and Validation of a Deep Learning Algorithm for Detection of Diabetic Retinopathy in Retinal Fundus Photographs. JAMA. 2016;316(22):2402–2410. [DOI] [PubMed] [Google Scholar]
- 12.Tatham AJ, Medeiros FA. Detecting Structural Progression in Glaucoma with Optical Coherence Tomography. Ophthalmology. 2017;124(12S):S57–S65. [DOI] [PMC free article] [PubMed] [Google Scholar]
- 13.Leung CK, Cheung CY, Weinreb RN, et al. Retinal nerve fiber layer imaging with spectral-domain optical coherence tomography: a variability and diagnostic performance study. Ophthalmology. 2009;116(7):1257–1263, 1263 e1251–1252. [DOI] [PubMed] [Google Scholar]
- 14.Dong ZM, Wollstein G, Schuman JS. Clinical Utility of Optical Coherence Tomography in Glaucoma. Invest Ophthalmol Vis Sci. 2016;57(9):OCT556–567. [DOI] [PMC free article] [PubMed] [Google Scholar]
- 15.Kuang TM, Zhang C, Zangwill LM, Weinreb RN, Medeiros FA. Estimating Lead Time Gained by Optical Coherence Tomography in Detecting Glaucoma before Development of Visual Field Defects. Ophthalmology. 2015;122(10):2002–2009. [DOI] [PMC free article] [PubMed] [Google Scholar]
- 16.He K, Zhang X, Ren S, Sun J. Deep Residual Learning for Image Recognition. ArXiv e-prints. 2015. https://ui.adsabs.harvard.edu/#abs/2015arXiv151203385H. Accessed 12.01.15. [Google Scholar]
- 17.Deng J, Dong W, Socher R, Li L-J, Li K, Fei-Fei L. Imagenet: A large-scale hierarchical image database. Paper presented at: Computer Vision and Pattern Recognition, 2009. CVPR 2009. IEEE Conference on2009. [Google Scholar]
- 18.Kingma DP, Ba J. Adam: A method for stochastic optimization. ArXiv e-prints. 2014. https://arxiv.org/abs/1412.6980. Accessed 11.01.18. [Google Scholar]
- 19.Ruder S An overview of gradient descent optimization algorithms. ArXiv e-prints. 2016. https://arxiv.org/abs/1609.04747. Accessed 11.01.18. [Google Scholar]
- 20.Smith LN. Cyclical Learning Rates for Training Neural Networks. ArXiv e-prints. 2017. https://arxiv.org/abs/1506.01186. Accessed 05.01.18. [Google Scholar]
- 21.Selvaraju RR, Cogswell M, Das A, Vedantam R, Parikh D, Batra D. Grad-CAM: Visual Explanations from Deep Networks via Gradient-based Localization. ArXiv e-prints. 2016. https://ui.adsabs.harvard.edu/#abs/2016arXiv161002391S. Accessed 10.01.16. [Google Scholar]
- 22.Selvaraju RR, Das A, Vedantam R, Cogswell M, Parikh D, Batra D. Grad-CAM: Why did you say that? ArXiv e-prints. 2016. https://ui.adsabs.harvard.edu/#abs/2016arXiv161107450S. Accessed 11.01.16. [Google Scholar]
- 23.Liang K-Y, Zeger SL. Longitudinal data analysis using generalized linear models. Biometrika. 1986;73(1):13–22. [Google Scholar]
- 24.Cleveland WS. Robust locally weighted regression and smoothing scatterplots. Journal of the American statistical association. 1979;74(368):829–836. [Google Scholar]
- 25.Medeiros FA, Sample PA, Zangwill LM, Liebmann JM, Girkin CA, Weinreb RN. A statistical approach to the evaluation of covariate effects on the receiver operating characteristic curves of diagnostic tests in glaucoma. Invest Ophthalmol Vis Sci. 2006;47(6):2520–2527. [DOI] [PubMed] [Google Scholar]
- 26.Rao HL, Addepalli UK, Chaudhary S, et al. Ability of different scanning protocols of spectral domain optical coherence tomography to diagnose preperimetric glaucoma. Invest Ophthalmol Vis Sci. 2013;54(12):7252–7257. [DOI] [PubMed] [Google Scholar]
- 27.Lisboa R, Paranhos A Jr., Weinreb RN, Zangwill LM, Leite MT, Medeiros FA. Comparison of different spectral domain OCT scanning protocols for diagnosing preperimetric glaucoma. Invest Ophthalmol Vis Sci. 2013;54(5):3417–3425. [DOI] [PMC free article] [PubMed] [Google Scholar]
- 28.Lisboa R, Leite MT, Zangwill LM, Tafreshi A, Weinreb RN, Medeiros FA. Diagnosing preperimetric glaucoma with spectral domain optical coherence tomography. Ophthalmology. 2012;119(11):2261–2269. [DOI] [PMC free article] [PubMed] [Google Scholar]
- 29.Patel NB, Wheat JL, Rodriguez A, Tran V, Harwerth RS. Agreement between retinal nerve fiber layer measures from Spectralis and Cirrus spectral domain OCT. Optometry and vision science: official publication of the American Academy of Optometry. 2012;89(5):E652–666. [DOI] [PMC free article] [PubMed] [Google Scholar]
- 30.Leite MT, Rao HL, Weinreb RN, et al. Agreement among spectral-domain optical coherence tomography instruments for assessing retinal nerve fiber layer thickness. Am J Ophthalmol. 2011;151(1):85–92 e81. [DOI] [PubMed] [Google Scholar]
- 31.Shanmugam MP, Mishra DK, Madhukumar R, Ramanjulu R, Reddy SY, Rodrigues G. Fundus imaging with a mobile phone: a review of techniques. Indian J Ophthalmol. 2014;62(9):960–962. [DOI] [PMC free article] [PubMed] [Google Scholar]
- 32.Lamirel C, Bruce BB, Wright DW, Newman NJ, Biousse V. Nonmydriatic digital ocular fundus photography on the iPhone 3G: the FOTO-ED study. Archives of ophthalmology (Chicago, Ill: 1960). 2012;130(7):939–940. [DOI] [PMC free article] [PubMed] [Google Scholar]
- 33.Kumar S, Wang EH, Pokabla MJ, Noecker RJ. Teleophthalmology assessment of diabetic retinopathy fundus images: smartphone versus standard office computer workstation. Telemed J E Health. 2012;18(2):158–162. [DOI] [PubMed] [Google Scholar]
- 34.Kosoko-Lasaki O, Gong G, Haynatzki G, Wilson MR. Race, ethnicity and prevalence of primary open-angle glaucoma. Journal of the National Medical Association. 2006;98(10):1626–1629. [PMC free article] [PubMed] [Google Scholar]
- 35.Tielsch JM, Sommer A, Katz J, Royall RM, Quigley HA, Javitt J. Racial variations in the prevalence of primary open-angle glaucoma. The Baltimore Eye Survey. Jama. 1991;266(3):369–374. [PubMed] [Google Scholar]
- 36.Wilson R, Richardson TM, Hertzmark E, Grant WM. Race as a risk factor for progressive glaucomatous damage. Annals of ophthalmology. 1985;17(10):653–659. [PubMed] [Google Scholar]
- 37.Martin MJ, Sommer A, Gold EB, Diamond EL. Race and primary open-angle glaucoma. Am J Ophthalmol. 1985;99(4):383–387. [DOI] [PubMed] [Google Scholar]
- 38.Grant WM, Burke JF, Jr. Why do some people go blind from glaucoma? Ophthalmology. 1982;89(9):991–998. [DOI] [PubMed] [Google Scholar]
Associated Data
This section collects any data citations, data availability statements, or supplementary materials included in this article.


