

SUMMARY
Syntaphilin (SNPH) is a major mitochondrial anchoring protein targeted to axons and excluded from dendrites. In this study, we provide in vivo evidence that this spatial specificity is lost in Shiverer (Shi) mice, a model for progressive multiple sclerosis (MS), resulting in inappropriate intrusion of SNPH into dendrites of cerebellar Purkinje cells with neurodegenerative consequences. Thus, reconstituting dendritic SNPH intrusion in SNPH-KO mice by viral transduction greatly sensitizes Purkinje cells to excitotoxicity when the glutamatergic climbing fibers are stimulated. Finally, we demonstrate in vitro that overexpression of SNPH in dendrites compromises neuronal viability by inducing N-methyl-D-aspartate (NMDA) excitotoxicity, reducing mitochondrial calcium uptake, and interfering with quality control of mitochondria by blocking somal mitophagy. Collectively, we propose that inappropriate immobilization of dendritic mitochondria by SNPH intrusion produces excitotoxicity and suggest that interception of dendritic SNPH intrusion is a therapeutic strategy to combat neurodegeneration.
In Brief
Joshi et al. show that an axon-specific mitochondrial anchoring protein, Syntaphilin, invades dendrites in the progressive multiple sclerosis (MS) mouse model Shiverer. Dendritic SNPH intrusion sensitizes neurons to excitotoxicity, alters mitochondrial Ca2+ buffering, and impedes somal mitophagy, suggesting interception of dendritic SNPH intrusion as a therapeutic strategy in MS.
Graphical Abstract
INTRODUCTION
Dysmyelinating mutant Shiverer (Shi) mice are a model for the progressive phase of the neurodegenerative disease multiple sclerosis (MS) (Andrews et al., 2006; Joshi et al., 2015). The cerebellum in Shi mice is characterized by two prominent types of damage: white matter damage, exemplified by swelling or torpedoes along axons of Purkinje cells (PCs), and gray matter damage, exemplified by death of PCs (Loers et al., 2004; Joshi et al., 2015). In a recent study, we demonstrated that this cerebellar injury is accompanied by a marked upregulation of Syntaphilin (SNPH) and that global genetic deletion of SNPH is strongly neuroprotective in reducing both white and gray matter injuries (Joshi et al., 2015). Because SNPH is an axon-specific protein (Kang et al., 2008), we believe that deletion of SNPH from axons provides a single neuroprotective explanation for both forms of cerebellar injuries (white and gray matter). However, when we re-examined the Shi cerebellar tissue blocks after our initial publication (Joshi et al., 2015), we discovered that SNPH also inappropriately intrudes into dendrites of a subset of PCs. Surprisingly, reconstituting dendritic SNPH intrusion in PCs of SNPH-knockout (KO) mice by viral transduction shows dramatic sensitization of PCs to climbing fiber (CF)-mediated excitotoxicity. We next artificially recreated SNPH dendritic intrusion in vitro and showed that this compromises neuronal viability by sensitizing neurons to N-methyl-D-aspartate (NMDA) excitotoxicity, reducing the calcium uptake of mitochondria and degrading quality control of mitochondria by reducing the return of dendritic mitochondria to the soma for mitophagy. We hypothesize that SNPH dendritic intrusion is a form of neurodegeneration that causes gray matter injuries independent of white matter injuries in the Shi mouse. Interception of SNPH dendritic intrusion could be an exciting therapy to combat gray matter injuries in other neurodegenerative diseases as well.
RESULTS
In Vivo Evidence of SNPH Intrusion into Dendrites of PCs in Shi Mice
We used three independent methods to demonstrate SNPH intrusion into dendrites of PCs in Shi mice: first, immunohistochemistry (IHC) using presynaptic markers to identify SNHP in dendrites; second, pre-tagging of dendritic mitochondria with viral transduction; third, ultrastructural electron microscopy (EM) immunogold labeling.
IHC with Presynaptic Markers
Figures 1A–1J show IHC for SNPH in the molecular layer of the cerebellum, which consists of PC dendrites intermingled with presynaptic axons. To sort out SNPH, which is known to be present in axons, from SNPH that might have mislocated into dendrites, we used a presynaptic marker, synaptotagmin2 (Syt2), to distinguish between intra- and extra-dendritic SNPH. Slices from 3.5-month-old wild-type (WT) and Shi mice were triple-labeled with SNPH (Figures 1A and 1B, green), Syt2 (Figures 1C and 1D, red), and Calbindin (a PC marker; Figures 1E and 1F, blue). Figures 1G and 1H show enlarged regions of dendrites from Figures 1E and 1F. In Shi mice (Figure 1H), Syt2 (red) is completely excluded from Calbindin-labeled dendrites (blue), as expected. However, SNPH (green) is present both in and outside of the dendrites. In contrast, in the WT (Figure 1G), both Syt2 and SNPH remain outside of the dendrites. To further confirm the intra-dendritic localization of SNPH, shown by white arrow in Figure 1H, we used an orthogonal slice view of the same region in Figure 1J, which clearly shows that SNPH resides in the dendritic volume. In contrast, an orthogonal view of SNPH in the WT (Figure 1I) confirms that SNPH is mostly presynaptic, corroborating previous studies that SNPH is normally absent in dendrites (Kang et al., 2008). Quantitative analysis of the percentage area of SNPH and Syt2 within Calbindin is shown in Figure 1K. Step-by-step exclusion of extra-dendritic SNPH by the presynaptic marker Syt2 to arrive at intra-dendritic SNPH in WT, Shi, and SNPH-KO is shown in Videos S1, S2, and S3.
Figure 1. Dendritic SNPH Intrusion in PCs of Dysmyelinating Shi Mice In Vivo.

(A–F) Immunohistochemistry technique for capturing SNPH intrusion in PC dendrites. Shown is SNPH (green), Syt2 (red), and Calbindin (blue) labeling in 3.5-month-old WT (A, C, and E) and Shi (B, D, and F) mice. Scale bar, 10 μm.
(G and H) High magnification of the maximum intensity projection image from the z stack through dendritic regions of WT (G) and Shi (H).
(I and J) Orthogonal (slice) view of SNPH punctum (indicated by arrows in panels G and H) in the dendritic region from WT (I) and Shi (J) in x-z and y-z orientations, respectively.
(K) Quantification of percentage area occupied by SNPH within the dendritic volume from 3 mice of each group. Data are shown as mean ± SEM. *p < 0.05.
(L–N) Capturing SNPH intrusion by pre-tagging dendritic mitochondria in vivo using viral transduction.
(L) Technique to selectively transduce PCs with AAV-Mito-mCherry.
(M) Demonstration of successful pre-tagging of mitochondria in dendrites of a single PC by Calbindin staining. Scale bar, 10 μm.
(N) Demonstration of how pre-tagged dendritic mitochondria in PCs are used to capture SNPH intrusion by 3D rotation.
(O and P) Single dendritic tree in WT (O) or Shi (P) pre-tagged with Mito-mCherry (red) and SNPH intrusion (green) captured by co-rotation with Mito-mCherry. Merged images show the fraction of dendritic mitochondria anchored by intruded SNPH (yellow).
(Q and R) Percentage of PCs with SNPH intrusions (Q) and percentage of SNPH bound to mitochondria per dendritic tree (R) from WT (n = 73) and Shi (n = 106) PCs. Data are shown as mean ± SEM. ***p < 0.005.
Pre-tagging Dendritic Mitochondria in PCs by Viral Transduction to Capture SNPH Intrusion
To more definitively prove SNPH intrusion and to assess the fraction of mitochondria bound by SNPH intrusion per dendritic tree, we used viral transduction to pre-tag dendritic mitochondria of individual PCs with a fluorescent mitochondrial reporter without labeling presynaptic axons. We then used the pre-tagged dendritic mitochondria as anchoring partners to identify SNPH intruding into dendrites in standard global SNPH staining. To pre-tag mitochondria in axons, somata, and dendrites of an individual PC, we injected adeno-associated virus (AAV)-mitom-Cherry into the deep cerebellar nuclei (DCNs) (Huda et al., 2014; Kaemmerer et al., 2000) of 3.5-month-old WT and Shi mice (Figure 1L). Because the DCN is the first synaptic station of the PC axon, retrograde uptake of the viral particles by the axon allows selective labeling of mitochondria in sparsely transduced PCs.
Figure 1M, left, shows a PC infected with AAV-mito-mCherry. Immunolabeling with Calbindin (Figure 1M, right) was used to confirm that we successfully pre-tagged mitochondria in the dendrites with mito-mCherry (red) without labeling neighboring presynaptic axons. Next, we immunolabeled WT and Shi slices with SNPH (green). Upon 3D analysis, many of the labeled SNPH puncta in Shi were identified to be dendritic intruders because they co-localized with the pre-tagged dendritic mito-mCherry in 3D rotation (Figure 1N).
Figures 1O and 1P show two single dendritic arbors from WT (Figure 1O) and Shi (Figure 1P) pre-tagged with red mito-mCherry at 3.5 months. Counting the mito-mCherry puncta revealed no significant difference in mitochondrial density per dendritic arbor between WT and Shi (average, 794.8 ± 139.2 [n = 73 PCs] and 817.6 ± 130.3 [n = 106 PCs] mito-mCherry puncta per cell in WT and Shi, respectively). On the other hand, the SNPH puncta (green) viewed in 3D volumes with the mito-mCherry puncta (red) showed a significant increase in SNPH puncta associated with mito-mCherry in PC dendrites of Shi (Figure 1P, yellow in the merged image). Still frames of the SNPH, mito-mCherry, and merged images from this analysis at 3 different rotation angles are shown in Figure S2, and 3D reconstructions are shown in Videos S4 and S5. Even though the signals that trigger dendritic SNPH intrusion in Shi remain to be elucidated, SNPH intrusion is unlikely to be triggered by abnormal excessive biogenesis of mitochondria in Shi dendrites because the mitochondrial numbers are similar in WT and Shi dendritic arbors.
This analysis also allows us to estimate the fraction of mitochondria immobilized by SNPH intrusion per dendritic tree, as indicated by co-localization. We marked the coordinates of mito-mCherry puncta within 3D volumes of PC dendrites, indicating the “intrusion complex” with SNPH in yellow. For this particular Shi dendritic arbor, ~90% of all mitochondria co-localized with SNPH (yellow). We quantitatively compared the WT with Shi for all dendritic arbors by plotting the average percentage of PCs with SNPH dendritic intrusions (Figure 1Q) and the percentage of mitochondria bound to SNPH per dendritic arbor (Figure 1R). At 3.5 months, the average number of PCs with dendritic SNPH intrusion is low, 6.8% (of 73 PCs) for the WT, and increases to 31.1% (of 106 PCs) in Shi (Figure 1Q). For each dendritic arbor, the average fraction of SNPH bound to mitochondria in the WT is 4.6% ± 1.4% (of a total of 3,941 mito-mCherry puncta) and increases to 37.6% ± 4% (of a total of 26,981 mito-mCherry puncta, p < 0.005) for Shi (Figure 1R). Collectively, at 3.5 months, 31.1% of PCs are invaded by SNPH, resulting in SNPH binding to 38% of mitochondria per dendritic arbor. In contrast, this dendritic SNPH invasion is insignificant in WT cerebellum.
EM Immunogold Labeling of SNPH
Finally, we performed SNPH immunogold particle labeling in cerebellar sections from WT, Shi, and SNPH-KO at 3.5 months (Figure S1). Dendrites in the molecular layer were identified morphologically by a thick, long shaft, outlined by dashed red lines in Figures S1A–S1C). Enlarged regions of dendrites containing mitochondria (red arrows in Figures S1A–S1C) are shown in Figures S1D–S1F. As expected, SNPH gold particles were mostly absent in dendrites of the WT (Figure S1D) and SNPH-KO (Figure S1F). In contrast, SNPH gold particles associated with mitochondria are present in Shi dendrites (red arrows in Figure S1E). As a positive control, we imaged SNPH gold labeling in axons from the granular layer for the three genotypes (Figures S1G–S1I). The enlarged axonal regions from the WT (Figure S1J) and Shi (Figure S1K) showed the expected presence of SNPH gold particles on mitochondria (shown by red arrows) and their absence in SNPH-KO (Figure S1L). Quantification of the fraction of mitochondria labeled with SNPH gold particles and the number of gold particles per mitochondrion are shown in Figures S1M and S1N, respectively. Interestingly, our EM result in Figure S1M show that ~50% of mitochondria are labeled with SNPH gold particles, consistent with our viral pre-tagging method (Figure 1R), indicating that ~40% of mitochondria per dendritic tree are labeled with SNPH.
Having demonstrated in vivo dendritic SNPH intrusion with three independent methods, we next examined whether dendritic SNPH intrusion produces in vivo pathology.
In Vivo Evidence that Dendritic SNPH Intrusion Sensitizes PC Dendrites to Glutamatergic Excitotoxicity
MS is classically a primary axonal disease, where loss of myelin gradually leads to axonal degeneration, which could retrogradely cause neuronal death. In the Shi model for progressive MS, we have already demonstrated significant axonal degeneration and PC death in the cerebellum (Joshi et al., 2015). An important question is whether dendritic SNPH intrusion is an innocuous secondary reaction to axonal demyelination in Shi or a new neurodegenerative event independent of axonal pathology.
We therefore examined whether dendritic SNPH intrusion can directly cause neurodegeneration specific to PCs independent of dysmyelination. Because PCs are innervated by the powerful glutamatergic, excitatory olivocerebellar CF (Sugihara, 2006), we started by examining whether CF stimulation exacerbates excitotoxicity selectively in dendrites with SNPH intrusion.
We started with global SNPH-KO mice in a normal myelination background and used stereotaxic lentiviral transduction to reintroduce GFP-tagged variants of SNPH selectively into a subset of PCs to reconstitute two types of transduced dendrites. The first type of transduced dendrites has normal SNPH. The second type of transduced dendrite has mutant SNPH (1–469), which lacks the mitochondrial binding motif (Kang et al., 2008), as a control to demonstrate that any pathologic consequences of dendritic SNPH intrusion are related to immobilization of mitochondria in dendrites. We then stressed these two types of transduced dendrites by pharmacologically stimulating the CFs with harmaline to examine possible excitotoxicity. Harmaline has been known since the early 1970s (de Montigny and Lamarre, 1973; Llinás and Volkind, 1973) to induce rhythmic burst firing activity in inferior olivary nuclei that is transmitted via CFs to synapse on the dendritic trees of PCs (Beitz and Saxon, 2004; Handforth, 2012). Indeed, activation of CFs by harmaline is a model of PC excitotoxicity (O’Hearn and Molliver, 1993, 1997). We therefore examined whether dendritic SNPH intrusion sensitizes PC excitotoxicity to harmaline.
Figures 2A and 2B show that, 3 weeks after stereotaxic injection, a small set of PCs was selectively transduced, showing dendrites with normal SNPH (Figure 2B) and mutant SNPH (1–469) (Figure 2A) before stimulation of CFs by harmaline. Note that both types of transduced dendrites were normal looking and expressed SNPH at levels that mimic the extensive dendritic SNPH intrusion occurring naturally in some PCs in Shi (Figure 1P; Figure S2, bottom). We next examined whether these two types of dendrites exhibit differential sensitivity to CF stimulation. To induce short-term stimulation of CFs, we injected mice with harmaline for 3 consecutive days (once a day). Strikingly, in dendrites transduced with SNPH, this short-term CF stimulation with harmaline causes massive dendritic shrinkage (Figure 2F). This dendritic shrinkage appears to be an early pathologic sign that ultimately leads to dendritic fragmentation, PC death, and loss of Calbindin staining (Figures 2I–2K). In contrast, dendrites transduced with the mutant SNPH (1–469), which does not immobilize mitochondria, are completely protected (Figure 2C). Quantification of differential shrinkage of the dendritic tree is shown in Figure 2L. CF stimulation by harmaline differentially shrinks dendrites transduced with normal SNPH but not dendrites transduced with mutant SNPH (1–469), which does not bind mitochondria. We conclude from these transduction studies that dendritic SNPH intrusion directly sensitized PCs to excitotoxicity via CF innervation independent of dysmyelinating axonal pathology and that this excitotoxicity is specifically related to excessive immobilization of mitochondria in dendrites. This conclusion also has important implications for explaining PC death in Shi. In Shi, ~31% of PCs with dendritic SNPH intrusion at 3.5 months correspond to ~37% PC death at the terminal phase of Shi life at 4.5 months (Joshi et al., 2015). We therefore hypothesize that the main cause of PC death in Shi is dendritic SNPH intrusion, which sensitizes ~31% of PCs at 3.5 months to die by slow excitotoxicity via chronic baseline activity of CFs, reaching completion at the end of Shi life at 4.5 months.
Figure 2. SNPH Intrusion Sensitizes PC Dendrites to Glutamatergic Excitotoxicity In Vivo.

(A and B) Representative images of lentivirally transduced GFP-SNPH (1–469) (A) and GFP-SNPH (B) in PCs of SNPH-KO mice injected with saline (no harmaline, vehicle only).
(C-H) Effect of harmaline on GFP-SNPH (1–469)-transduced (C) and GFP-SNPH-transduced (F) PC dendrites. Degenerating dendrites in GFP-SNPH-transduced PCs can be seen in (F). Also shown is Calbindin labeling of GFP SNPH (1–469) (D) and GFP-SNPH (G) from (C) and (F). Merged images of GFP SNPH (1–469) and GFP-SNPH with Calbindin are shown in (E) and (H), respectively.
(I–K) Representative image of a harmaline-induced degenerating PC (white arrow in I) transduced with GFP-SNPH. Calbindin staining from the same section is shown in (J), whereas a merged image is shown in (K). Scale bars, 20 μm.
(L) Quantification of dendritic shrinkage in GFP-SNPH (1–469)- and GFP-SNPH-transduced PCs in the absence (n = 3 mice, vehicle only) or presence of harmaline (n = 5 mice). Data are shown as mean ± SEM. ***p < 0.001.
Collectively, we established a phenomenon of dendritic SNPH intrusion in an animal model of progressive MS. Using in vivo transduction of various SNPH variants to reconstitute dendritic SNPH intrusion in a SNPH-KO background, we established that this dendritic SNPH intrusion mediates excitotoxicity. This excitotoxicity possibly results from immobilizing mitochondria on PC dendrites and sensitizing them to glutamatergic excitotoxicity via powerful CF innervation. We further investigate this excitotoxicity, as well as other possible harm dendritic SNPH intrusion might cause, using in vitro systems where parameters are easier to manipulate.
In Vitro Evidences that SNPH Dendritic Intrusion Compromises Neuronal Viability
To test whether SNPH invasion into dendrites is sufficient to compromise neuronal viability, we promoted SNPH dendritic intrusion in cultured hippocampal neurons by overexpressing SNPH. We used hippocampal neurons instead of PCs for in vitro studies because this system is commonly used for in vitro studies of dendritic mitochondria, providing simple and efficient protocols to isolate relatively pure neuronal populations for in vitro studies, unlike less tractable PCs. We first confirmed dendritic intrusion of overexpressed SNPH in primary hippocampal neurons by expressing GFP alone, GFP-SNPH, and GFP-SNPH (1–469) plasmids and stained these neurons with the dendritic marker MAP-2. Representative images of hippocampal neurons transfected with GFP, GFP-SNPH, and GFP-SNPH (1–469) and MAP-2 are shown in Figure 3A. We observed both axonal and dendritic localization of these GFP variants in hippocampal neurons and specifically dendritic intrusion of GFP-SNPH and GFP-SNPH (1–469). We next examined whether dendritic SNPH intrusion is spatially random or specific. The two key domains in a dendritic arbor are shafts and spines; the latter are protrusions from shafts where synapses are formed. To localize sites of dendritic SNPH intrusion, we overexpressed a GFP-SNPH (green) plasmid and then co-stained with the spine-specific marker PSD95 (red). Interestingly, the SNPH intruders are only localized to dendritic shafts and not spines (Figure 3B, right). The two white arrows in Figure 3B, bottom right panels, show two PSD95-positive spines clearly protruding from a SNPH-containing shaft, using the morphological criterion of a PSD95-positive spine neck that connects the spine to the SNPH-positive shaft. This morphological criterion was confirmed to be valid in identifying spines protruding from shafts in a control study where GFP was transfected to fill both shafts and spines (Figure 3B, bottom left); in this case, PSD95 staining colocalizes with GFP within spines (arrows). Intrusion of SNPH into the shaft is highly significant because 90% of mitochondria are localized to the shaft in a quiescent neuron even though they may relocate to spines during spine activation (Li et al., 2004). By intruding where 90% of resting mitochondria reside, the shaft-specific intrusion of SNPH is thus expected to have a strong effect on dendritic mitochondrial function. We then identified three adverse effects of dendritic SNPH intrusion.
Figure 3. Ectopically Expressed SNPH Invades into Dendrites and Affects Resting ATP Levels In Vitro.

(A) Representative images of hippocampal neurons transfected with GFP alone, GFP-SNPH, and GFP SNPH (1–469) and stained for MAP-2 antibody to label corresponding somata and dendrites. Merged images (yellow) are shown in the far right panels. Open arrows in the merged panels indicate dendrites, whereas closed arrows indicate axons. Scale bar, 20 μm.
(B) Spatial distribution of GFP and GFP-SNPH along dendrites. GFP- or GFP-SNPH-transfected (green) neurons were stained for the postsynaptic marker antibody PSD-95 (red). Scale bar, 10 μm. An enlarged region of dendrites from GFP-PSD95 and GFP-SNPH-PSD95 is shown in the bottom left and right rows, respectively. Yellow in the bottom left row indicates co-localization of GFP and PSD95 in the spine.
(C) Quantification of the resting mitochondrial membrane potential (Δψm; TMRM fluorescence) in the soma and dendritic and axonal regions from GFP-WT, GFP-SNPH-KO, GFP-SNPH-overexpressing, and GFP-SNPH (1–469)-overexpressing neurons. Data are shown as mean ± SEM from 5 cells in 3 different experiments in each group.
(D) PercivalHR ratio images of 488/440 nm, indicating resting ATP levels in dendrites of WT, SNPH-KO, SNPH-overexpressing, and SNPH (1–469)-overexpressing neurons. The pseudocolor scale bar on the right indicates black as the lowest and white as the highest ATP levels.
(E) Quantification of the PercivalHR 488/440 nm ratio from neuronal somata, dendrites, and axons from 5 neuronal somata, 15 dendrites, and 5 axons. Data are shown as mean ± SEM. *p < 0.05.
Dendritic SNPH Intrusion Degrades Mitochondrial Health
We first examined whether dendritic SNPH intrusion affects the resting health of dendritic mitochondria using assays for mitochondrial inner membrane potential (Δψm) and resting ATP levels. We measured Δψm using tetramethylrhodamine methyl ester (TMRM) (Joshi and Bakowska, 2011a, 2011b; Joshi et al., 2011; Ward et al., 2000). Figure 3C shows that there are no significant differences in Δψm in the somal, dendritic, and axonal compartments in the four genetic groups (GFP-WT, GFP-SNPH-KO, GFP-SNPH, and GFP-SNPH (1–469)). Second, we measured the resting ATP level with the PercivalHR probe (Tantama et al., 2013) in these three neuronal compartments in the four genetic groups (Figures 3D and 3E). Interestingly, SNPH overexpression causes a modest reduction in ATP selectively in dendrites over somata and axons (Figure 3E). This modest decrease in resting ATP is unlikely to be due to pH changes; a previous study showed that SNPH overexpression did not change the cytosolic pH in cultured neurons (Zhou et al., 2016), and in our studies, SNPH overexpression did not change Δψm, which is linked to mitochondrial matrix pH. Figure 3D shows representative ratiometric images of the PercivalHR signal in dendrites of the various genetic groups. The reduction in resting dendritic ATP suggests that dendritic SNPH intrusion slightly degrades resting ATP production of mitochondria.
We next examined whether SNPH intrusion disrupts the ability of mitochondria to handle stress. Because we already demonstrated in vivo that dendritic SNPH intrusion sensitizes PCs to CF-mediated excitotoxicity (Figure 2), we next corroborated this in vitro by directly applying NMDA to induce excitotoxicity (Choi, 1992). We measured Δψm during a 5 μM NMDA treatment. Figure 4A shows neurons from the four genetic groups stained with TMRM (red) to monitor Δψm and co-labeled with various GFP fusion proteins (green) before and at various times after 5 μM NMDA exposure. Cytosolic GFP was used as a control to visualize dendrites without SNPH intrusion (WT and SNPH-KO neurons; top two rows), whereas GFP-tagged SNPH (third row) was used to visualize SNPH intrusion that binds to mitochondria and GFP-tagged SNPH (1–469) (fourth row) was used to visualize SNPH intrusion that does not bind mitochondria. The ability of these four groups of neurons to combat a calcium load induced by NMDA stress is indicated by how long the mitochondria can maintain a Δψm (TMRM fluorescence) following NMDA exposure. All four groups sustained the TMRM signal 5 min after NMDA exposure, indicative of a healthy response to combat NMDA stress. However, at 15 min, all but one group failed to maintain the TMRM signal. The group that failed was the one with the SNPH intrusion that binds mitochondria (third row from the top). Arrows in each panel indicate transfected neurons visualized in the TMRM channel before and at different time points after NMDA exposure. Across groups, the TMRM signal in the group with SNPH intrusion (third row from the top) dramatically dissipated compared with the other groups. As a further control within the same plate transfected with SNPH (third row from the top), neurons not transfected with SNPH did not show TMRM signal dissipation compared with the neuron (arrow) transfected with SNPH. Figure 4B shows a quantification of the average decrease in TMRM fluorescence 15 min after NMDA stress, showing a significant decrease in TMRM fluorescence in SNPH-intruded dendrites. We thus conclude that dendritic SNPH intrusion disrupts the ability of mitochondria to buffer calcium when stress is prolonged.
Figure 4. Dendritic SNPH Intrusion Degrades Mitochondrial Function and Sensitizes Neurons to Excitotoxicity In Vitro.

(A) Representative TMRM fluorescence images from GFP-WT, GFP-SNPH-KO, GFP-SNPH, and GFP-SNPH (1–469)-overexpressing neurons before and at the indicated times after NMDA exposure. The far right panel shows complete loss of TMRM fluorescence after carbonilcyanide p-(triflouromethoxy) phenyl-hydrazone (FCCP) addition. Scale bar, 10 μm. The arrow indicates the transfected cell in the image field.
(B) Quantitative analysis of relative change in TMRM fluorescence at 15 min of NMDA in GFP-WT, GFP-SNPH-KO, GFP-SNPH, and GFP-SNPH (1–469)-overexpressing neurons. Data are shown as mean ± SEM from 12–14 dendrites in 4 cells from 4 different experiments. *p < 0.05.
(C) Representative fluorescence image of the mitochondrial Ca2+ reporter plasmid mitoGCamp5 and Mito-dsRed, showing mitochondrial localization of mitoGCamp5 (yellow in the merged image). The insert in each panel shows an enlarged dendritic region of the neuron.
(D–G) Spatio-temporal pattern of dendritic mitochondrial Ca2+ in WT (D), SNPH-KO (E), SNPH (F), and SNPH (1–469) (G) in the presence of 5 μM NMDA. Lines in gray in each panel represent individual experiments, whereas lines in black (WT), red (SNPH-KO), green (SNPH), and yellow (SNPH (1–469)) represent the average of all experiments in that group.
(H) Quantification of mitoGCamp5 peak fluorescence intensity in dendrites (from D–G) in each indicated group from a minimum of 15 dendrites in 5 different experiments. Data are shown as mean ± SEM. *p < 0.05.
(I) Representative fluorescence images from GFP-WT, GFP-SNPH-KO, GFP-SNPH, and GFP-SNPH (1–469)-overexpressing neurons in control and 10 μM NMDA-treated neuronal cultures. Scale bar, 20 μm. Arrows indicate dead cells in NMDA-treated cultures.
(J) Calcein-propidium iodide (PI) staining in neurons transfected with GFP-WT, GFP-SNPH-KO, GFP-SNPH, and GFP-SNPH (1–469) in NMDA stress experiments. Neurons with intact somata and neuritic arborization are seen as PI-negative (open arrows), whereas neurons with loss of neurites and fragmented cell somata are seen as PI-positive (closed arrows). Scale bar, 20 μm.
(K) Quantification of neuronal death after NMDA exposure in the respective experimental groups from 3 different experiments based on morphological criteria in (I). Data are shown as mean ± SEM. *p < 0.05.
To corroborate that dendritic SNPH intrusion compromises the response of mitochondria to NMDA stress, we directly measured mitochondrial calcium by mitoGCamp5 (Kwon et al., 2016). Figure 4C shows that the mitoGCamp5 probe colocalized with mitochondria (Mito-dsRed), confirming the mitochondrial localization of mitoGCamp5. The enlarged box shows labeling of the calcium probe in dendritic mitochondria. We focused on dendrites, and Figures 4D–4G show the dendritic mitochondrial calcium response in the four genetic groups during sustained NMDA treatment. Only the group with dendritic SNPH intrusion shows a reduced calcium response, suggesting that mitochondrial calcium uptake is compromised. Figure 4H shows the average peak mitochondrial calcium response in the dendrites of the four genetic groups, demonstrating a reduction only in the SNPH-overexpressing group.
Dendritic SNPH Intrusion Sensitizes Neurons to Excitotoxicity
Having demonstrated that SNPH dendritic intrusion degrades the ability of mitochondria to combat stress by degrading their calcium uptake ability, we next examined whether chronic stress leads to excitotoxicity (i.e., neuronal death). To test whether dendritic SNPH intrusion sensitizes neurons to excitotoxicity, we treated the four groups of neurons described in Figure 4I with a slightly higher dose of NMDA (10 μM) for 30 min and assessed neuronal viability after 24 h (Joshi et al., 2011; Wang and Schwarz, 2009). Representative images of neurons transfected with GFP in WT, GFP in SNPH-KO, GFP-SNPH, and GFP-SNPH (1–469) are shown in Figure 4I. Neuronal cells with intact cell somata and an extensive neuritic arbor were counted as live neurons, whereas neurons with loss of the neuritic network and fragmented cell somata were counted as dead neurons. Neuronal viability was also verified by Calcein-propidium iodide (PI; Figure 4J) staining, which labels the nucleus and chromosome only in dead cells (Jiajia et al., 2017; Ying et al., 2001). Representative images of Calcein-PI-labeled neurons in GFP in the WT and SNPH-KO, GFP-SNPH, and GFP-SNPH (1–469) are shown in Figure 4J. All neurons with loss of the neuronal network and fragmented somata were found to be PI-positive (closed arrow). Again, all groups maintained viable neurons after 24 h, except the group with dendritic intrusion of mitochondrion-binding SNPH, where significant cell death occurs (SNPH group). The average results are shown in Figure 4K. The results suggest that artificially driving SNPH into dendrites sensitizes the neurons to NMDA toxicity, corroborating the in vivo finding that dendritic SNPH intrusion sensitizes PCs to CF-mediated excitotoxicity (Figure 2).
Dendritic SNPH Intrusion Blocks the Return of Dendritic Mitochondria to the Soma for Mitophagy
We next examined a different class of adverse effects of dendritic SNPH intrusion on neuronal viability; quality control of mitochondria is compromised by blocking the return of aging mitochondria from the dendrites to the soma for mitophagy. In general, clearance of mitochondria by mitophagy can occur at the soma and locally at distal axonal and dendritic processes (Misgeld and Schwarz, 2017; Ashrafi et al., 2014; Cai et al., 2012). Even though recent studies have suggested that lysosomes can relocate to distal dendritic processes for local clearance of some cargoes, no mitophagy (clearance of mitochondrial cargoes) has been reported at distal dendrites (Goo et al., 2017). This, coupled with the fact that dendritic mitochondria are much more metabolically active than axonal mitochondria (Overly et al., 1996; Dusart and Sotelo, 1994), suggests a critical need for dendritic mitochondria to return to the soma for mitophagy to maintain the overall quality of mitochondria in the system. We therefore tested whether SNPH dendritic intrusion inhibits somal mitophagy.
The Somal Mitophagy Index Is Reduced by SNPH Overexpression
To image the spatial distribution of live mitophagy, we used a ratiometric fluorescence probe, mt-mKeima, that integrates mitophagy events (Katayama et al., 2011; Sun et al., 2015; Bingol et al., 2014). When expressed into the mitochondrial matrix, the green signal (mKeima, 440 nm) initially represents all mitochondria but turns red (mKeima, 543 nm) when a mitochondrion is engulfed by acidic lysosomes for mitophagy. The red signal is resistant to proteases, yielding an integral readout of mitophagy events. Figure 5A shows the mKeima green signal in WT (Figure 5Aa), SNPH-KO (Figure 5Ab), SNPH-overexpressing (Figure 5Ac), and SNPH (1–469)-overexpressing (Figure 5Ad) co-transfected cells, whereas the mKeima red signal in these groups is shown in Figures 5Ae–5Ah. As expected, the green mKeima signal is distributed throughout the entire neuron from soma to dendrites, reflecting the entire population of neuronal mitochondria. In contrast, the red mKeima signal, representing mitophagy, is mostly restricted to the proximal dendritic and somal regions (Figures 5Ae–5Ah). A representative enlarged image of mKeima in neuronal somata is shown in Figure 5B. We also confirmed that the red mKeima fluorescence originated from lysosomally delivered mitochondria by labeling the neurons with LysoTracker red, a marker for lysosomes (Figure 5B, center panel). The merged image (Figure 5B bottom panel) shows colocalization of mKeima Red and LysoTracker red.
Figure 5. Dendritic SNPH Intrusion Reduces Somal Mitophagy.

(A) Representative fluorescence images of mKeima in WT, SNPH-KO, SNPH, and SNPH (1–469)-overexpressing neurons. 440-nm excitation (green) labels the healthy population of mitochondria, whereas 543-nm excitation (red) represents the mitochondrial population delivered to lysosomes for mitophagy. A merged image of 440- and 543-nm excitation is shown in the far right panels. Scale bar, 20 μm.
(B) Labeling of the lysosomal marker LysoTracker in mKeima-transfected neurons. A merged image of LysoTracker and mKeima 543-nm is shown in the bottom panel. Scale bar, 10 μm.
(C) Quantification of the somal mitophagy index 4, 8, and 12 days after mKeima transfection in WT, SNPH-KO, SNPH, and SNPH (1–469)-overexpressing neurons. Data are shown as mean ± SEM from 15–18 neurons at each time point. *p < 0.05.
(D) Representative kymographs of mitochondria transfected with Mito-dsRed in the WT, SNPH-KO, SNPH, and SNPH (1–469)-overexpressing groups. Scale bar, 10 μm.
(E) Quantitation of axonal and dendritic retrogradely moving mitochondria near neuronal somata in WT (n = 8), SNPH-KO (n = 10), SNPH (n = 8), and SNPH (1–469)-overexpressing (n = 6) neurons. Data are shown as mean ± SEM. **p < 0.05.
A striking feature of the mKeima analysis (Figure 5A) was that SNPH overexpression (Figure 5Ag) significantly reduced somal mitophagy (mKeima red) compared with the other 3 genetic groups (Figures 5Ae, 5Af, and 5Ah). SNPH immunolabeling in neurons from Figures 5Ac and 5Ad is shown in Figures S3C and S3D, respectively. Figure 5C shows the somal mitophagy index in all 4 groups on different days (4, 8, and 12) following mKeima transfection in neurons. The mitophagy index gradually increased from day 4 to day 12 after transfection in all groups except SNPH-overexpressing neurons. The growth of somal mitophagy with time in culture most likely reflects basal return of mitochondrial cargoes from dendrites and axons to the soma for mitophagy, which is blocked by SNPH overexpression.
To further corroborate the mKeima analysis, we performed LC3 analysis under similar basal conditions. However, unlike mKeima, which integrates mitophagy signals, LC3 measures transient mitophagy signals because when an LC3-decorated mitochondrion is engulfed by lysosomes, the LC3 signal disappears. To use LC3 to measure integrals of mitophagy over time in culture, we applied the lysosomal inhibitors (LIs) Pepstatin A and E64D (10 μM each) (Cai et al., 2012) to block the final degradation step of LC3 to convert the transient LC3 signal into an integral signal. This potential toxicity of the LI limits the length of time in culture over which we can measure the basal integral of mitophagy. Figure S4 shows representative single image planes for the SNPH-KO, SNPH, and SNPH (1–469) groups in control and 76 h after LI treatment to induce accumulation of LC3-Mito-dsRed (yellow puncta) in resting, unstressed neurons. We focused on the soma and observed suppression of somal yellow dots (white arrows) in the SNPH-overexpressing group compared with the SNPH-KO and SNPH (1–469) groups. Figure S4M shows quantification of the somal yellow puncta for the three groups, computed using a z stack of 10 planes for each group to avoid bias. The result shows that SNPH overexpression is associated with a statistically significant reduction of somal LC3-Mito-dsRed puncta. This LC3 analysis thus confirms our mKeima analysis (Figure 5C). Finally, we also used EM to corroborate that SNPH overexpression suppresses somal mitophagy in vivo using Shi mice, in which SNPH is naturally overexpressed (Joshi et al., 2015). To compare the effect of SNPH overexpression on somal mitophagy in the same dysmyelinating background, we used EM to count somal mitophagosomes in Shi and Shi-SNPH-KO PCs. Figures S5A and S5B show low-magnification images of Shi (Figure S5A) and Shi-SNPH-KO (Figure S5B) PC somata, with white arrowheads indicating mitophagosomes (degenerating mitochondria engulfed by lysosomes) and white arrows indicating normal-looking mitochondria. Enlarged views of mitophagosomes and mitochondria are shown in Figures S5C–S5F. A mitophagy index is defined as the counts of mitophagosomes normalized by the mitochondrial density in each PC soma. Figure S5G compares the mitophagy index between Shi and Shi-SNPH-KO, normalized by the index of Shi. The results show that SNPH overexpression in Shi significantly reduced somal mitophagy compared with Shi-SNPH-KO.
Cargo Trafficking Analysis following SNPH Overexpression
In general, somal mitophagy receives contributions from retrograde cargoes from both dendritic and axonal compartments. The reduction in somal mitophagy by SNPH overexpression (Figures 5C) could result from blocking both retrograde cargoes. To assess the differential contribution of these two retrograde cargoes to somal mitophagy, we compared retrograde movement of mitochondria per unit length of axons and dendrites near the cell soma (10 μm away) over a 5-min interval. Mitochondrial mobility was monitored by Mito-dsRed. Representative kymographs from WT, SNPH-KO, SNPH-overexpressing, and SNPH (1–469) neurons are shown in Figure 5D. Note that SNPH overexpression stopped all mitochondrial cargo movement in both dendrites and axons. We first compared retrograde movement of mitochondria between axons and dendrites for the WT neurons, where SNPH is present in axons but absent from dendrites. Figure 5E, WT, shows that the retrograde mitochondria per dendrite entering the soma is dramatically higher than from axons, consistent with SNPH being absent in dendrites but present in axons. Further, because there are 4–6 dendrites per soma, the net dendritic mitochondrial cargo is a lot higher than that indicated in Figure 5E, WT. This differential axondendrite cargo net movement (Figure 5E, WT) suggests that the corresponding somal mitophagy index in the WT (Figure 5C) has a very strong dendritic cargo contribution. This conclusion was further strengthened by deleting SNPH from axons using SNPH-KO neurons (Figure 5E, SNPH-KO), causing a dramatic increase in the amount of retrograde axonal mitochondrial movement that matches the retrograde dendritic mitochondrial movement (which was not affected by SNPH-KO because normal dendrites never had much SNPH to begin with). Strikingly, this dramatic increase in retrograde axonal cargoes in SNPH-KO (Figure 5E) did not increase the somal mitophagy index over the WT (compare the black and red bars from 4–12 days in Figure 5C). Considering these two cases (WT and SNPH-KO), we suggest that somal mitophagy in a WT neuron has a disproportionately strong contribution from dendritic retrograde mitochondria cargoes. We therefore suggest that the reduction in somal mitophagy by SNPH overexpression primarily reflects blocking of a formerly disproportionately strong dendritic contribution. However, there are two qualifications to our cargo analysis relating retrograde mitochondrial motility to somal mitophagy. First, SNPH expression causes mitochondrial motility arrest in both directions (Figure 5D), and we only performed cargo analysis in the retrograde direction (Figure 5E), which, we propose, is more relevant to somal mitophagy. However, bidirectional arrest of mitochondrial motility would then lead to an overall reduction in mitostasis, enhanced mitochondrial damage accumulation, and mitophagy. Better correlating retrograde motility and somal mitophagy would require selective inhibition of retrograde mitochondrial motility. Second, considering the mixed microtubule polarity in dendrites, retrograde motility mechanisms may not be the same in axons and dendrites.
Finally, we examined whether SNPH overexpression compromises neuronal viability by causing a non-specific traffic jam of other non-mitochondrial cargoes. Figures 6A–6D show that SNPH overexpression does not affect cargo trafficking of LAMP-1 and Rab7 in dendrites and axons. Kymographs from the SNPH-KO, SNPH, and SNPH (1–469) genetic groups are shown for dendrites (Figures 6A and 6C) and axons (Figures 6B and 6D) for each cargo. Quantification analysis of retrograde and anterograde cargo mobility for each cargo is shown below the respective kymographs (Figures 6E–6H). The results demonstrate that SNPH overexpression does not affect the motility of these non-mitochondrial cargoes.
Figure 6. SNPH Overexpression Does Not Affect Non-mitochondrial Cargo Motility in Neurons In Vitro.

(A–D) Representative kymographs of LAMP-1 (lysosomes, A and B) and Rab7 (late endosomes, C and D) cargoes in dendrites and axons of SNPH-KO, SNPH-overexpressing, and SNPH (1–469)-overexpressing neurons.
(E–H) Quantification of anterograde and retrograde motility of LAMP-1 (E and F) and Rab7 (G and H) cargoes in dendrites and axons of SNPH-KO, SNPH-overexpressing, and SNPH (1–469)-overexpressing neurons. Data are shown as mean ± SEM from 5–6 dendrites and axons from each experimental group.
DISCUSSION
MS is classically an axonal disease triggered by myelin loss. As the disease enters the progressive phase, neurodegeneration becomes irreversible, with few effective treatments. Using a mouse Shi model for progressive MS, we discover a form of excitotoxicity in the gray matter that we hypothesize to be independent of the axonal pathology. This excitotoxicity is triggered by an inappropriate intrusion of an axon-specific mitochondrial anchor, SNPH, into the dendrites of cerebellar PCs that greatly sensitizes the PCs to CF-mediated excitotoxicity (Figure 7). The CF-PC innervation is one of the most powerful glutamatergic synapses known in the nervous system, and our study suggests that any ectopic invasion of SNPH into dendrites could have a profound excitotoxic effect. Besides excitotoxicity, dendritic SNPH intrusion also degrades the quality of mitochondria by reducing somal mitophagy (Figure 7). This discovery has important implications for treatment of MS. Treating axons alone by remyelination therapy may be insufficient; an independent strategy to keep the dendrites a “SNPH-free” zone is crucial for a complete cure. Limitations and new questions raised by this study are discussed below.
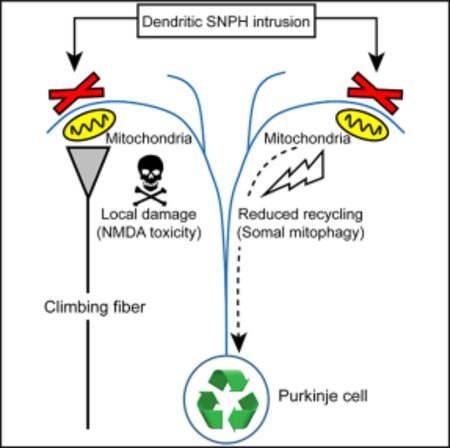
Figure 7. Dendritic SNPH Intrusion Compromises Neuronal Viability: A Two-Prong Model.

Prong #1: dendritic SNPH intrusion locally degrades mitochondrial function and sensitizes Purkinje cells to climbing fiber-mediated excitotoxicity. Prong #2: dendritic SNPH intrusion blocks the return of mitochondria to the soma for mitophagy.
First we propose that dendritic SNPH intrusion downregulates the quality of mitochondria in PCs by interfering with the return of mitochondria to the soma for mitophagy. However, we cannot completely rule out compensatory upregulation of mitophagy locally in dendrites as mitochondria are prevented by SNPH to return to the soma. Nevertheless, local mitophagy events in our mKeima analysis are quite rare (Figure 5A). Second, the pathologic signals that trigger dendritic SNPH intrusion remain to be elucidated. It is unlikely to be an increase in dendritic mitochondrial mass because it appears to remain unchanged in the Shi model (Figures 1O and 1P). Preliminary studies in our laboratory suggest that axonal degeneration is also unlikely to be the trigger because reducing Wallerian degeneration in Shi with slow Wallerian degeneration (Wlds) does not appear to affect dendritic SNPH intrusion. Third, the mechanism by which dendritic SNPH intrusion causes excitotoxicity remains an extremely open question for future study. Recent studies have strongly implied that activation of extra-synaptic NMDA receptors by synaptic spill-over is a major cause of excitotoxicity in a variety of neurodegenerative diseases (Bading, 2017). An exciting development is that extra-synaptic NMDA receptors are directly linked to mitotoxicity (killing of mitochondria) in the dendritic shaft (Bading, 2017). We hypothesize that dendritic SHPH intrusion, which occurs selectively at the shaft, exacerbates this toxic linkage between extra-synaptic NMDA receptors and mitochondria by immobilizing mitochondria at the shaft. Experiments are now in progress to test this hypothesis.
STAR★METHODS
LEAD CONTACT AND MATERIALS AVAILABILITY
Further information and requests for resources and reagents should be directed to and will be fulfilled by the Lead Contact, Shing Yan Chiu (schiu1@wisc.edu). This study did not generate new unique reagents.
EXPERIMENTAL MODEL AND SUBJECT DETAILS
Experimental Mice
All animal usage and protocols were reviewed by Animal Care and Usage Committee and approved by University of Wisconsin- Madison Research Animal Resources Center (RARC). Compound mutant mice Wild (Wt) and Shiverer (Shi) mice used in this study were generated from our previous study (Joshi et al., 2015). SNPH-KO mice were obtained from the Sheng laboratory at NIH/NINDS. Male and female Wt, Shi and SNPH-KO mice at the age of 2.5, 3.5 and 4.5 months were used for experiments.
Primary neuronal culture
Mouse primary hippocampal neurons were isolated from newborn (P0) C57BL6 Wt and SNPH-KO. Briefly P0 mice were decapitated and hippocampi were isolated in ice cold Hank’s buffered saline solution (HBSS).The hippocampi were washed with ice cold Dulbecco’s Modified Eagle Medium (DMEM) and incubated with Papain (2 mg/ml) for 30 min at 5% CO2 at 37°C. The digested tissue was then incubated with DNase (2.5 mg/ml) for 30sec.The DNase was inactivated by fetal bovine serum (FBS) and the tissues was then triturated and filtered through 100 μm sterile cell strainer followed by centrifugation at 200 × g for 5 min at room temperature (RT). Cells were then re-suspended in a mixture of neurobasal-B27 and HGDMEM (with 10% fetal bovine serum) and plated on poly-D-lysine-coated (0.2 mg/ml) coverslips. The plated neurons were switched to neurobasal B27 medium after 5 hr and were treated with 1 μM Ara-C after 48 hr of plating for 48 hr to inhibit the growth of non-neuronal cells in the culture. Cells were then maintained in neurobasal B27 medium with 1/3rd of the media changed every 48 hr.
METHOD DETAILS
Transduction of cerebellar Purkinje cells
AAV- mito-mCherry viral particles were generated at the University of Iowa viral vector core. To transduce PCs with AAV- mito-mCherry, 2.5 months old Wt and Shi mice were anaesthetized with 2% isoflurane in 100% oxygen at 2 L / minute and mounted on the stereotaxic device with ear bars. In a hole of 2 mm diameter on skull, a glass pipette with 15 μm tip was inserted into DCN with stereotaxic coordinates 6.3 mm posterior to Bregma, 1.25 mm lateral to the midline and 2.5 mm dorsal to ventral under the Bregma. 1–1.5 μL AAV 2/1-mito-mCherry (4 × 10¹¹ vg / ml) was injected in the right DCN of the cerebellum at a rate of 1 μL/10 min (micro4 injector, World Precision Instruments, USA). After 3 weeks of injection, mice were perfused with 4% paraformaldehyde and cerebellar sections were obtained and labeled with SNPH antibody to analyze dendritic intrusion of SNPH. PC specific transduction of lentivirus was achieved by cloning SNPH and SNPH1–469 into lentiviral vector containing eGFP with PC specific 844 base pair promotor sequence PCP2_7–6 (Nitta et al., 2017) generated at VectorBuilder Inc. 2 μl of lentiviral solution containing 2.2X10⁶ transducing unit (TU) at the rate of 1.2 μL/10 min were injected into cerebellum with stereotaxic coordinates 6.12 to 6.24 mm posterior to Bregma, 0.5 – 1 mm lateral to the midline and 1.5 – 2 mm dorsal to ventral under the Bregma using micro4 injector (World Precision Instruments, USA). After 3 weeks of lentivirus injection, mice were injected with harmaline or vehicle only via intraperitoneal injection for 3 consecutive days. Mice were perfused with 4% paraformaldehyde 3 days after harmaline (25 mg/kg body weight) or vehicle injection and cerebellar sections were analyzed for dendritic area and PC morphology.
DNA constructs and transfection into neurons
GFP-SNPH and GFP SNPH1–469 plasmids were gifts from Sheng laboratory at NIH. For non-GFP SNPH vectors, we cloned SNPH and SNPH1–469 into pcDNA3.1 vectors (Invitrogen) at HindIII and Xho1 restriction sites. We used Addgene plasmids Mito-GCaMP5G (Addgene plasmid #105009; Kwon et al., 2016), PercivalHR (Addgene plasmid #49082; Tantama et al., 2013), mKeima-Red-Mito-7 (Addgene plasmid #56018, a gift from Michael Davidson), EGFP-LC3 (Addgene plasmid #11546; Jackson et al., 2005) and GFP-RAB7 (Addgene plasmid #12605; Choudhury et al., 2002). pF(UG) hSyn Lamp1-msGFP (#JV012) plasmid was a gift from Jason Vevea/Edwin R. Chapman at UW, Madison. These plasmids were transfected in primary hippocampal neurons on DIV4 using lipofectamine LTX transfection reagent (Thermo Fisher scientific) for 5 hr as described in manufacturer’s protocol.
Immunofluorescence and image acquisition
Cerebellar sections from Wt and Shi mice were stained form SNPH and Calbindin antibodies as described in our previous study (Joshi et al., 2015). Tissue sections from mice cerebellum were deparaffinized with xylene and hydrated through a series of alcohol washes and water, boiled for 20 min in citric acid based antigen unmasking solution (Vector laboratories), washed with PBS 3 times (5 min each) and incubated with blocking solution containing 0.3% Triton X-100, 10% normal goat serum prepared in PBS for 1 hr at room temperature (RT). Sections were then incubated with primary antibodies against SNPH (1:250; Abcam), Synaptotagmin2 (1:250; Developmental Studies Hybridoma Bank) and Calbindin (1:250; BosterBio) overnight in PBS containing 0.3% Triton X-100 and 5% normal goat serum. Following day, sections were washed 5 times with PBS (5 min each) and incubated with Alexa Fluor-labeled secondary antibodies (1:250; Invitrogen) for 1 hr at RT. Sections were washed five times with PBS (5 min each) and mounted with UltraCruz Aqueous Mounting Medium (Santa Cruz Biotechnology). For antibody labeling in primary neurons, we fixed those coverslips containing neuronal cells with 4% PFA and 4% sucrose (Kang et al., 2008) in PBS for 20 min at RT followed by permeabilization with 0.3% triton-100 for 15 min and blocking in 10% serum for 1 hr at RT. The neurons were then incubated with primary antibody MAP-2 (1:500; Millipore), SNPH (1:500; Abcam) and PSD95 (1:200; NeuroMab) antibodies overnight at 4°C. Following day these coverslips were washed 3 times (5 min each) with PBS and incubated with fluorescently conjugated alexa flour secondary antibodies and mounted on glass slides using UltraCruz Aqueous Mounting Medium. Fluorescent images were acquired using a Nikon A1 confocal microscope with 60× (1.4 numerical aperture) plan apochromatic oil-immersion objectives at 1024X1024 resolutions. The optical thickness was set at 0.25 μm and 3-D volume scans (z series) images were collected from randomly selected fields. Optical settings were kept identical for all the experimental groups to ensure comparability between experimental groups. Image analysis was accomplished using Nikon Elements (Nikon, Melville, NY), NIH imageJ, Huygens (Scientific Volume Imaging) and Imaris (Bitplanes) softwares.
3D volume reconstruction
To quantify the SNPH intrusion in the dendritic volume of PCs, fluorescence images were first deconvolved using Huygens professional scientific volume imaging software and volumes were analyzed using Imaris software (Bitplane). For this analysis, we used thresholding to isolate the dendritic shaft and primary branches, while eliminating the secondary/tertiary dendritic branches, as these branches are robustly wrapped by presynaptic axons, making isolation of dendritic SNPH difficult. After intensity thresholding of Calbindin channel, the fluorescent signals of SNPH and Syt2 were measured within Calbindin masked volume.
EM immunogold labeling of SNPH
EM immunogold labeling of SNPH in cerebellar tissue sections were performed applying a monoclonal SNPH antibody (Abcam) using pre embedded technique. Briefly, mice were anesthetized and perfused transcardially with 4% paraformaldehyde and 0.05% glutaraldehyde solution as described in Lin et al. (2017). Cerebellum was taken out and post fixed in above fixative for additional 30 min at room temperature, washed 5 times with PBS (5 min each) and 50 μM thin sections were obtained using microtome (Leica VT100S; Leica Biosystem). These sections were permeabilize and blocked in 5% normal goat serum and 0.3% triton following the incubation in SNPH antibody overnight at room temperature in 5% goat serum and 0.1% triton. Following day the sections were washed with PBS 5 times (5 min each) and incubated with F(ab’) fragment of Goat-anti-Rabbit IgG (H&L) Ultra Small reagent (Aurion) for 2 hr at room temperature in 5% goat serum and 0.1% triton and washed 5 times (5 min each) with PBS before fixing in 2% glutaraldehyde solution overnight at 4°C. Following day sections were washed 5 times (5 min each) with distilled water, processed for silver enhancement (Aurion silver enhancing kit) for 2 hr, rinsed 5 time (5 min each) with distilled water, and 2 × 5 minutes in 0.1M Sorenson’s phosphate buffer. Following the buffer rinses, samples were postfixed in 0.5% osmium tetroxide for 0.5 hr, rinsed in distilled water, dehydrated in a graded ethanol series and embedded flat between glass slides in EMbed 812 (Electron Microscope Sciences). Finally, the area in tissue sections containing molecular, PC and granular layer were glued to blank epoxy cylinders and ultrathin sections were collected superficially (close to the surface) with a Leica UC6 Ultramicrotome. The sections were collected on 200 mesh copper grids and imaged with a Philips CM120 Transmission Electron Microscope. Images were collected with AMT Biosprint side mounted digital using AMT image capture software.
Mitochondrial membrane potential measurement
Mitochondrial membrane potential was measured with the potentiometric fluorescence dye TMRM, as described previously (Joshi and Bakowska, 2011a; Joshi et al., 2011)
Mitochondrial Ca2+measurements
To measure mitochondrial Ca2+ levels in neurons, we used genetically encoded Ca2+ sensors mito-GCaMP5G, a gift from Franck Polleux (Addgene plasmid # 105009) (Kwon et al., 2016). Mito-GCaMP5G Transfected neurons were washed three times with Tyrodes buffer (TB) containing (145 mM NaCl, 5 mM KCl, 10 mM glucose, 1.5 mM CaCl2, 1 mM MgCl2, 10 mM HEPES, pH 7.4) and imaged on the stage of confocal microscope (Nikon A1) using 488 nm/525 nm excitation/emission respectively. Baseline Mito-GCaMP5G fluorescence was captured for 50 s and NMDA was added to the bath solution for another 550 s. Change in Mito-GCaMP5G fluorescence before and after NMDA addition was calculated as ΔF = F−F0/F0 × 100, where F0 is the initial fluorescence intensity and F is the fluorescence intensity at any time point.
ATP/ADP ratio in Neurons
To measure ATP/ADP ratio, we used genetically encoded sensor GW1-PercevalHR (Tantama et al., 2013). PercivalHR has two different excitation peaks, ~420 nm and ~500 nm, which responds to ADP and ATP binding respectively. PercivalHR transfected neurons were washed with TB and live imaging was performed on confocal microscope (Olympus FV 510) using 440 nm and 488 nm laser excitation to detect ADP and ATP respectively. Static fluorescence images from multiple regions of coverslip were collected in X-Y planes focusing on neuronal soma, dendrites and axons. After imaging, ratiometric images (488/440 nm) were generated using NIH imageJ and fluorescence intensities were calculated from regions of interests (ROIs) in neuronal soma, dendrites and axons for quantification of ATP/ADP ratio in different genetic groups.
Mitochondria and other organelle motility analysis in primary neurons
Primary hippocampal neurons co-transfected with GFP variants and Mito-DsRed were washed three times with TB and incubated in TB at 37°C Tokai Hit microscope stage top Incubator and fluorescence images were acquired every 10 s for a total 5 min. To measure anterograde and retrograde mitochondrial traffic from dendrites and axons at the vicinity of soma, a rectangle frame (size 20–60 μm × 1.6 μm) is placed at axons or dendrites with the nearest side 10 μm from the soma. Indexes for retrograde and anterograde movement were calculated by the average number of mitochondria per unit length moving in the respective directions within the frame over a 5 min period. We quantitated the anterograde, retrograde and stationary mitochondria by generating kymographs using Image-J (NIH) as described in our previous work (Zhang et al., 2010). Note that there is only one axon per soma, but multiple dendrites feeding directly into one soma. In the latter case, a single movement index was assigned to each soma by averaging the results from multiple dendrites. To monitor the motility of lysosomes and late endosomes in neurons, we transfected neurons with GFP-LAMP1 and GFP-Rab7 plasmids. These neurons were co transfected with non-GFP SNPH and SNPH1–469 plasmids. Transfected neurons were washed with TB and placed in 37°C Tokai Hit microscope stage top Incubator and time lapse imaging from dendritic and axonal regions were captured every 5 s for total 5 min. Kymographs were generated in imageJ and anterograde/retrograde motility were quantified from kymographs.
Assessment of mitophagy in vitro and in vivo
To image spatial distribution of live mitophagy, we used a ratiometric fluorescence probe, mt-mKeima as described in Katayama et al. (2011); Sun et al. (2015), and Bingol et al. (2014). The mt-mKeima is a dual excitation ratiometric indicator which can be excited using 440 and 543 nm light with peak emission at 620 nm. When expressed into mitochondrial matrix, the Green signal (mKeima 440 nm) initially represents all mitochondria, but turns Red (mKeima 543 nm) when mitochondrion is engulfed by acidic lysosomes. Importantly, the Red signal accumulates and is resistance to proteases (Katayama et al., 2011; Bingol et al., 2014). The resultant Red signal thus produces an integral of mitophagy activity over time. The image map of the mt-mKeima ratio (543 nm/440 nm) gives regional variation of the fraction of mitochondria undergoing mitophagy at each neuronal compartment. Since this is a ratiometric probe, the results can be compared between neuron groups independent of transduction efficiency. In these experiments, we co-transfected hippocampal neurons with mKeima along with non-GFP SNPH and SNPH1–469 cloned in pcDNA3.1 vector. After each experiment, cells were fixed and stained for SNPH antibody to confirm the co-expression of SNPH in those mKeima transfected neurons before data analysis. Consistent with previous finding (Bingol et al., 2014) we observed mKeima Red fluorescence within the neuronal soma and proximal neurites. Since the mKeima Red fluorescence is suggested to be originated from lysosomally delivered mitochondria, we first confirmed that mKeima Red colocalizes with lysosomal marker lysotracker Deep Red (Figure 5B). We then quantitated the somal mitophagy index by calculating the ratio of area Red/Green fluorescence as described previously (Bingol et al., 2014) within the neuronal soma using NIH-imageJ software. Mitophagy in the neuronal groups were also measures using LC3. Neurons were co-transfected with GFP-LC3, Mito-DsRed, SNPH and SNPH1–469 plasmids. In these experiments, co-localization of LC3 with Mito-DsRed considered as mitophagy event. Since LC3 signal is transient as it degrades after fusion with lysosomes, we used the lysosomal inhibitors (LIs) Pepstatin A and E64D (10 μM each) (Cai et al., 2012) to capture the LC3-Mito-DsRed co-localization over time. The LC3-Mito-DsRed co-localized puncta were counted in each group and plotted as average co-localized puncta per cell. To assess mitophagy in vivo in PCs, we analyzed ultrathin EM sections in Shi and Shi-SNPH-KO mice from our previous study (Joshi et al., 2015) and counted the dense mitochondrial structure within the single or double membrane bound structures representing different stages of autophagy of mitochondria and termed them as mitophagosomes (Lu et al., 2018; Nguyen et al., 2016). These mitophagosomes structures were then normalized by average mitochondrial count per PC for each mouse.
Neuronal viability
Neuronal survival in NMDA stress experiments was quantitated using morphological criteria. Neurons grown on coverslips from 4 different genetic groups were treated with NMDA (10 μM) for 30 min in growth medium, washed three times with growth media, placed back in CO2 incubator and neuronal viability was determined after 24 hr (Joshi et al., 2011; Wang and Schwarz, 2009). A neuron with good neuritic arborization and distinct cell soma was considered as healthy while a neuron with fragmented neurites and cell soma was considered as dead (Joshi et al., 2011). We also confirmed this morphological criterion with PI assay which only stains dead cells (Jiajia et al., 2017; Ying et al., 2001).
QUANTIFICATION AND STATISTICAL ANALYSIS
Data are presented as the mean ± SEM. Statistical Differences in measured variables between the experimental and control groups were assessed using Student’s t test and p < 0.05 was considered as statistically significant.
DATA AND CODE AVAILABILITY
This study did not generate any unique datasets or code
Supplementary Material
KEY RESOURCES TABLE.
| REAGENT or RESOURCE | SOURCE | IDENTIFIER |
|---|---|---|
| Antibodies | ||
| Monoclonal Rabbit SNPH | Abcam | ab192605 |
| Polyclonal Calbindin | Boster | M03047–2 |
| Monoclonal Synaptotagmin2(znp-1) | DSHB Hybridoma | AB_2315626 |
| Polyclonal Map-2 | Millipore | AB5543 |
| PSD95 | NeuroMab | clone K28/43 |
| Alexa Fluor-Goat anti Rabbit | Thermofisher | A-11008 |
| Alexa Fluor-Goat anti Chicken | Thermofisher | A-11041 |
| Alexa Fluor-Goat anti Mouse | Thermofisher | A-11004 |
| Bacterial and Virus Strains | ||
| AAV-mito-mCherry | Addgene plasmid | Plasmid #55102 |
| pLV-Pcp2-EGFP-hSNPH | This paper | VectorBuilder Inc |
| pLV-Pcp2-EGFP-hSNPH-1–469 | This Papaer | VectorBuilder Inc |
| Chemicals, Peptides, and Recombinant Proteins | ||
| TMRM | Thermofisher | T668 |
| Lysotracker Deep Red | Thermofisher | L12492 |
| Propodeum Iodide | Sigma Aldrich | P4170 |
| Calcein | Thermofisher | C3099 |
| NMDA | Sigma Aldrich | M3262 |
| E64d | Tochris | 4545 |
| Pepstatin A | Dot Scientific Inc. | DSP30100–0.005 |
| HBSS | Hyclone, GE Healthcare | SH30588.01 |
| DMEM high glucose | Hyclone, GE Healthcare | SH30243.01 |
| Papain | Worthington Biochemical Corp. | LS003118 |
| DNase | Sigma Aldrich | DN25 |
| Glutamax | Thermofisher | 35050061 |
| Neurobasal | Thermofisher | 21103049 |
| Poly-D-Lysine | Sigma Aldrich | P6407 |
| B27 medium | Thermofisher | 17504044 |
| lipofectamine LTX | Thermofisher | A12621 |
| Cytosine β-D-arabinofuranoside | Sigma Aldrich | C1768 |
| Normal Goat Serum | Sigma Aldrich | G9023 |
| Paraformaldehyde | Sigma Aldrich | P6148 |
| Glutaraldehyde | Sigma Aldrich | G5882 |
| UltraCruz Aqueous Mounting Medium | Santa Cruz | sc-24941 |
| ProLong Diamond Antifade Mountant | Thermofisher | P36965 |
| F(ab’) fragment - Goat-anti-Rabbit IgG | Aurion | 800.166 |
| Silver enhancing kit | Aurion | 704.002 |
| Experimental Models: Organisms/Strains | ||
| Wt and Shiverer mice | Joshi et al., 2015 | Joshi et al., 2015 |
| SNPH-KO mice | Kang et al., 2008 | Kang et al., 2008 |
| Recombinant DNA | ||
| pcDNA3.1-hSNPH | Kang et al., 2008 | Kang et al., 2008 |
| pcDNA3.1-hSNPH1–469 | Kang et al., 2008 | Kang et al., 2008 |
| GFP-SNPH | Kang et al., 2008 | Kang et al., 2008 |
| GFP-SNPH1–469 | Kang et al., 2008 | Kang et al., 2008 |
| PercivalHR | Addgene plasmid | #49082 |
| mito-GCaMP5G | Addgene plasmid | #105009 |
| mKeima-Red-Mito-7 | Addgene plasmid | #56018 |
| Lamp1-msGFP | This paper | #JV012 |
| GFP-RAB7 | Addgene plasmid | #12605 |
| EGFP-LC3 | Addgene plasmid | #11546 |
| Mito-DsRed | Clontech laboratories Inc. | #632421 |
| Software and Algorithms | ||
| Nikon Elements | Nikon, Melville, NY | NA |
| NIH imageJ | NIH | NA |
| Huygens | Scientific Volume Imaging | NA |
| Imaris | Bitplanes | NA |
| Sigma plot | Systat Software Inc. | NA |
| Origin | OriginLab Corporation | NA |
Highlights.
Axonal mitochondrial anchor SNPH intrudes into dendrites of progressive MS model
Dendritic SNPH sensitizes neurons to excitotoxicity and reduces [Ca2+]mito uptake
Dendritic SNPH degrades mitochondrial quality by impeding somal mitophagy
Intercepting dendritic SNPH intrusion could be a therapeutic target in MS
ACKNOWLEDGMENTS
This study was supported by grants from the NIH (R21NS099971 and R01NS100924 to S.Y.C., R01NS099405–01 to T.M.G., NS098604 to J.D.V., and MH061876 and NS097362 to E.R.C.) and the Intramural Research Program of NINDS (NIH ZIA NS003029 and ZIA NS002946 to Z.-H.S.). S.Y.C. is also supported by NMSS grant RG 4891A9/1. E.R.C. is an Investigator of the Howard Hughes Medical Institute. We thank Dr. Tien-Min Lin for helping with plasmid preparation, Dr. Erik Dent for sharing DsRed2-mito (Mito-dsRed), Dr. Pankaj Dubey for sharing the GFP-Rab7 plasmids, and Lance Rodenkirch (UW optical imaging core) for fluorescence imaging support.
Footnotes
DECLARATION OF INTERESTS
The authors declare no competing interests.
SUPPLEMENTAL INFORMATION
Supplemental Information can be found online at https://doi.org/10.1016/j.celrep.2019.09.012.
REFERENCES
- Andrews H, White K, Thomson C, Edgar J, Bates D, Griffiths I, Turnbull D, and Nichols P (2006). Increased axonal mitochondrial activity as an adaptation to myelin deficiency in the Shiverer mouse. J. Neurosci. Res 83, 1533–1539. [DOI] [PubMed] [Google Scholar]
- Ashrafi G, Schlehe JS, LaVoie MJ, and Schwarz TL (2014). Mitophagy of damaged mitochondria occurs locally in distal neuronal axons and requires PINK1 and Parkin. J. Cell Biol 206, 655–670. [DOI] [PMC free article] [PubMed] [Google Scholar]
- Bading H (2017). Therapeutic targeting of the pathological triad of extra-synaptic NMDA receptor signaling in neurodegenerations. J. Exp. Med 214, 569–578. [DOI] [PMC free article] [PubMed] [Google Scholar]
- Beitz AJ, and Saxon D (2004). Harmaline-induced climbing fiber activation causes amino acid and peptide release in the rodent cerebellar cortex and a unique temporal pattern of Fos expression in the olivo-cerebellar pathway. J. Neurocytol 33, 49–74. [DOI] [PubMed] [Google Scholar]
- Bingol B, Tea JS, Phu L, Reichelt M, Bakalarski CE, Song Q, Foreman O, Kirkpatrick DS, and Sheng M (2014). The mitochondrial deubiquitinase USP30 opposes parkin-mediated mitophagy. Nature 510, 370–375. [DOI] [PubMed] [Google Scholar]
- Cai Q, Zakaria HM, Simone A, and Sheng ZH (2012). Spatial parkin translocation and degradation of damaged mitochondria via mitophagy in live cortical neurons. Curr. Biol 22, 545–552. [DOI] [PMC free article] [PubMed] [Google Scholar]
- Choi DW (1992). Excitotoxic cell death. J. Neurobiol 23, 1261–1276. [DOI] [PubMed] [Google Scholar]
- Choudhury A, Dominguez M, Puri V, Sharma DK, Narita K, Wheatley CL, Marks DL, and Pagano RE (2002). Rab proteins mediate Golgi transport of caveola-internalized glycosphingolipids and correct lipid trafficking in Niemann-Pick C cells. J. Clin. Invest 109, 1541–1550. [DOI] [PMC free article] [PubMed] [Google Scholar]
- de Montigny C, and Lamarre Y (1973). Rhythmic activity induced by harmaline in the olivo-cerebello-bulbar system of the cat. Brain Res. 53, 81–95. [DOI] [PubMed] [Google Scholar]
- Dusart I, and Sotelo C (1994). Lack of Purkinje cell loss in adult rat cerebellum following protracted axotomy: degenerative changes and regenerative attempts of the severed axons. J. Comp. Neurol 347, 211–232. [DOI] [PubMed] [Google Scholar]
- Goo MS, Sancho L, Slepak N, Boassa D, Deerinck TJ, Ellisman MH, Bloodgood BL, and Patrick GN (2017). Activity-dependent trafficking of lysosomes in dendrites and dendritic spines. J. Cell Biol 216, 2499–2513. [DOI] [PMC free article] [PubMed] [Google Scholar]
- Handforth A (2012). Harmaline tremor: underlying mechanisms in a potential animal model of essential tremor. Tremor Other Hyperkinet. Mov. (N. Y.) 2, 02–92–769–1. [DOI] [PMC free article] [PubMed] [Google Scholar]
- Huda F, Konno A, Matsuzaki Y, Goenawan H, Miyake K, Shimada T, and Hirai H (2014). Distinct transduction profiles in the CNS via three injection routes of AAV9 and the application to generation of a neurodegenerative mouse model. Mol. Ther. Methods Clin. Dev 1, 14032. [DOI] [PMC free article] [PubMed] [Google Scholar]
- Jackson WT, Giddings TH Jr., Taylor MP, Mulinyawe S, Rabinovitch M, Kopito RR, and Kirkegaard K (2005). Subversion of cellular autophagosomal machinery by RNA viruses. PLoS Biol. 3, e156. [DOI] [PMC free article] [PubMed] [Google Scholar]
- Jiajia L, Shinghung M, Jiacheng Z, Jialing W, Dilin X, Shengquan H, Zaijun Z, Qinwen W, Yifan H, and Wei C (2017). Assessment of Neuronal Viability Using Fluorescein Diacetate-Propidium Iodide Double Staining in Cerebellar Granule Neuron Culture. J. Vis. Exp Published online May 10, 2017 10.3791/55442. [DOI] [PMC free article] [PubMed] [Google Scholar]
- Joshi DC, and Bakowska JC (2011a). Determination of mitochondrial membrane potential and reactive oxygen species in live rat cortical neurons. J. Vis. Exp (51), 2704. [DOI] [PMC free article] [PubMed] [Google Scholar]
- Joshi DC, and Bakowska JC (2011b). SPG20 protein spartin associates with cardiolipin via its plant-related senescence domain and regulates mitochondrial Ca2+ homeostasis. PLoS ONE 6, e19290. [DOI] [PMC free article] [PubMed] [Google Scholar]
- Joshi DC, Singh M, Krishnamurthy K, Joshi PG, and Joshi NB (2011). AMPA induced Ca2+ influx in motor neurons occurs through voltage gated Ca2+ channel and Ca2+ permeable AMPA receptor. Neurochem. Int 59, 913–921. [DOI] [PubMed] [Google Scholar]
- Joshi DC, Zhang CL, Lin TM, Gusain A, Harris MG, Tree E, Yin Y, Wu C, Sheng ZH, Dempsey RJ, et al. (2015). Deletion of mitochondrial anchoring protects dysmyelinating Shiverer: implications for progressive MS. J. Neurosci 35, 5293–5306. [DOI] [PMC free article] [PubMed] [Google Scholar]
- Kaemmerer WF, Reddy RG, Warlick CA, Hartung SD, McIvor RS, and Low WC (2000). In vivo transduction of cerebellar Purkinje cells using adeno-associated virus vectors. Mol. Ther 2, 446–457. [DOI] [PubMed] [Google Scholar]
- Kang JS, Tian JH, Pan PY, Zald P, Li C, Deng C, and Sheng ZH (2008). Docking of axonal mitochondria by syntaphilin controls their mobility and affects short-term facilitation. Cell 132, 137–148. [DOI] [PMC free article] [PubMed] [Google Scholar]
- Katayama H, Kogure T, Mizushima N, Yoshimori T, and Miyawaki A (2011). A sensitive and quantitative technique for detecting autophagic events based on lysosomal delivery. Chem. Biol. 18, 1042–1052. [DOI] [PubMed] [Google Scholar]
- Kwon SK, Sando R 3rd, Lewis TL, Hirabayashi Y, Maximov A, and Polleux F (2016). LKB1 Regulates Mitochondria-Dependent Presynaptic Calcium Clearance and Neurotransmitter Release Properties at Excitatory Synapses along Cortical Axons. PLoS Biol. 14, e1002516. [DOI] [PMC free article] [PubMed] [Google Scholar]
- Li Z, Okamoto K, Hayashi Y, and Sheng M (2004). The importance of dendritic mitochondria in the morphogenesis and plasticity of spines and synapses. Cell 119, 873–887. [DOI] [PubMed] [Google Scholar]
- Lin MY, Cheng XT, Tammineni P, Xie Y, Zhou B, Cai Q, and Sheng ZH (2017). Releasing Syntaphilin Removes Stressed Mitochondria from Axons Independent of Mitophagy under Pathophysiological Conditions. Neuron 94, 595–610.e6. [DOI] [PMC free article] [PubMed] [Google Scholar]
- Llinás R, and Volkind RA (1973). The olivo-cerebellar system: functional properties as revealed by harmaline-induced tremor. Exp. Brain Res 18, 69–87. [DOI] [PubMed] [Google Scholar]
- Loers G, Aboul-Enein F, Bartsch U, Lassmann H, and Schachner M (2004). Comparison of myelin, axon, lipid, and immunopathology in the central nervous system of differentially myelin-compromised mutant mice: a morphological and biochemical study. Mol. Cell. Neurosci 27, 175–189. [DOI] [PubMed] [Google Scholar]
- Lu Y, Fujioka H, Joshi D, Li Q, Sangwung P, Hsieh P, Zhu J, Torio J, Sweet D, Wang L, et al. (2018). Mitophagy is required for brown adipose tissue mitochondrial homeostasis during cold challenge. Sci. Rep 8, 8251. [DOI] [PMC free article] [PubMed] [Google Scholar]
- Misgeld T, and Schwarz TL (2017). Mitostasis in Neurons: Maintaining Mitochondria in an Extended Cellular Architecture. Neuron 96, 651–666. [DOI] [PMC free article] [PubMed] [Google Scholar]
- Nguyen TN, Padman BS, Usher J, Oorschot V, Ramm G, and Lazarou M (2016). Atg8 family LC3/GABARAP proteins are crucial for autophagosomelysosome fusion but not autophagosome formation during PINK1/Parkin mitophagy and starvation. J. Cell Biol 215, 857–874. [DOI] [PMC free article] [PubMed] [Google Scholar]
- Nitta K, Matsuzaki Y, Konno A, and Hirai H (2017). Minimal Purkinje Cell-Specific PCP2/L7 Promoter Virally Available for Rodents and Non-human Primates. Mol. Ther. Methods Clin. Dev 6, 159–170. [DOI] [PMC free article] [PubMed] [Google Scholar]
- O’Hearn E, and Molliver ME (1993). Degeneration of Purkinje cells in parasagittal zones of the cerebellar vermis after treatment with ibogaine or harmaline. Neuroscience 55, 303–310. [DOI] [PubMed] [Google Scholar]
- O’Hearn E, and Molliver ME (1997). The olivocerebellar projection mediates ibogaine-induced degeneration of Purkinje cells: a model of indirect, transsynaptic excitotoxicity. J. Neurosci 17, 8828–8841. [DOI] [PMC free article] [PubMed] [Google Scholar]
- Overly CC, Rieff HI, and Hollenbeck PJ (1996). Organelle motility and metabolism in axons vs dendrites of cultured hippocampal neurons. J. Cell Sci 109, 971–980. [DOI] [PubMed] [Google Scholar]
- Sugihara I (2006). Organization and remodeling of the olivocerebellar climbing fiber projection. Cerebellum 5, 15–22. [DOI] [PubMed] [Google Scholar]
- Sun N, Yun J, Liu J, Malide D, Liu C, Rovira II, Holmström KM, Fergusson MM, Yoo YH, Combs CA, and Finkel T (2015). Measuring In Vivo Mitophagy. Mol. Cell 60, 685–696. [DOI] [PMC free article] [PubMed] [Google Scholar]
- Tantama M, Martínez-François JR, Mongeon R, and Yellen G (2013). Imaging energy status in live cells with a fluorescent biosensor of the intracellular ATP-to-ADP ratio. Nat. Commun 4, 2550. [DOI] [PMC free article] [PubMed] [Google Scholar]
- Wang X, and Schwarz TL (2009). The mechanism of Ca2+ -dependent regulation of kinesin-mediated mitochondrial motility. Cell 136, 163–174. [DOI] [PMC free article] [PubMed] [Google Scholar]
- Ward MW, Rego AC, Frenguelli BG, and Nicholls DG (2000). Mitochondrial membrane potential and glutamate excitotoxicity in cultured cerebellar granule cells. J. Neurosci 20, 7208–7219. [DOI] [PMC free article] [PubMed] [Google Scholar]
- Ying HS, Gottron FJ, and Choi DW (2001). Assessment of cell viability in primary neuronal cultures. Curr. Protoc. Neurosci Chapter 7, Unit 7.18. [DOI] [PubMed] [Google Scholar]
- Zhang CL, Ho PL, kintner DB, Sun D, and Chiu SY (2010). Activity-dependent regulation of mitochondrial motility by calcium and Na/K-ATPase at nodes of Ranvier of myelinated nerves. J. Neurosci 30, 3555–3566. [DOI] [PMC free article] [PubMed] [Google Scholar]
- Zhou B, Yu P, Lin MY, Sun T, Chen Y, and Sheng ZH (2016). Facilitation of axon regeneration by enhancing mitochondrial transport and rescuing energy deficits. J. Cell Biol 214, 103–119. [DOI] [PMC free article] [PubMed] [Google Scholar]
Associated Data
This section collects any data citations, data availability statements, or supplementary materials included in this article.
Supplementary Materials
Data Availability Statement
This study did not generate any unique datasets or code