Abstract
OBJECTIVES:
The primary aim of this study was to investigate the value of attenuation imaging (ATI), a novel ultrasound technique for detection of steatosis, by comparing the results to that obtained with controlled attenuation parameter (CAP) and by using MRI-derived proton density fat fraction (PDFF) as reference standard.
METHODS:
From March to November 2018, 114 consecutive adult subjects potentially at risk of steatosis and 15 healthy controls were enrolled. Each subject underwent ATI and CAP assessment on the same day. MRI-PDFF was performed within a week.
RESULTS:
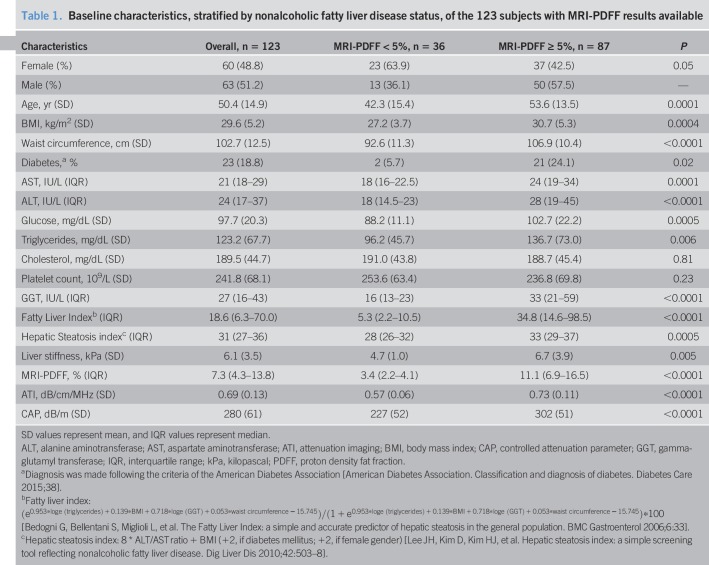
The prevalence of steatosis, as defined by MRI-PDFF ≥ 5%, was 70.7%. There was a high correlation of ATI with MRI-PDFF (r = 0.81, P < 0.0001). The correlation of CAP with MRI-PDFF and with ATI, respectively, was moderate (r = 0.65, P < 0.0001 and r = 0.61, P < 0.0001). The correlation of ATI or CAP with PDFF was not affected by age, gender, or body mass index. Area under the receiver operating characteristics of ATI and CAP, respectively, were 0.91 (0.84–0.95; P < 0.0001) and 0.85 (0.77–0.91; P < 0.0001) for detecting S > 0 steatosis (MRI-PDFF ≥ 5%); 0.95 (0.89–0.98; P < 0.0001) and 0.88 (0.81–0.93; P < 0.0001) for detecting S > 1 steatosis (MRI-PDFF ≥ 16.3%). The cutoffs of ATI and CAP, respectively, were 0.63 dB/cm/MHz and 258 dB/m for detecting S > 0 liver steatosis; 0.72 dB/cm/MHz and 304 dB/m for detecting S > 1 steatosis. ATI performed better than CAP, and this improvement was statistically significant for S > 1 (P = 0.04).
DISCUSSION:
This study shows that, in patients with no fibrosis/mild fibrosis, ATI is a very promising tool for the noninvasive assessment of steatosis.
INTRODUCTION
Nonalcoholic fatty liver disease (NAFLD) is the most common cause of chronic liver injury with an estimated annual economic burden considerable in both the United States and Europe (1). For the detection of fat in the liver in patients without any clinical suspect of liver inflammation, noninvasive methods are indicated. Conventional B-mode ultrasound (US) is the imaging modality most widely used. It gives a subjective estimate of the entity of fatty infiltration in the liver and has a low sensitivity for the detection of mild steatosis (2,3).
MRI-derived proton density fat fraction (PDFF) is a technique that accurately quantifies the hepatic fat content and has been accepted as an alternative to the histological assessment of liver steatosis in patients with NAFLD (4–8). MRI-PDFF is not influenced by confounding factors, including body weight, and is operator independent (4,9,10). However, it may have applicability limitations, and the availability and costs should be taken into account when used for screening purpose.
The controlled attenuation parameter (CAP) is a tool that noninvasively quantifies the amount of fat in the liver (11). The performance of the CAP in detecting and quantifying steatosis has been assessed in cohort of patients and in a meta-analysis with individual patient's data (12). A dedicated device, which does not allow the morphological assessment of the liver, is needed. Recently, techniques for the quantification of liver steatosis have been developed and implemented in the US systems.
The primary aim of this study was to investigate the diagnostic performance of a new US technique for the detection of liver steatosis in adult subjects by comparing the results to that obtained with the CAP and by using MRI-PDFF as the reference standard. The secondary aim was to assess the concordance of ATI and MRI-PDFF in grading liver steatosis.
METHODS
Design overview
This was a prospective study. From March to November 2018, consecutive adult subjects potentially at risk of liver steatosis, i.e., overweight or obese subjects and subjects with metabolic syndrome and/or diabetes who complied with the study protocol, were prospectively enrolled at the outpatient clinics of 3 centers in Pavia, Italy. Moreover, to obtain a reliable threshold for the detection of liver steatosis, healthy controls were enrolled as well. The patients were enrolled from the outpatient clinics of the department of medical sciences and infectious diseases, “Fondazione IRCCS Policlinico San Matteo”; the department of applied health sciences, “Azienda di Servizi alla Persona Santa Margherita”; the unit of internal medicine and endocrinology, “ICS Maugeri.” The healthy controls were hospital workers who were regularly followed with laboratory investigations. All of them had normal laboratory values and none of them had a history of liver disease or was using medication. All the enrolled subjects, including the healthy controls, had an alcohol intake less than 20 g/d.
Exclusion criteria were history of significant alcohol intake within 2 years of recruitment, secondary causes of liver steatosis, viral or autoimmune hepatitis, infection with human immunodeficiency virus, and genetic disorders. A total of 141 subjects were considered eligible for the study; of these, 129 participants complied with the study protocol.
All patients underwent clinical evaluation, anthropometric examination, and fasting biochemical tests. Each subject underwent B-mode US imaging together with the US quantification of liver steatosis, and CAP and stiffness assessment with the FibroScan system. All these studies were conducted on the same day. MRI-PDFF was performed within a week.
The examinations with the US and the FibroScan systems were performed at the department of medical sciences and infectious diseases, “Fondazione IRCCS Policlinico San Matteo,” by 2 expert operators (G.F. and L.M.) who were blinded to biochemical data and MRI-PDFF results. Each subject was studied by a single operator who performed first the US assessment of liver steatosis both in B-mode and with the attenuation imaging (ATI) technique of the US system, and thereafter the fat and stiffness assessment with the FibroScan. MRI-PDFF was performed at the radiology unit of “Fondazione IRCCS Policlinico San Matteo” by an expert radiologist (MVR) who was blinded to biochemical data and to the other imaging results.
The study protocol was approved by the Ethics Committee of Fondazione IRCCS Policlinico San Matteo (P-20170022247) and it conformed to the ethical guidelines of the 1975 Declaration of Helsinki. Informed written consent was obtained from all participants.
Attenuation imaging
ATI is an FDA approved technique, implemented in the Aplio i800 US system (Canon Medical Systems, formerly Toshiba Medical Systems, Otawara, Japan), which quantifies the US attenuation in the tissue within a large sample measurement and using a real-time color mapping. The raw data of the backscattered US signals are used for the quantification; thus, the measurement is not affected by the postprocessing of the acquired data or by the settings of the US system. ATI calculates the attenuation coefficient in decibel per centimeter per megahertz (dB/cm/MHz), filtering out vessels or strong artifacts. The region of interest (ROI) has a length of 100 mm, with an upper and lower width of 45 mm and 80 mm, respectively, covering around 70% of the B-mode image. The measurement box has a fixed size of 30 × 30 mm when placed in the middle of the image. In the ROI, the degree of attenuation of the US signal is color coded with light blue colors that are mixed with orange shades in case of high attenuation (see Figure, Supplemental Digital Content 1, http://links.lww.com/CTG/A95, which shows the color map of the ATI technique). By using the trackball of the US system, the operator can freely move both the ROI and the measurement box, choosing the area where to perform the measurement. A dark orange area, which usually appears in the upper edge of the ROI, or dark blue areas posterior to blood vessels were not included in the measurement box because they were deemed to be artefacts.
The ATI repeatability (in terms of both intraobserver and interobserver agreement) was assessed in a series of 30 subjects enrolled only for that purpose (13 males and 17 females; mean age, 48.4 [13.7] years; mean body mass index [BMI], 24.6 [4.8] kg/m2). Each subject was scanned by the 2 physicians who performed the examinations in random order. Each operator performed 2 sets of 5 ATI acquisitions in the same subject, 15 minutes apart. The 2 operators were unaware of each other results. The overall agreement was 0.94 (95% confidence interval, 0.90–0.97). The intraobserver agreement was 0.91 (0.84–0.97) for rater 1 and 0.98 (0.97–0.99) for rater 2. The interobserver agreement was 0.92 (0.86–0.97).
Examinations of both ATI and CAP were conducted following a fast of at least 6 hours. The acquisitions were obtained in the right lobe of the liver, through intercostal spaces and with the patient lying in the supine position. The median value of 5 consecutive measurements, together with the interquartile range (IQR), was used for statistical analyses. The entire examination with ATI lasted approximately 1 minute per patient.
CAP and stiffness assessment
CAP was obtained using the FibroScan 502 Touch system. The 3.5 MHz M probe was used when the skin to liver capsule distance, estimated with US, was ≤25 mm, otherwise the 2.5 MHz XL probe was used. The FibroScan estimates both liver stiffness in kiloPascal (kPa) and liver attenuation coefficient in decibel/meter (dB/m). The principles of CAP have been described elsewhere (11). The FibroScan computes CAP only when the associated liver stiffness measurement (LSM) is valid and it uses the same signal as the one used to measure liver stiffness. As recommended, only LSM with 10 validated measurements and an IQR/median (IQR/M) < 30% were considered reliable (13). There are no recommendations for successful CAP measurement.
MRI-derived proton density fat fraction
MRI was performed with a 1.5 T system (Magnetom Aera; Siemens Healthineers, Erlangen, Germany) using an 18-channel surface coil in combination with a 32-channel coil. For each examination, a noncontrast, complex-based gradient-echo 3D sequence, which provides whole-liver coverage, was obtained (4,14). It includes several features that compensate for confounding effects: low flip angle for reducing T1 effects, a multifat peak model for robust lipid estimation and multiple echo acquisitions for R2*/T2* estimation and correction (5,15–18). The single breath-hold sequence with 6 echoes was performed and provided volumetric PDFF. Digital Imaging and COmmunications in Medicine (DICOM) image files for MRI sequences were transferred to a secure local computer system.
The detection of liver steatosis (S > 0), significant steatosis (S > 1), and severe steatosis (S > 2) were defined by MRI-PDFF ≥5%, ≥16.3%, and ≥21.6%, respectively (5,19).
Statistical analysis
Power of the study and sample size estimation: A total sample size of 120 subjects (which includes 60 subjects with the disease) achieves 90% power to detect a change in sensitivity from 0.75 to 0.90 using a one-sided binomial test. The target significance level is 0.05 and the prevalence of the disease is 0.5.
Descriptive statistics were produced for demographic characteristics for this study sample of patients. The Shapiro–Wilk test was used to test the normal distribution of quantitative variables. When quantitative variables were normally distributed, the results were expressed as the mean value and SD, otherwise median and IQR (25th−75th percentile) were reported. Qualitative variables were summarized as counts and percentages. Univariate Pearson's r coefficient was used to test correlations between ATI and MRI-PDFF, CAP and MRI-PDFF, and ATI and CAP. The correlations were categorized as follows: 0.00 to 0.25 none or slight; 0.25 to 0.50 fair to moderate; 0.50 to 0.75 moderate to good; 0.75 to 1.00 almost perfect (20). Linear regression was used for multivariate models to assess the association between ATI or CAP and steatosis, age, gender, and BMI. The diagnostic performance of ATI or CAP was assessed by using receiver operating characteristic (ROC) curves and the area under the ROC (AUROC) curve analysis. The optimal threshold was determined using the Youden index to maximize sensitivity and specificity (21). Comparisons of the AUROCs were done using the method described by DeLong et al. (22) for correlated data. Concordance between ATI and MRI-PDFF in grading liver steatosis was assessed by means of Cohen kappa coefficient.
Data analysis was performed with STATA statistical package (release 15, 2017; Stata Corporation, College Station, TX) and MedCalc (MedCalc Statistical Software version 18.11) (MedCalc Software bvba, Ostend, Belgium).
The study was conducted and written according to the Standards for Reporting of Diagnostic Accuracy (STARD) initiative (23).
RESULTS
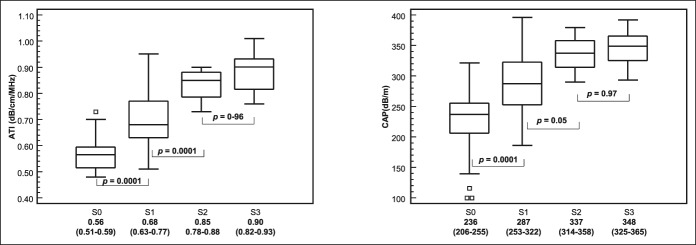
One hundred twenty-nine subjects (66 males and 63 females; mean age, 50.6 [15.3] years; mean BMI, 29.5 [5.2] kg/m2) were enrolled in the study. Of the 123 patients with MRI-PDFF results, 87 subjects (50 males and 37 females; mean age, 53.6 [13.5] years; mean BMI, 30.7 [5.3] kg/m2) had liver steatosis and 36 (13 males and 23 females; mean age, 42.3 [15.4] years; mean BMI, 27.2 [3.7] kg/m2) were without steatosis. The prevalence of liver steatosis was 70.7%. Fifteen subjects without steatosis (7 males and 8 females; mean age, 35.7 [11.2] years; mean BMI, 23.3 [1.7] kg/m2) were healthy controls. Four subjects did not undergo MRI-PDFF evaluation due to claustrophobia. In 2 healthy subjects, MRI-PDFF was not diagnostic for water/fat swapping. This artefact determines an abnormally high fat measurement (over 90%) and occur when there is a very low amount of fat in the liver (14). There was 1 failure with ATI measurement whereas none failure or unreliable result was observed with the FibroScan system. The flow diagram of the study is shown in Figure 1. CAP and LSMs were assessed with the M probe in 73 (56.6%) subjects and the XL in 56 (43.4%) subjects. The baseline characteristics of the study cohort are summarized in Table 1. Whereas 85.3% of subjects with MRI-PDFF ≥5% had a liver stiffness value up to 7 kPa, i.e., no fibrosis/mild fibrosis, only 13 subjects (9.3%) had stiffness values above 10 kPa, i.e., in the range of severe fibrosis. All ATI values were obtained with an IQR/M < 30%, and it was below 25% in 95% of cases. Figure 2 shows the median values of ATI and CAP for each steatosis grade as defined by MRI-PDFF.
Figure 1.
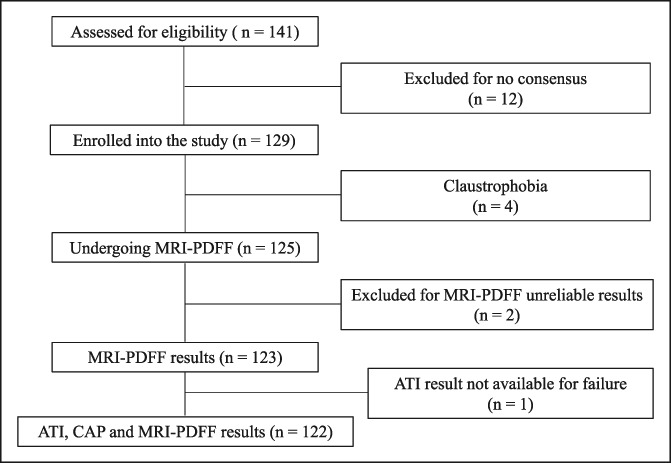
Flow chart of the study. CAP measurements: n = 125; ATI measurements: n = 124. ATI, attenuation imaging; CAP, controlled attenuation parameter; PDFF, proton density fat fraction.
Table 1.
Baseline characteristics, stratified by nonalcoholic fatty liver disease status, of the 123 subjects with MRI-PDFF results available
Figure 2.
MRI-PDFF steatosis grade: <5%: S0 (n = 36), 5%: S1 (n = 65), 16.3%: S2 (n = 8), 21.6%: S3 (n = 14). Median values and interquartile range (in parenthesis) for each fibrosis stage and P values of differences between consecutive grades are given. The central box represents values from the lower to upper quartile (25–75 percentile). The middle line represents the median. A line extends from the minimum to the maximum value (range), excluding “outside” values, which are displayed as separate points. The difference among steatosis grade was evaluated with one-way analysis of variance by ranks (Kruskal–Wallis test) adjusted with post hoc Bonferroni test. ATI, attenuation imaging; CAP, controlled attenuation parameter; CI, confidence interval; PDFF, proton density fat fraction.
Correlation analysis
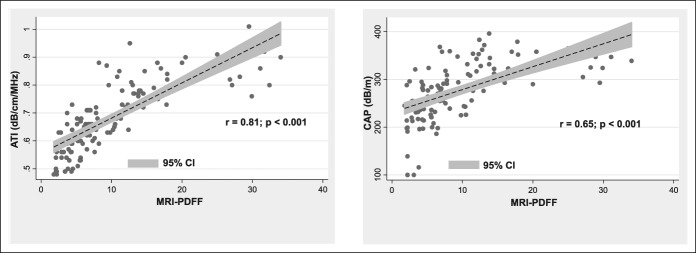
The univariate analysis showed a high correlation of ATI with MRI-PDFF (r = 0.81, P < 0.0001). The correlation of CAP with MRI-PDFF and with ATI, respectively, was moderate (r = 0.65, P < 0.0001; and r = 0.61, P < 0.0001) (Figure 3) (see Figure, Supplemental Digital Content 2, http://links.lww.com/CTG/A96, which shows the correlation of CAP with ATI). The correlation of ATI with MRI-PDFF was significantly higher than the correlation of CAP with MRI-PDFF (P = 0.007). In multivariate analysis, the correlation of ATI or CAP with MRI-PDFF was not affected by age, gender, BMI, liver stiffness, and skin-to-liver capsule distance (see Table, Supplemental Digital Content 3, http://links.lww.com/CTG/A97; see Table, Supplemental Digital Content 4, http://links.lww.com/CTG/A98 showing the results of the multivariate analysis).
Figure 3.
The scatter plots of the ATI and the CAP on the vertical axis vs MRI-PDFF values on the horizontal axis. ATI, attenuation imaging; CAP, controlled attenuation parameter; PDFF, proton density fat fraction.
Accuracy analysis
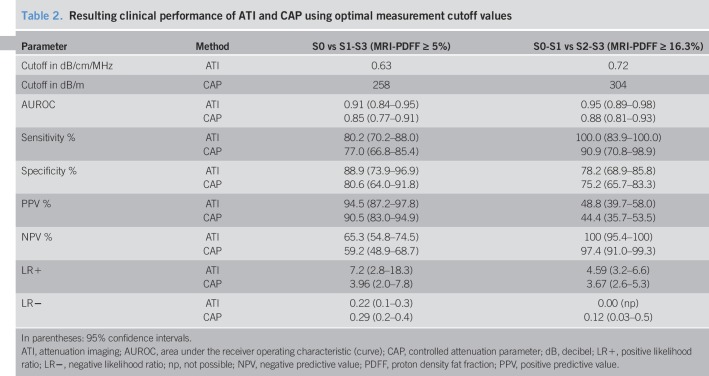
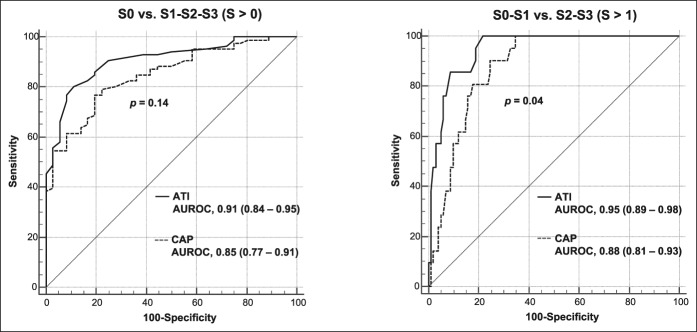
The AUROCs of ATI were 0.91 (0.84–0.95; P < 0.0001) at a cut point of 0.63 dB/cm/MHz for the detection of S > 0 liver steatosis and 0.95 (0.89–0.98; P < 0.0001) at a cut point of 0.72 dB/cm/MHz for the detection of S > 1 liver steatosis. A cutoff of 0.59 dB/cm/MHz ruled out liver steatosis (S > 0) with a sensitivity of 90.7% (82.5–95.9) whereas a cutoff of 0.70 dB/cm/MHz ruled in liver steatosis with a specificity of 97.2% (85.5–99.9). The AUROCs of CAP were 0.85 (0.77–0.91; P < 0.0001) at a cut point of 258 dB/m for the detection of S > 0 liver steatosis and 0.88 (0.81–0.93; P < 0.0001) dB/m at a cut point of 304 dB/m for the detection of S > 1 liver steatosis. The skin-to-liver capsule distance or the liver stiffness did not affect the performance of ATI.
The diagnostic performance of ATI and CAP is reported in Table 2. Because of the small number of patients in this pilot study, the accuracy of ATI or CAP for S0-S1-S2 vs S3 (S > 2) was not evaluated. Both ATI and CAP performed better at ruling-out than at ruling-in the disease.
Table 2.
Resulting clinical performance of ATI and CAP using optimal measurement cutoff values
Figure 4 shows the ROCs for S > 0 and S > 1 of the ATI and CAP techniques. For S > 1, a statistically significant improvement (P = 0.04) in the AUROC was observed for ATI (0.95) with respect to CAP (0.88), whereas the slight improvement in the AUROC of ATI for S > 0 was not significant (P = 0.14).
Figure 4.
Comparison of receiver operating characteristic curves for ATI and CAP for S0 vs S1-S3, as defined by MRI-PDFF ≥ 5%, and S0-S1 vs S2-S3, as defined by MRI-PDFF ≥ 16.3%. ATI, attenuation imaging; AUROC, area under the receiver operating characteristic (curve); CAP, controlled attenuation parameter; PDFF, proton density fat fraction.
Concordance of ATI and MRI-PDFF in grading liver steatosis
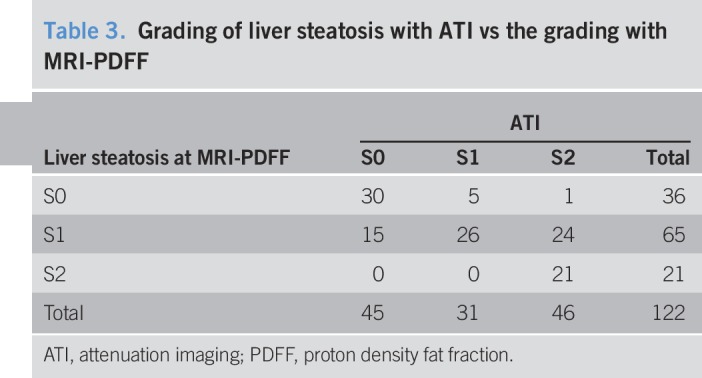
The agreement between the 2 techniques was 63.1% with a Cohen kappa coefficient of 0.47. Table 3 reports the number of misclassified cases.
Table 3.
Grading of liver steatosis with ATI vs the grading with MRI-PDFF
DISCUSSION
The results of this study show that ATI is more accurate than CAP for detecting and quantifying liver steatosis, and this difference is statistically significant for S > 1. CAP was the first US-based tool available for the quantification of liver steatosis, and it has become a point-of-care technique (12,24). Studies that have compared the performance of the CAP to that of MRI-PDFF have shown that this latter is significantly more accurate for the grading of liver steatosis (25–28).
The advantage of ATI is that it is implemented in an US system; thus, a morphological evaluation of the liver and the assessment of its biomechanical properties, i.e., liver stiffness, are possible together with the quantification of liver steatosis. This multiparametric approach can help reducing costs in the evaluation of patients with chronic liver disease. Using ATI, the attenuation is color coded; thus, it is possible to visualize areas of artefacts and avoid including them in the measurement box. These features may contribute to the better performance of ATI compared to CAP, and to a reproducibility of measurements higher than that reported with CAP (29,30).
A recent meta-analysis has proposed a cutoff of CAP for S > 0 that is slightly lower with respect to the one we found in our study, even though it was suggested to adjust it to several covariates (12). Analyzing the data using the cutoff proposed by the meta-analysis, i.e., 248 dB/m, or the cutoff proposed by Caussy et al. (19), i.e., 288 dB/m, there was an increase of misclassified cases (data not shown). On the other hand, the moderate agreement of the CAP with the reference standard did not allow a more detailed analysis. We observed an increase of the AUROC of the CAP when only the values with an IQR < 40 dB/m were analyzed; however, this criterion was fulfilled in less than 2 thirds of the cases (see Table, Supplemental Digital Content 5, http://links.lww.com/CTG/A99, which shows the results of the statistical analysis). This finding is in agreement with that of a recent study and may raise concerns on the applicability of the CAP technique in patients with NAFLD (19).
We have observed a higher repeatability of the ATI measurements with respect to that reported for the CAP, and this may be an advantage in longitudinal studies and for the follow-up of patients with NAFLD.
NAFLD is becoming a major health problem with a global estimated prevalence of 25.24% (1). It is associated with several metabolic comorbidities that are the risk factors for cardiovascular diseases and may progress to nonalcoholic steatohepatitis (NASH) (31). Thus, an early and accurate detection of liver steatosis is of outmost importance in this scenario. The results of this study show that ATI is a very valuable biomarker, showing an AUROC of 0.91 for the detection of liver steatosis. Currently, several treatments for NAFLD and NASH are in phase 3 trials and seem promising. A recent study has shown that significant steatosis is associated with fibrosis progression in patients with NAFLD (32). Therefore, an accurate noninvasive grading of steatosis is of great interest. MRI-PDFF is the accepted reference standard for the evaluation of liver steatosis. The advantages of using an US-based technique are the lower costs and the wider availability of the US systems. On this regard, ATI seems a very promising tool, showing an AUROC of 0.95 for the diagnosis of significant steatosis (S0-S1 vs S2-S3). However, the agreement between the grading of liver steatosis with ATI and with MRI-PDFF was only moderate. This is a pilot study in which consecutive patients were enrolled, thus an uneven distribution of different grade of liver steatosis was inevitable. In fact, in our series 65 of 123 (52.8%) patients had mild steatosis (S1). The relatively small number of patients in our series may also account for this finding. On the other hand, this new technique may need further improvement to amplify the range of values for better defining S > 1 steatosis.
Our cohort comprised patients at risk of liver steatosis; thus, it was not a well-defined series of patients with NAFLD/NASH. We also included healthy volunteers to obtain ATI cutoffs that could be applicable for screening purpose in a population at risk of steatosis. The selection bias is unavoidable, and it is even higher when only patients with a definitive diagnosis of NAFLD or NASH are studied. For screening purpose in a population at risk of NAFLD, our study shows that ATI seems a valid tool.
There are some limitations to this study. First, this was a single-center study; thus, the results may not be applicable to the general population. However, this was a pilot study aimed at assessing the diagnostic performance of a new US software for the quantification of liver steatosis. Second, liver biopsy was not performed. However, MRI-PDFF has become the reference standard for the quantification of fat in the liver, and there was not any clinical indication for liver biopsy in our series of patients. Third, our patients had none or little fibrosis; thus, we did not explore whether significant fibrosis can affect the accuracy of the technique. Fourth, the small number of individuals in this pilot study did not allow a correct analysis of the performance of ATI for S > 2. On this regard, further studies in large series are needed, because patients with severe steatosis are the most relevant clinically. Fifth, the study was conducted in a referral center and the examinations were conducted by expert operators, and this context could have led to better results. Finally, we should acknowledge that the ATI cutoffs were derived from a rather artificial setting and, therefore, they cannot easily be used for clinical purposes. Larger studies focusing on a real screening scenario are needed.
In conclusion, ATI seems a reliable and accurate tool for the assessment of liver steatosis. It performs better than CAP, and this improvement is statistically significant for S > 1. In our cohort, there was a high prevalence of no fibrosis/mild fibrosis; thus, further studies are needed to evaluate whether the accuracy of ATI in grading steatosis is affected by the stage of liver fibrosis.
CONFLICTS OF INTEREST
Guarantor of the article: Giovanna Ferraioli, MD.
Specific author contributions: G.F.: study concept and design, collected data, data review and analysis, interpretation of data, drafting of the manuscript. C.T.: data review and statistical analysis, interpretation of data, critical revision of the manuscript. All remaining authors: drafting of protocol, interpretation of data, critical revision of the manuscript.
Financial support: The present study did not receive any specific funding to declare.
Potential competing interests: G.F. has served as a speaker for Canon Medical Systems, Hitachi Ltd, Mindray Bio-Medical Electronics Co., Philips Healthcare. Carlo Filice has received unrestricted research funding from Canon Medical Systems, Esaote SpA, Hitachi Ltd, Mindray Bio-Medical Electronics Co. Fabrizio Calliada has served as speaker for Hitachi Ltd, Mindray Bio-Medical Electronics Co., Canon Medical Systems. All other authors do not have a conflict of interest to declare.
Study Highlights.
WHAT IS KNOWN
✓ In patients with NAFLD, noninvasive methods are used for assessing fat in the liver.
✓ CAP was the first US-based tool available for the quantification of liver steatosis.
✓ CAP has become a point-of-care technique.
✓ MRI-PDFF is a technique that accurately quantifies the hepatic fat content.
✓ MRI-PDFF is accepted as an alternative to the histological assessment of liver steatosis.
WHAT IS NEW HERE
✓ ATI is a novel technique, which is implemented in an US system.
✓ The correlation of ATI with MRI-PDFF was significantly higher than that of CAP.
✓ ATI was more accurate than CAP, and the improvement was statistically significant for S > 1.
TRANSLATIONAL IMPACT
✓ ATI is implemented in a US system; thus, a morphological evaluation of the liver and the assessment of its biomechanical properties, i.e., liver stiffness, are possible together with the quantification of liver steatosis.
ACKNOWLEDGEMENTS
The authors would like to thank Ms. Nadia Locatelli, Secretary of the Ultrasound Unit, for her valuable help in complying with the study protocol. Liver Steatosis Study Group: Clinical Sciences and Infectious Diseases Department, Fondazione IRCCS Policlinico S. Matteo, Medical School University of Pavia, Pavia, Italy: Elisabetta Above, MD; Raffaele Bruno, MD; Carolina Dellafiore, MD; Roberto Gulminetti, MD; Raffaella Lissandrin, MD; Andrea Lombardi, MD; Renato Maserati, MD; Giuseppe Michelone, MD; Mario Umberto Mondelli, MD; Stefano Novati, MD; Aldo Parisi, MD; Gianluigi Poma, MD; Paolo Sacchi, MD; Elena Seminari, MD; Domenico Zanaboni, MD. Department of Radiology, Fondazione IRCCS Policlinico S. Matteo, Medical School University of Pavia, Pavia, Italy: Giovanni Callea, MD; Benedetta Ciacchini, MD; Shaun Ivan Muzic, MD; Giovanni Savietto, MD; Domenico Vagni, MD.
Footnotes
SUPPLEMENTARY MATERIAL accompanies this paper at http://links.lww.com/CTG/A95, http://links.lww.com/CTG/A96, http://links.lww.com/CTG/A97, http://links.lww.com/CTG/A98, and http://links.lww.com/CTG/A99
Liver Steatosis Study Group: Clinical Sciences and Infectious Diseases Department, Fondazione IRCCS Policlinico S. Matteo, Medical School University of Pavia, Pavia, Italy: Elisabetta Above, MD; Raffaele Bruno, MD; Carolina Dellafiore, MD; Roberto Gulminetti, MD; Raffaella Lissandrin, MD; Andrea Lombardi, MD; Renato Maserati, MD; Giuseppe Michelone, MD; Mario Umberto Mondelli, MD; Stefano Novati, MD; Aldo Parisi, MD; Gianluigi Poma, MD; Paolo Sacchi, MD; Elena Seminari, MD; Domenico Zanaboni, MD. Department of Radiology, Fondazione IRCCS Policlinico S. Matteo, Medical School University of Pavia, Pavia, Italy: Giovanni Callea, MD; Benedetta Ciacchini, MD; Shaun Ivan Muzic, MD; Giovanni Savietto, MD; Domenico Vagni, MD.
REFERENCES
- 1.Younossi ZM, Blissett D, Blissett R, et al. The economic and clinical burden of nonalcoholic fatty liver disease in the United States and Europe. Hepatology 2016;64:1577–86. [DOI] [PubMed] [Google Scholar]
- 2.Dasarathy S, Dasarathy J, Khiyami A, et al. Validity of real time ultrasound in the diagnosis of hepatic steatosis: A prospective study. J Hepatol 2009;51:1061–7. [DOI] [PMC free article] [PubMed] [Google Scholar]
- 3.Saadeh S, Younossi ZM, Remer EM, et al. The utility of radiological imaging in nonalcoholic fatty liver disease. Gastroenterology 2002;123:745–50. [DOI] [PubMed] [Google Scholar]
- 4.Caussy C, Reeder SB, Sirlin CB, et al. Noninvasive, quantitative assessment of liver fat by MRI-PDFF as an endpoint in NASH trials. Hepatology 2018;68:763–72. [DOI] [PMC free article] [PubMed] [Google Scholar]
- 5.Middleton MS, Heba ER, Hooker CA, et al. Agreement between magnetic resonance imaging proton density fat fraction measurements and pathologist-assigned steatosis grades of liver biopsies from adults with nonalcoholic steatohepatitis. Gastroenterology 2017;153:753–61. [DOI] [PMC free article] [PubMed] [Google Scholar]
- 6.Noureddin M, Lam J, Peterson MR, et al. Utility of magnetic resonance imaging versus histology for quantifying changes in liver fat in nonalcoholic fatty liver disease trials. Hepatology 2013;58:1930–40. [DOI] [PMC free article] [PubMed] [Google Scholar]
- 7.Permutt Z, Le TA, Peterson MR, et al. Correlation between liver histology and novel magnetic resonance imaging in adult patients with non-alcoholic fatty liver disease—MRI accurately quantifies hepatic steatosis in NAFLD. Aliment Pharmacol Ther 2012;36:22–9. [DOI] [PMC free article] [PubMed] [Google Scholar]
- 8.Reeder SB, Hu HH, Sirlin CB. Proton density fat-fraction: A standardized MR-based biomarker of tissue fat concentration. J Magn Reson Imaging 2012;36:1011–4. [DOI] [PMC free article] [PubMed] [Google Scholar]
- 9.Negrete LM, Middleton MS, Clark L, et al. Inter-examination precision of magnitude-based MRI for estimation of segmental hepatic proton density fat fraction in obese subjects. J Magn Reson Imaging 2014;39:1265–71. [DOI] [PMC free article] [PubMed] [Google Scholar]
- 10.Kang GH, Cruite I, Shiehmorteza M, et al. Reproducibility of MRI determined proton density fat fraction across two different MR scanner platforms. J Magn Reson Imaging 2011;34:928–34. [DOI] [PMC free article] [PubMed] [Google Scholar]
- 11.Sasso M, Beaugrand M, de Ledinghen V, et al. Controlled attenuation parameter (CAP): A novel VCTE guided ultrasonic attenuation measurement for the evaluation of hepatic steatosis: Preliminary study and validation in a cohort of patients with chronic liver disease from various causes. Ultrasound Med Biol 2010;36:1825–35. [DOI] [PubMed] [Google Scholar]
- 12.Karlas T, Petroff D, Sasso M, et al. Individual patient data meta-analysis of controlled attenuation parameter (CAP) technology for assessing steatosis. J Hepatol 2017;66:1022–30. [DOI] [PubMed] [Google Scholar]
- 13.Dietrich CF, Bamber J, Berzigotti A, et al. EFSUMB guidelines and recommendations on the clinical use of liver ultrasound elastography, update 2017 (short version). Ultraschall Med 2017;38:377–94. [DOI] [PubMed] [Google Scholar]
- 14.Hetterich H, Bayerl C, Peters A, et al. Feasibility of a three-step magnetic resonance imaging approach for the assessment of hepatic steatosis in an asymptomatic study population. Eur Radiol 2016;26:1895–904. [DOI] [PubMed] [Google Scholar]
- 15.Yokoo T, Bydder M, Hamilton G, et al. Nonalcoholic fatty liver disease: Diagnostic and fat-grading accuracy of low-flip-angle multiecho gradient-recalled-echo MR imaging at 1.5 T. Radiology 2009;251:67–76. [DOI] [PMC free article] [PubMed] [Google Scholar]
- 16.Meisamy S, Hines CD, Hamilton G, et al. Quantification of hepatic steatosis with T1-independent, T2-corrected MR imaging with spectral modeling of fat: Blinded comparison with MR spectroscopy. Radiology 2011;258:767–75. [DOI] [PMC free article] [PubMed] [Google Scholar]
- 17.Zhong X, Nickel MD, Kannengiesser SA, et al. Liver fat quantification using a multi-step adaptive fitting approach with multi-echo GRE imaging. Magn Reson Med 2014;72:1353–65. [DOI] [PubMed] [Google Scholar]
- 18.Bashir MR, Dale BM, Merkle EM, et al. Automated liver sampling using a gradient dual-echo dixon-based technique. Magn Reson Med 2012;67:1469–77. [DOI] [PubMed] [Google Scholar]
- 19.Caussy C, Alquiraish MH, Nguyen P, et al. Optimal threshold of controlled attenuation parameter with MRI-PDFF as the gold standard for the detection of hepatic steatosis. Hepatology 2018;67:1348–59. [DOI] [PMC free article] [PubMed] [Google Scholar]
- 20.Colton T. (ed). Statistics in Medicine. Little, Brown and Company: Boston, MA, 1974. [Google Scholar]
- 21.Youden WJ. Index for rating diagnostic tests. Cancer 1950;3:32–5. [DOI] [PubMed] [Google Scholar]
- 22.DeLong ER, DeLong DM, Clarke-Pearson DL. Comparing the areas under two or more correlated receiver operating characteristic curves: A nonparametric approach. Biometrics 1988;44:837–45. [PubMed] [Google Scholar]
- 23.Bossuyt PM, Reitsma JB, Bruns DE, et al. Towards complete and accurate reporting of studies of diagnostic accuracy: The STARD initiative. Standards for Reporting of Diagnostic Accuracy. Clin Chem 2003;49:1–6. [DOI] [PubMed] [Google Scholar]
- 24.Ferraioli G, Wong VW, Castera L, et al. Liver ultrasound elastography: An update to the world federation for ultrasound in medicine and biology guidelines and recommendations. Ultrasound Med Biol 2018;44:2419–40. [DOI] [PubMed] [Google Scholar]
- 25.Imajo K, Kessoku T, Honda Y, et al. Magnetic resonance imaging more accurately classifies steatosis and fibrosis in patients with nonalcoholic fatty liver disease than transient elastography. Gastroenterology 2016;150:626–37. [DOI] [PubMed] [Google Scholar]
- 26.Runge JH, Smits LP, Verheij J, et al. MR spectroscopy-derived proton density fat fraction is superior to controlled attenuation parameter for detecting and grading hepatic steatosis. Radiology 2018;286:547–56. [DOI] [PubMed] [Google Scholar]
- 27.Park CC, Nguyen P, Hernandez C, et al. Magnetic resonance elastography vs transient elastography in detection of fibrosis and noninvasive measurement of steatosis in patients with biopsy-proven nonalcoholic fatty liver disease. Gastroenterology 2017;152:598–607. [DOI] [PMC free article] [PubMed] [Google Scholar]
- 28.Price JC, Dodge JL, Ma Y, et al. Controlled attenuation parameter and magnetic resonance spectroscopy-measured liver steatosis are discordant in obese HIV-infected adults. AIDS 2017;31:2119–25. [DOI] [PMC free article] [PubMed] [Google Scholar]
- 29.Recio E, Cifuentes C, Macías J, et al. Interobserver concordance in controlled attenuation parameter measurement, a novel tool for the assessment of hepatic steatosis on the basis of transient elastography. Eur J Gastroenterol Hepatol 2013;25:905–11. [DOI] [PubMed] [Google Scholar]
- 30.Ferraioli G, Tinelli C, Lissandrin R, et al. Interobserver reproducibility of the controlled attenuation parameter (CAP) for quantifying liver steatosis. Hepatol Int 2014;8:576–81. [DOI] [PubMed] [Google Scholar]
- 31.Arulanandan A, Ang B, Bettencourt R, et al. Association between quantity of liver fat and cardiovascular risk in patients with nonalcoholic fatty liver disease independent of nonalcoholic steatohepatitis. Clin Gastroenterol Hepatol 2015;13:1513–20. [DOI] [PubMed] [Google Scholar]
- 32.Ajmera V, Park CC, Caussy C, et al. Magnetic resonance imaging proton density fat fraction associates with progression of fibrosis in patients with nonalcoholic fatty liver disease. Gastroenterology 2018;155:307–10. [DOI] [PMC free article] [PubMed] [Google Scholar]


