Abstract
New Findings
-
•
What is the central question of this study?
We hypothesized that central inflammatory processes that involve activation of microglia and astrocytes contribute to the development of Gαi2 protein‐dependent, salt‐sensitive hypertension.
-
•
What is the main finding and its importance?
The main finding is that PVN‐specific inflammatory processes, driven by microglial activation, appear to be linked to the development of Gαi2 protein‐dependent, salt‐sensitive hypertension in Sprague–Dawley rats. This finding might reveal new mechanistic targets in the treatment of hypertension.
Abstract
The central mechanisms underlying salt‐sensitive hypertension, a significant public health issue, remain to be established. Researchers in our laboratory have reported that hypothalamic paraventricular nucleus (PVN) Gαi2 proteins mediate the sympathoinhibitory and normotensive responses to high sodium intake in salt‐resistant rats. Given the recent evidence of central inflammation in animal models of hypertension, we hypothesized that PVN inflammation contributes to Gαi2 protein‐dependent, salt‐sensitive hypertension. Male Sprague–Dawley rats received chronic intracerebroventricular infusions of a targeted Gαi2 or control scrambled oligodeoxynucleotide (ODN) and were maintained for 7 days on a normal‐salt (NS; 0.6% NaCl) or high‐salt (HS; 4% NaCl) diet; in subgroups on HS, intracerebroventricular minocycline (microglial inhibitor) was co‐infused with ODNs. Radiotelemetry was used in subgroups of rats to measure mean arterial pressure (MAP) chronically. In a separate group of rats, plasma noradrenaline, plasma renin activity, urinary angiotensinogen and mRNA levels of the PVN pro‐inflammatory cytokines TNFα, IL‐1β and IL‐6 and the anti‐inflammatory cytokine IL‐10 were assessed. In additional groups, immunohistochemistry was performed for markers of PVN and subfornical organ microglial activation and cytokine levels and PVN astrocyte activation. High salt intake evoked salt‐sensitive hypertension, increased plasma noradrenaline, PVN pro‐inflammatory cytokine mRNA upregulation, anti‐inflammatory cytokine mRNA downregulation and PVN‐specific microglial activation in rats receiving a targeted Gαi2 but not scrambled ODN. Minocycline co‐infusion significantly attenuated the increase in MAP and abolished the increase in plasma noradrenaline and inflammation in Gαi2 ODN‐infused animals on HS. Our data suggest that central Gαi2 protein prevents microglial‐mediated PVN inflammation and the development of salt‐sensitive hypertension.
Keywords: Gαi2 protein, neuroinflammation, salt‐sensitive hypertension
1. INTRODUCTION
Hypertension is one of the most significant public health issues in the USA; according to 2017 American Heart Association guidelines, it is estimated that one in two people are hypertensive (Reboussin et al., 2018). Furthermore, hypertension is the leading cause of chronic kidney disease, stroke and ischaemic heart disease (Lloyd‐Jones et al., 2010; Mozaffarian et al., 2016). Excess dietary sodium intake, which can drive the salt sensitivity of blood pressure and increase the risk of developing hypertension, is of great public health significance, because the average American is consuming almost three times the daily sodium intake recommended by the American Heart Association (Lloyd‐Jones et al., 2010).
Researchers in our laboratory have previously shown that in salt‐resistant animals, upregulation of the G‐protein‐coupled receptor α‐i2 subunit (Gαi2) protein in the paraventricular nucleus (PVN) of the hypothalamus of salt‐resistant rats mediates high dietary sodium‐evoked sympathoinhibitory responses to facilitate normotension and the maintenance of salt resistance (Kapusta, Pascale, Kuwabara, & Wainford, 2013; Wainford, Carmichael, Pascale, & Kuwabara, 2015). In contrast, hypertensive Dahl salt‐sensitive (DSS) rats fail to upregulate PVN Gαi2 proteins in response to high dietary sodium intake (Wainford et al., 2015). Restoration of the upregulation of Gαi2 proteins in the DSS rat via the use of the 8‐congenic rat line attenuated the magnitude of DSS hypertension (Wainford et al., 2015). Thus, PVN Gαi2 upregulation in response to high dietary sodium intake is crucial for the maintenance of salt resistance.
Several recent studies have suggested that central inflammatory processes contribute to the development of hypertension, and include the upregulation of pro‐inflammatory cytokines (PICs) such as tumour necrosis factor‐α (TNFα), interleukin (IL)‐6 and IL‐1β (Jiang et al., 2018; Shi et al., 2010, 2011). Furthermore, these processes have been shown to feature downregulation of the anti‐inflammatory cytokine IL‐10 (Segiet, Smykiewicz, Kwiatkowski, & Zera, 2019). Inflammatory processes have also been demonstrated to mediate neuronal excitability and even influence the firing rates of neurons, potentially disrupting neural homeostasis (Galic, Riazi, & Pittman, 2012; Shi et al., 2011). Glial cells, including microglia and astrocytes, can become activated in response to a pathological stimulus and have been demonstrated to produce inflammatory cytokines and reactive oxygen species and to disrupt neural homeostasis (Biancardi, Stranahan, Krause, de Kloet, & Stern, 2016; Wolf, Boddeke, & Kettenmann, 2017). Therefore, we hypothesized that central inflammatory processes, involving activation of microglia and astrocytes, contribute to the development of Gαi2 protein‐dependent, salt‐sensitive hypertension. To test this hypothesis, we used a male Sprague–Dawley rat model infused centrally with either a scrambled (SCR) control oligodeoxynucleotide (ODN) or targeted Gαi2 ODN alone or in combination with centrally administered minocycline, during a challenge with either a normal‐ or high‐salt diet. In these animals, we assessed many markers of central inflammation via mRNA and immunohistochemical approaches.
2. METHODS
2.1. Ethical approval
All animal protocols were approved by the Institutional Animal Care and Use Committee under protocol number AN15241, in accordance with the guidelines of the Boston University School of Medicine and the US National Institutes of Health Guide for the Care and Use of Laboratory Animals, 8th edition (2011). Please note that all possible steps were taken to minimize pain and suffering, and euthanasia was conducted in accordance with approved protocols. We used decapitation in a small, clearly defined subset of animals, in which we were measuring basal concentrations of plasma noradrenaline, which are suppressed by the administration of sedatives and anaesthetics. Our studies comply fully with the ethical principles and animal ethics checklist of Experimental Physiology.
2.2. Animals
Male Sprague–Dawley rats weighing 275–300 g were purchased from Envigo (Indianapolis, IN, USA). Rats were pair‐housed before surgical intervention and housed separately after survival surgery, as described below. Animals were housed in a facility with controlled temperature (range 20–26°C) and humidity (range 30–70%) under a 12 h–12 h light–dark cycle and were allowed tap water and standard irradiated rodent diet [Envigo Teklad, WI, Teklad Global Diet #2918: 18% protein, 5% crude fat, 5% fibre, with a total NaCl content of 0.6% (174 mequiv Na+ kg−1)] or experimental high‐sodium diet [Envigo Teklad Diets, WI, TD.03095: 19% protein, 5% crude fat, 3% fibre, with a total NaCl content of 4% [678 mequiv Na+ kg−1)] ad libitum. Rats were randomly assigned to experimental groups.
2.3. Surgical procedures
2.3.1. Chronic blood pressure measurement
A radiotelemetry device (PA‐C40; Data Sciences International, New Brighton, MN, USA) was implanted into the abdominal aorta via the left femoral artery under general anaesthesia (ketamine, Zoetis, Inc., Kalamazoo, MI, USA, 30 mg kg−1 i.p.; xylazine, Akorn, Inc., Lake Forest, IL, USA, 3 mg kg−1 i.p.). In these studies, animals received buprenorphine (Reckitt Benckiser Pharmaceuticals, Richmond, VA, USA) for 48 h after radiotelemetry probe implantation (0.05 mg kg−1 s.c.). In all cases, radiotelemety probes were implanted 5 days before intracerebroventricular (i.c.v.) osmotic mini pump implantation. Radiotelemetry data were collected, stored and analysed using Dataquest A.R.T. v.4.2 software (Data Sciences International, St. Paul, MN, USA) (Brouwers, Smolders, Wainford, & Dupont, 2015; Frame, Carmichael, Kuwabara, Cunningham, & Wainford, 2019; Wainford et al., 2015).
2.3.2. Intracerebroventricular oligodeoxynucleotide infusion
Chronic downregulation of brain Gαi2 proteins was achieved by continuous i.c.v. infusion of a phosphodiesterase ODN probe that selectively and specifically targets Gαi2 proteins (5′‐CTTGTCGATCATCTTAGA‐3′). Control animals received an i.c.v. infusion of a SCR ODN (5′‐GGGCGAAGTAGGTCTTGG‐3′). In these studies, SCR and Gαi2 ODNs were dissolved in isotonic saline and infused i.c.v. at 25 µg (5 µl)−1 day−1, a technique previously reported by researchers in our laboratory selectively to downregulate Gαi2 subunit proteins throughout the brain of conscious Sprague–Dawley rats (Kapusta et al., 2013; Kapusta, Pascale, & Wainford, 2012; Wainford et al., 2015). Several publications from our laboratory have confirmed effective (∼85%) ODN‐mediated downregulation of Gαi2 protein expression after chronic i.c.v. ODN infusion as assessed by western blotting (Kapusta et al., 2013; Wainford et al., 2015).
To achieve i.c.v. ODN infusion, animals were anaesthetized (ketamine, 30 mg kg−1 i.p. in combination with xylazine, 3 mg kg−1 i.p.) and implanted stereotaxically with a stainless‐steel cannula into the right lateral cerebral ventricle (Plastics One Inc., Roanoke, VA, USA), which was connected via Silastic tubing to a osmotic minipump (model 2004; Durect Corporation, Cupertino, CA, USA). A National Center for Biotechnology Information (NCBI) Basic Local Alignment Search Tool (BLAST) search of the Rattus norvegicus Reference Sequence (RefSeq) protein database was conducted to confirm: (i) the specificity of the Gαi2 ODN for the Gαi2 rat protein sequence; and (ii) that the SCR ODN does not match any known rat protein sequence. In addition, our prior studies (Kapusta et al., 2012, 2013; Wainford et al., 2015) and the studies from other laboratories examining the effects of opioid analgesia and opioid‐induced feeding (Hadjimarkou, Silva, Rossi, Pasternak, & Bodnar, 2002; Rossi, Standifer, & Pasternak, 1995; Silva et al., 2000; Standifer, Rossi, & Pasternak, 1996) have demonstrated the selectivity and specificity of this Gαi2 ODN sequence in the downregulation of brain Gαi2 proteins in rats.
2.3.3. Intracerebroventricular minocycline and oligodeoxynucleotide co‐infusion
Chronic downregulation of brain Gαi2 proteins during microglial inhibition was achieved by continuous i.c.v. infusion of an ODN probe that targets Gαi2 proteins, as described above, in combination with i.c.v. minocycline infusion. In these studies, SCR and Gαi2 ODNs were dissolved in isotonic saline and infused i.c.v. at 25 µg (5 µl)−1 day−1 in combination with minocycline at a rate of 25 µg (5 µl)−1 day−1 (Shi et al., 2010).
2.4. Experimental approaches
2.4.1. Dietary sodium intake
After i.c.v. osmotic minipump implantation, animals were randomly assigned to a normal‐salt (0.6% NaCl) or high‐salt (4% NaCl) diet for a period of 7 days. At the end of the 7 day experimental period, animals were either killed by conscious decapitation or received ketamine anaesthesia (ketamine, 30 mg kg−1 i.p.) before undergoing cardiac perfusion.
2.4.2. Chronic blood pressure measurement
In certain studies, radiotelemetry was used for the chronic measurement of blood pressure. Data were collected via scheduled sampling for 10 s every 10 min in all groups of rats. Rats were maintained on a normal‐salt diet (0.6% NaCl) for a 5 day baseline period and were then randomly assigned (n = 6 per group) to either a normal‐salt (0.6% total NaCl) or high‐salt (4% total NaCl) diet, and blood pressure was recorded for a further 7 days.
2.4.3. Plasma renin activity, urinary angiotensinogen and noradrenaline assays
Plasma renin activity (PRA), urinary angiotensinogen and plasma noradrenaline (NA) concentrations were determined as previously described (Kapusta et al., 2012; Wainford et al., 2015). In brief, after plasma extraction, from blood samples obtained after conscious decapitation, samples were frozen at −80°C until later analysis. For the PRA assay, samples were analysed using a plasma renin activity enzyme‐linked immunosorbent assay (ELISA) kit (DB52011; Tecan, Mannerdorf, Switzerland) for the quantitative determination of PRA by the immunoassay of generated angiotensin I, according to the manufacturer's instructions. Plasma NA concentrations were quantified using an ELISA kit (IB89552; Immuno‐Biological Laboratories, Inc., Minneapolis, MN, USA) according to the manufacturer's instructions. For the urinary angiotensinogen assay, urine samples were obtained from a 4 h urine collection period (09.00–13.00 h) in individual metabolic cages, during which time the animals had free access to food and water. These samples were analysed by ELISA (IB27412, Immuno‐Biological Laboratories, Inc.) according to the manufacturer's instructions.
2.4.4. Cytokine mRNA studies
On day 7, a subset of animals (n = 6 per group) was sacrificed via conscious decapitation and whole blood was collected for analysis. Fresh frozen brains were harvested, and a tissue punching tool was used to take bilateral PVN punches (Kapusta et al., 2012, 2013). Total RNA was isolated using RNeasy kits (Qiagen) according to the manufacturer's instructions, and 200 ng of purified RNA was reverse transcribed with a high‐capacity complementary DNA reverse transcription kit (Qiagen, Hilden, Germany). The IL‐1β, IL‐6, TNFα and IL‐10 mRNA levels were analysed by quantitative real‐time PCR using specific primers and probes in a PRISM 7000 sequence detection system (Applied Biosystems, Bedford, MA, USA) (Shi et al., 2010). Data were normalized to 18S ribosomal RNA, and the 2−ΔΔ CT method was used to calculate relative changes in gene expression (Zuriaga et al., 2017).
2.4.5. Measurement of brain Gαi2 protein levels
After completion of experimental protocols, the rats were killed via conscious decapitation, and whole brains were removed from subsets of animals co‐infused with both SCR and Gαi2 ODN–minocycline, and frozen at −80°C. Paraventricular nucleus samples were extracted from frozen brains cut on a cryostat using a brain punch tool (Stoelting Co., Wood Dale, IL, USA) as previously described (Kapusta et al., 2012; Wainford et al., 2015; Wainford, Pascale, & Kuwabara, 2013). Tissue lysates were prepared and protein levels quantified using the BCA assay according to the manufacturer's instructions (Thermo Scientific, Waltham, MA, USA). Lysates were resolved on a 10% SDS–PAGE gel and transferred to nitrocellulose membrane (catalogue no. 456‐1033; Bio‐Rad, Hercules, CA, USA). Gαi2 levels were determined as previously published by our laboratory (Kapusta et al., 2012; Wainford et al., 2015) using commercially available antibodies purchased from Santa Cruz Biotechnologies (Santa Cruz, CA, USA), directed against Gαi2 (Santa Cruz Biotechnology catalogue no. sc‐13534, 1:200, RRID:AB_627644); protein levels were normalized to total protein via Coomassie Blue‐stained gels. Chemiluminescent immunoreactive bands were detected by a horseradish peroxidase‐conjugated secondary antibody; data were imaged and semi‐quantified using Bio‐Rad Quantity One image analysis software.
2.4.6. Immunohistochemistry
Brain tissue from transcardially perfused animals was post‐fixed for 24 h in 4% paraformaldehyde and then for 72 h in 30% sucrose before being sliced on a cryostat. Slices 40 µm thick were obtained, and immunohistochemistry was performed in six‐well plates. Slices of the PVN were selected based on coordinates from Paxinos & Watson The Rat Brain atlas (Paxinos & Watson, 2007), being between bregma −1.6 and −2.16 mm. Slices were taken caudal to the interventricular foramen and rostral to the CA1 region of the hippocampus. Slices were washed in 0.1 m PBS, incubated in 1% hydrogen peroxide to block endogenous peroxidase, blocked with 3% horse serum and primary antibodies against rat OX‐42 (BD Biosciences catalogue no. 550299, RRID:AB_393594, 1:60, East Rutherford, NJ, USA) were used to stain for microglia and against rat GFAP (Abcam catalogue no. ab53554, RRID:AB_880202, 1:60, Cambridge, MA, USA) to stain for astrocytes. Secondary antibodies used were biotinylated goat anti‐mouse IgG (Vector Laboratories catalogue no. BA‐9200, RRID:AB_2336171, 1:100, Burlingame, CA, USA). Slices were blocked with avidin (VectaStain Kit; Vector Laboratories), and stained with 3′,3′‐diaminobenzidine. After immunohistochemistry, slices were mounted on gelatin‐subbed slides (Southern Biotechnology, Birmingham, AL, USA) and dehydrated using deionized water to xylenes, coverslipped with Permount (UN1294 toluene solution; Fisher Chemical, Waltham, MA, USA) and visualized. Furthermore, the same procedure was used, and primary antibodies against rat IL‐1β (Santa Cruz Biotechnology catalogue no. sc‐32294, RRID:AB_627790, 1:100, Santa Cruz, CA, USA; Somsanith et al., 2018), rat IL‐6 (Santa Cruz Biotechnology catalogue no. sc‐28343, RRID:AB_627805, 1:100, Santa Cruz, CA, USA; Jiang et al., 2018), rat TNFα (Santa Cruz Biotechnology catalogue no. sc‐133192, RRID:AB_1567355, 1:100, Santa Cruz, CA, USA; Jiang et al., 2018) and IL‐10 (Abbiotec catalogue no. 250713, RRID:AB_2125107, 1:100, San Diego, CA, USA) were used to identify cytokine protein distribution in the brain tissue. Secondary antibodies used were biotinylated goat anti‐mouse IgG (Vector Laboratories catalogue no. BA‐9200, RRID:AB_2336171, 1:100). After immunohistochemistry, slices were mounted on gelatin‐subbed slides (Southern Biotechnology, Birmingham, AL, USA) and dehydrated using deionized water to xylenes, coverslipped with Permount and visualized. Control experiments for immunohistochemistry performed include those done without primary antibodies and those done without secondary antibodies (Figure S1). All antibodies were previously validated and published. These data are available in our online data supplement, at https://doi.org/10.6084/m9.figshare.7949348.v1
2.4.7. Microscopy and image analysis
Stained tissues were visualized using a Keyence BZ‐9000 fluorescence microscope set to bright field. Paraventricular nucleus‐containing slices were visualized and images captured at ×20 and ×40 magnifications.
Morphological analysis of microglia
Level 2 PVN slices were obtained (approximately bregma −1.8 to −2.0 mm) and SFO slices were obtained (approximately bregma −1.8 to −2.0 mm) and microglia in the sections were graded according to immunoreactivity on a scale from one to three, with one representing low reactivity and faint staining, two representing moderate reactivity with moderate staining, and three representing high reactivity with dark staining. In blinded, randomly sampled 200 µm × 200 µm squares at ×40 magnification, PVN and SFO microglia were determined to be ‘activated’ if they demonstrated characteristic morphological changes that including becoming amoeboid, where their projections were reduced to a size less than the diameter of the microglial soma (4–5 µm) and if the immunoreactivity was a grade 2 or 3 on staining (Bardgett, Holbein, Herrera‐Rosales, & Toney, 2014; Shi et al., 2010).
Sholl analysis of microglia
Images of level 2 of the PVN at ×40 magnification were obtained as previously described. Images were blinded and shuffled, and each image was opened in Adobe CC Photoshop (Adobe, 20.0.4 20190227.r.76), and images were overlaid with a 5 × 2 grid. Ten microglia were sampled randomly and systematically from individual grid squares and cropped so that the new image contained only the single microglial cell and its processes. In each group, 10 microglia from each of six animals were run, for a total of 60 microglia per group. Each new cropped image was opened in ImageJ/FIJI (ImageJ 1.52p, Java 1.8.0_172; US National Institutes of Health). Each image was then converted to 8‐bit, and the ‘measure → threshold’ function was used to identify the microglia from the background. The selected microglial cell was then subjected to Sholl analysis via the ‘Analysis’ function of FIJI, where concentric rings were placed equally distant (1 µm) from one another, radiating outwards from the centre of the soma. The number of ring intersections at each ring, for a distance of 25 rings, was saved and analysed using GraphPad Prism software (v.7; GraphPad Software, La Jolla, CA, USA) and plotted as group means at each given ring with standard deviations. One‐way ANOVA was used to compare the overall differences between trend lines within ODN infusion groups.
Analysis of astrocytes
Astrocytes were analysed using ImageJ software, in which the images were converted to a greyscale and set to ‘Image → Type → RGB’ and then analysis was performed to quantify the total percentage area of the PVN that the astrocytes composed, i.e. their density in the PVN. Astrocytes stained for GFAP, which is purportedly upregulated in astrogliosis (Pekny, Wilhelmsson, & Pekna, 2014), were quantified (in pixels) and divided by the total number of pixels composing the PVN to obtain a percentage of composition, or tissue density.
Cytokine immunohistochemistry
Cytokine immunohistochemistry was analysed qualitatively for visible differences in stain immunoreactivity in both the PVN and the SFO.
2.5. Statistical analysis
Data are expressed as means ± SD. Differences occurring between treatment groups (e.g. SCR versus Gαi2 ODN) were assessed by a two‐way ANOVA, with treatment group being one fixed effect and dietary intake the other, with the interaction included. Post hoc analysis was performed using Bonferroni's test and individual Student's unpaired t tests. Statistical analysis was carried out using a software program (GraphPad Prism v.7). Statistical significance was defined as probability P < 0.05.
3. RESULTS
3.1. Impact of brain Gαi2 protein downregulation during 7 days of high salt intake on plasma NA
In control SCR ODN‐infused male Sprague–Dawley rats, HS diet for 7 days had no impact on MAP and evoked global sympathoinhibition (SCR ODN; plasma NA: NS 65 ± 5 versus HS 37 ± 6 nmol l−1, P < 0.05; Figure 1). In contrast, male Sprague–Dawley rats receiving a targeted Gαi2 ODN infusion, which selectively downregulates brain Gαi2 proteins, developed salt‐sensitive hypertension (Gαi2 ODN; MAP day 7 of HS diet: NS 103 ± 1.1 versus HS 128 ± 2 mmHg, P < 0.05) and dietary sodium‐evoked sympathoexcitation, measured as plasma NA (Gαi2 ODN; plasma NA: NS 67 ± 6 versus HS 91 ± 8 nmol l−1, P < 0.05). Additionally, in these hypertensive rats we observed suppression of plasma renin activity and urinary angiotensinogen to the same levels as those seen in SCR ODN‐infused rats (Figure 1). In control SCR ODN‐infused rats maintained on HS intake for 7 days, minocycline infusion had no impact on MAP, suppression of plasma NA, plasma renin activity or urinary angiotensinogen (Figure 1). Significantly, central minocycline co‐infusion attenuated the magnitude of hypertension in rats on HS diets receiving a Gαi2 ODN infusion (Gαi2 ODN; MAP on day 7 of HS diet: HS 128 ± 2 versus HS+MINO 114 ± 1.1 mmHg, P < 0.05; Figure 1b) and abolished dietary salt‐evoked elevations in plasma NA (Gαi2 ODN; plasma NA: HS 91 ± 8 versus HS+MINO 72 ± 6 nmol l−1, P < 0.05; Figure 1c).
Figure 1.
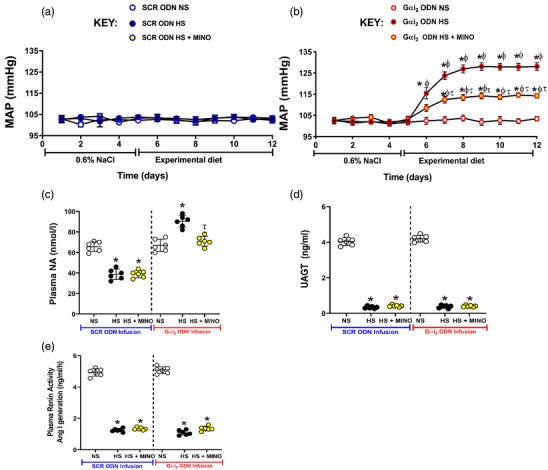
Impact of control scrambled (SCR) and targeted Gαi2 intracerebroventricular oligodeoxynucleotide (ODN) infusion [25 µg (5 µl)−1 day−1 for 7 days] and minocycline (MINO)–ODN co‐infusion [ODN, 25 µg (5 µl)−1 day−1; MINO: 120 µg day−1 for 7 days in high‐salt (HS) group only] in male Sprague–Dawley rats receiving 7 days of normal‐salt (NS; 0.6% NaCl) or HS (4% NaCl) diets on: (a,b) mean arterial pressure (MAP) as assessed via radiotelemetry over 5 days preceding the experimental diet and the 7 days of the experimental diet; (c) plasma noradrenaline (NA) concentrations; (d) urinary angiotensinogen (UAGT) concentrations; and (e) plasma renin activity. (n = 6 per group, * P < 0.05 versus pre‐experimental diet NS in respective ODN treatment group; τ P < 0.05 versus 7 days of experimental HS in respective ODN treatment group; ϕ P < 0.05 versus 7 days of experimental NS diet in the respective ODN treatment group, means ± SD.)
3.2. Impact of minocycline on Gαi2 ODN‐mediated downregulation of PVN Gαi2 proteins
In subsets of animals co‐infused with ODN and minocycline, immunoblotting was performed to assess the impact of co‐infusion of minocycline and ODNs on targeted Gαi2 protein downregulation. The Gαi2 ODN–MINO co‐infusion resulted in an average 79% reduction in PVN‐specific Gαi2 protein expression as assessed by immunoblotting, normalized to total protein in Coomassie Blue‐stained gels (Figure 2; SCR ODN fold change HS + MINO 1.04 ± 0.24 versus Gαi2 HS + MINO 0.209 ± 0.12, P < 0.0001). Therefore, minocycline did not appear to have an impact on the ability of the ODN to induce protein knockdown successfully.
Figure 2.
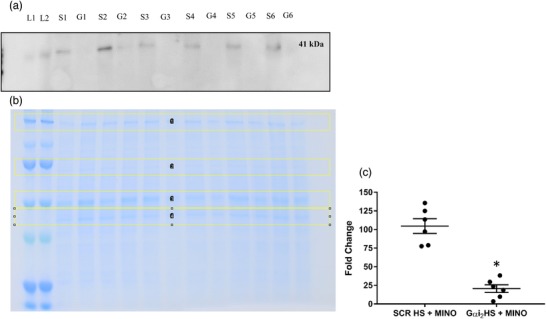
(a) Representative immunoblot demonstrating impact of Gαi2 oligodeoxynucleotide (ODN)–minocycline co‐infusion on paraventricular nucleus (PVN) Gαi2 protein expression. L1 and L2 are ladder, S1–S6 are protein extracts from the PVN of scrambled control (SCR) ODN–minocycline co‐infused animals, and G1–G6 are protein extracts from the PVN of Gαi2 ODN–minocycline co‐infused animals. (b) Representative Coomassie Blue‐stained gel demonstrating total protein loaded, and bands outlined in yellow for normalization of bands in (a). (c) Quantification of the fold change in PVN Gαi2 protein expression between SCR ODN–minocycline co‐infused animals on high salt (HS) diet (4% NaCl) and Gαi2 ODN–minocycline co‐infused animals on HS diet. (n = 6 per group, * P < 0.05 versus SCR ODN treatment group, mean ± SD.)
3.3. Impact of brain Gαi2 protein downregulation during 7 days of high salt intake on PVN inflammatory cytokine levels
In control SCR ODN‐infused male Sprague–Dawley rats, 7 days of HS diet had no impact on the PVN mRNA expression of the pro‐inflammatory cytokines IL‐1β, IL‐6 and TNFα or the anti‐inflammatory cytokine IL‐10 (Figure 3). In contrast, in male Sprague–Dawley rats receiving a targeted Gαi2 ODN infusion, which develop salt‐sensitive hypertension (Figure 1a), dietary sodium evoked a ∼2‐ to 2.5‐fold increase (P < 0.05) in the PVN mRNA levels of the pro‐inflammatory cytokines IL‐1β, IL‐6 and TNFα (Figure 3a–c). Additionally, in these same rats, we observed suppression of PVN mRNA expression of the anti‐inflammatory cytokine IL‐10 (Figure 3d). In control SCR ODN‐infused rats maintained on 7 days of HS intake, minocycline infusion had no impact on the expression of cytokine mRNA levels (Figure 3). Significantly, central minocycline co‐infusion abolished dietary sodium‐evoked increases in pro‐inflammatory cytokines and the decrease in anti‐inflammatory IL‐10 (Figure 3a–d) in targeted Gαi2 ODN‐infused rats.
Figure 3.
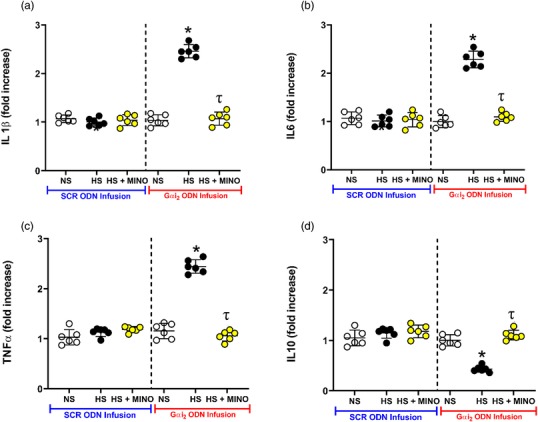
Impact of targeted Gαi2 or control scrambled (SCR) intracerebroventricular oligodeoxynucleotide (ODN) infusion [25 µg (5 µl)−1 day−1 for 7 days] and minocycline (MINO)–ODN co‐infusion [ODN, 25 µg (5 µl)−1 day−1; MINO, 120 µg day−1 for 7 days in HS group only] in male Sprague–Dawley rats receiving 7 days of normal‐salt (NS; 0.6% NaCl) or high‐salt (HS; 4% NaCl) diets on paraventricular nucleus (PVN) mRNA levels of IL‐1β (a), IL‐6 (b), TNFα (c) and IL‐10 (d) (n = 6 per group, * P < 0.05 versus control in respective ODN treatment group, τ P < 0.05 versus HS in respective ODN treatment group, mean ± SD.)
In control SCR ODN‐infused male Sprague–Dawley rats, 7 days of HS diet had no impact on the PVN protein expression of the pro‐inflammatory cytokines IL‐1β, IL‐6 or TNFα as determined via immunohistochemistry (Figures 4, 5, 6). In these same normotensive SCR ODN‐infused animals, 7 days of HS intake increased the immunoreactivity of the anti‐inflammatory cytokine IL‐10 (Figure 7). In contrast, in male Sprague–Dawley rats receiving a targeted Gαi2 ODN infusion, which develop salt‐sensitive hypertension (Figure 1a), high salt intake evoked increased protein expression of the pro‐inflammatory cytokines IL‐1β and IL‐6 but no change in the expression of TNFα (Figures 4, 5, 6). Furthermore, in contrast to the response seen in controlled SCR ODN‐infused rats, the HS diet did not increase IL‐10 immunoreactivity in Gαi2 ODN‐infused rats (Figure 7).
Figure 4.
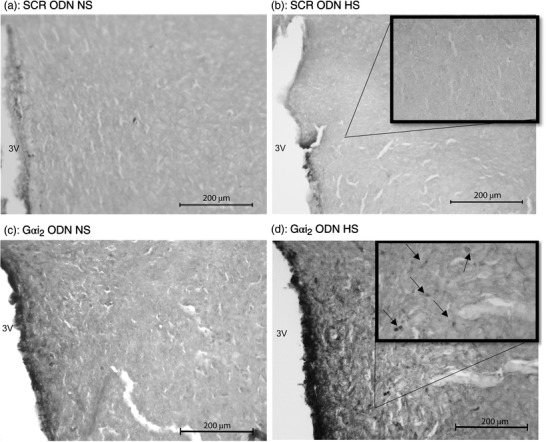
Representative photomicrographs of IL‐6 immunoreactivity in the paraventricular nucleus (PVN) of targeted Gαi2 or control scrambled (SCR) intracerebroventricular oligodeoxynucleotide (ODN)‐infused [25 µg (5 µl)−1 day−1 for 7 days] male Sprague–Dawley rats on 7 days of normal‐salt (NS; 0.6% NaCl) or high‐salt (HS; 4% NaCl) diet. (a) SCR ODN‐infused rat on NS diet. (b) SCR ODN‐infused rat on HS diet. (c) Gαi2 ODN‐infused rat on NS diet. (d) Gαi2 ODN‐infused rat on HS diet. Abbreviation: 3V, third ventricle. (n = 6 per group, scale bars: 200 µm; large images ×20 magnification, inset ×40 magnification, arrows point to IL‐6 stain.)
Figure 5.
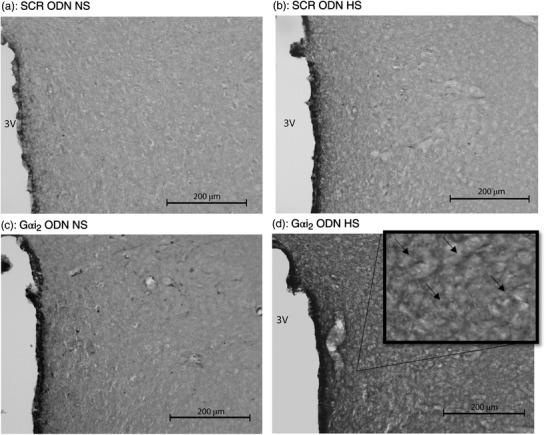
Representative photomicrographs of IL‐1β immunoreactivity in the paraventricular nucleus (PVN) of targeted Gαi2 or control scrambled (SCR) intracerebroventricular oligodeoxynucleotide (ODN)‐infused [25 µg (5 µl)−1 day−1 for 7 days] male Sprague–Dawley rats on 7 days of normal‐salt (NS; 0.6% NaCl) or high‐salt (HS; 4% NaCl) diet. (a) SCR ODN‐infused rat on NS diet. (b) SCR ODN‐infused rat on HS diet. (c) Gαi2 ODN‐infused rat on NS diet. (d) Gαi2 ODN‐infused rat on HS diet. Abbreviation: 3V, third ventricle. (n = 6 per group, scale bars: 200 µm; large images ×20 magnification, inset ×40 magnification; arrows point to IL‐1β stain.)
Figure 6.
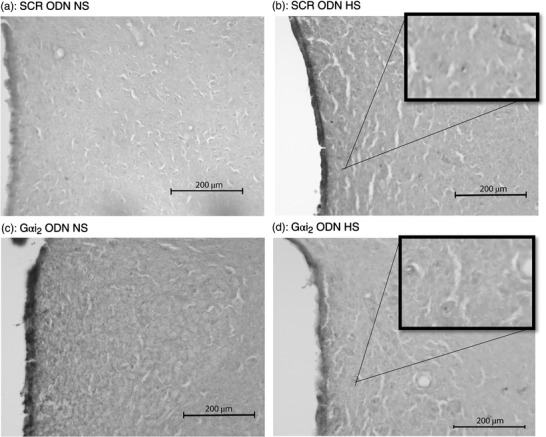
Representative photomicrographs of TNFα immunoreactivity in the paraventricular nucleus (PVN) of targeted Gαi2 or control scrambled (SCR) intracerebroventricular oligodeoxynucleotide (ODN)‐infused [25 µg (5 µl)−1 day−1 for 7 days] male Sprague–Dawley rats on 7 days of normal‐salt (NS; 0.6% NaCl) or high‐salt (HS; 4% NaCl) diet. (a) SCR ODN‐infused rat on NS diet. (b) SCR ODN‐infused rat on HS diet. (c) Gαi2 ODN‐infused rat on NS diet. (d) Gαi2 ODN‐infused rat on HS diet. Abbreviation: 3V, third ventricle. (n = 6 per group, scale bars: 200 µm; ×20 magnification, insets ×40 magnification.)
Figure 7.
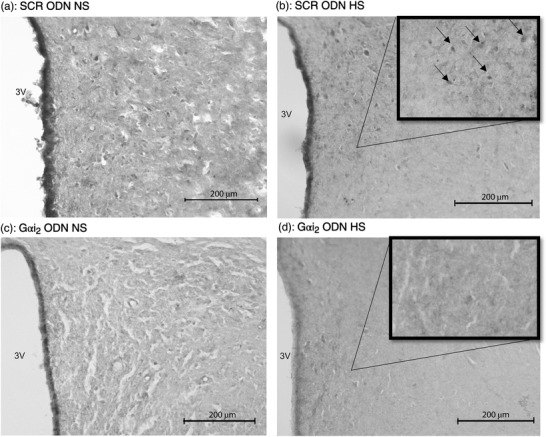
Representative photomicrographs IL‐10 immunoreactivity in the paraventricular nucleus (PVN) of targeted Gαi2 or control scrambled (SCR) intracerebroventricular oligodeoxynucleotide (ODN)‐infused [25 µg (5 µl)−1 day−1 for 7 days] male Sprague–Dawley rats on 7 days of normal‐salt (NS; 0.6% NaCl) or high‐salt (HS; 4% NaCl) diet. (a) SCR ODN‐infused rat on NS diet. (b) SCR ODN‐infused rat on HS diet. (c) Gαi2 ODN‐infused rat on NS diet. (d) Gαi2 ODN‐infused rat on HS diet. Abbreviation: 3V, third ventricle. (n = 6 per group, scale bars: 200 µm; ×20 magnification, insets ×40 magnification; arrows point to IL‐10 stain.)
3.4. Impact of brain Gαi2 protein downregulation during 7 days of high salt intake on PVN microglia and astrocytes
Immunohistochemistry for OX‐42 (CD11b/c; microglial antigen) in control SCR ODN‐infused male Sprague–Dawley rats demonstrated that 7 days of HS diet had no impact on PVN microglial density, assessed as the average number of microglia (Figure 8) or as microglial activation (Figure 9). In contrast, in hypertensive male Sprague–Dawley rats receiving a targeted Gαi2 ODN infusion, the HS diet increased PVN microglial recruitment (Gαi2 ODN; number of microglia: NS 22 ± 8 versus HS 35 ± 7, P < 0.05; Figure 8) and activation (Gαi2 ODN; activation of microglia: NS 17 ± 6 versus HS 29 ± 2%, P < 0.05; Figure 9). Central minocycline co‐infusion in control SCR ODN‐infused rats maintained on 7 days of HS intake reduced average microglial density without impacting levels of microglial activation (Figures 8 and 9). Significantly, central minocycline co‐infusion abolished the HS diet‐evoked increase in microglial infiltration and activation in rats receiving a Gαi2 ODN infusion (Gαi2 ODN; number of microglia: HS 36 ± 7 versus HS + MINO 16 ± 6, P < 0.05; Figure 8; activation of microglia: HS 29 ± 2 versus HS + MINO 13 ± 6%, P < 0.05; Figure 9).
Figure 8.
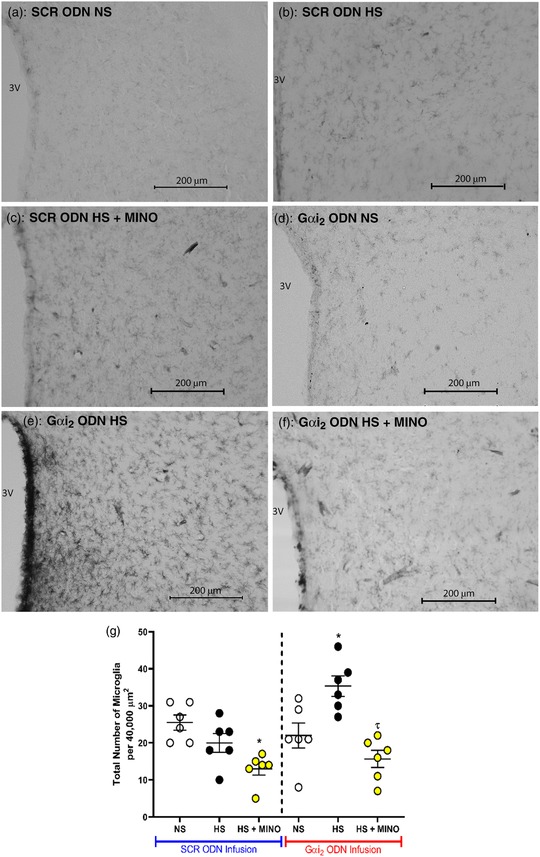
(a–f) Representative photomicrographs of microglia (primary antibody against OX‐42) in the paraventricular nucleus (PVN) of targeted Gαi2 or control scrambled (SCR) intracerebroventricular oligodeoxynucleotide (ODN)‐infused [25 µg (5 µl)−1 day−1 for 7 days] and minocycline (MINO)–ODN co‐infused [ODN, 25 µg (5 µl)−1 day−1; MINO, 120 µg day−1 for 7 days in HS only] male Sprague–Dawley rats on 7 days of normal‐salt (NS; 0.6% NaCl) or high‐salt (HS; 4% NaCl) diet. (a) SCR ODN‐infused rat on NS diet. (b) SCR ODN‐infused rat on HS diet. (c) SCR ODN‐infused rat on HS diet co‐infused with minocycline. (d) Gαi2 ODN‐infused rat on NS diet. (e) Gαi2 ODN‐infused rat on HS diet. (f) Gαi2 ODN‐infused rat on HS diet co‐infused with MINO (scale bars: 200 µm, ×20 magnification). (g) Average number of PVN microglia in randomly selected 200 µm × 200 µm box in Sprague–Dawley rats during SCR or Gαi2 ODN infusion maintained on NS or HS diet and minocycline–ODN co‐infusion on HS diet. Abbreviation: 3V, third ventricle. (n = 6 per group, * P < 0.05 versus NS in respective ODN treatment group; τ P < 0.05 versus HS in respective ODN treatment group, mean ± SD.)
Figure 9.
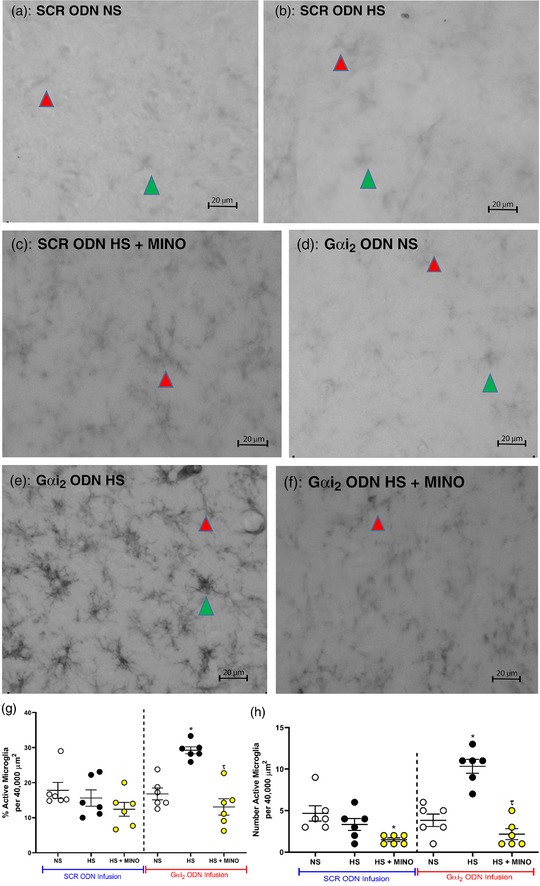
Representative photomicrographs of microglia in the paraventricular nucleus (PVN) of targeted Gαi2 or control scrambled (SCR) intracerebroventricular oligodeoxynucleotide (ODN)‐infused [25 µg (5 µl)−1 day−1 for 7 days] and minocycline (MINO)–ODN co‐infused [ODN, 25 µg (5 µl)−1 day−1; MINO, 120 µg day−1 for 7 days in HS only] male Sprague–Dawley rats on 7 days of normal‐salt (NS; 0.6% NaCl) or high‐salt (HS; 4% NaCl) diet. (a) SCR ODN‐infused rat on NS diet. (b) SCR ODN‐infused rat on HS diet. (c) SCR ODN‐infused rat on HS diet co‐infused with minocycline. (d) Gαi2 ODN‐infused rat on NS diet. (e) Gαi2 ODN‐infused rat on HS diet. (f) Gαi2 ODN‐infused rat on HS diet co‐infused with minocycline. (g) Impact of minocycline co‐infusion (120 µg day−1 for 7 days) on percentage activation of PVN microglia in Sprague–Dawley rats during SCR or Gαi2 ODN infusion maintained on HS diet. (h) Impact of minocycline on number of PVN active microglia in Sprague–Dawley rats during SCR or Gαi2 ODN infusion maintained on HS diet. (n = 6 per group, scale bars: 20 µm; green arrowheads indicate representative activated microglia; red arrowheads indicates representative inactivated microglia; ×40 magnification; * P < 0.05 versus NS in respective ODN treatment group; τ P < 0.05 versus HS in respective ODN treatment group, mean ± SD.)
Sholl analysis of microglia in control SCR ODN‐infused male Sprague–Dawley rats demonstrated that 7 days of HS diet had no impact on PVN microglial branching complexity, because there were no statistically significant differences in the trend lines (Figure 10a). In contrast, in hypertensive male Sprague–Dawley rats receiving a targeted Gαi2 ODN infusion, the HS diet significantly decreased the branching complexity of microglia, as shown by the decreased number of ring intersections along the entire trend line compared with animals on the NS diet (P < 0.05; Figure 10b). Central minocycline co‐infusion in control SCR ODN‐infused rats maintained on 7 days of HS diet significantly increased microglial branching complexity, as shown by a significant elevation in ring intersections distant from the soma (P < 0.05; Figure 10a). Significantly, central minocycline co‐infusion abolished the HS diet‐evoked reduction in microglial branching complexity in rats receiving a Gαi2 ODN infusion (P < 0.05; Figure 10b).
Figure 10.
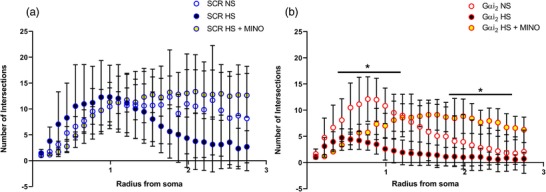
Sholl analyses of microglia in the paraventricular nucleus (PVN) of the hypothalamus of targeted Gαi2 or control scrambled (SCR) intracerebroventricular oligodeoxynucleotide (ODN)‐infused [25 µg (5 µl)−1 day−1 for 7 days] and minocycline (MINO)–ODN co‐infused [ODN, 25 µg (5 µl)−1 day−1; MINO, 120 µg day−1 for 7 days in HS only] male Sprague–Dawley rats on 7 days of normal‐salt (NS; 0.6% NaCl) or high‐salt (HS; 4% NaCl) diet. Sholl analysis of microglia, depicting branching intersections as a function of radius from the soma, in: (a) control SCR ODN‐infused animals on NS and HS diets and SCR ODN–minocycline co‐infused animals on HS diet; and (b) targeted Gαi2 ODN‐infused animals on NS and HS diets and Gαi2 ODN–minocycline co‐infused animals on HS diet. (* P < 0.05 versus HS in respective ODN treatment group, mean ± SD.)
Immunohistochemistry for the astrocytic marker GFAP demonstrated that, in both control SCR and targeted Gαi2 ODN‐infused rats, the dietary salt intake had no impact on astrocyte density within the PVN (Figure 11).
Figure 11.
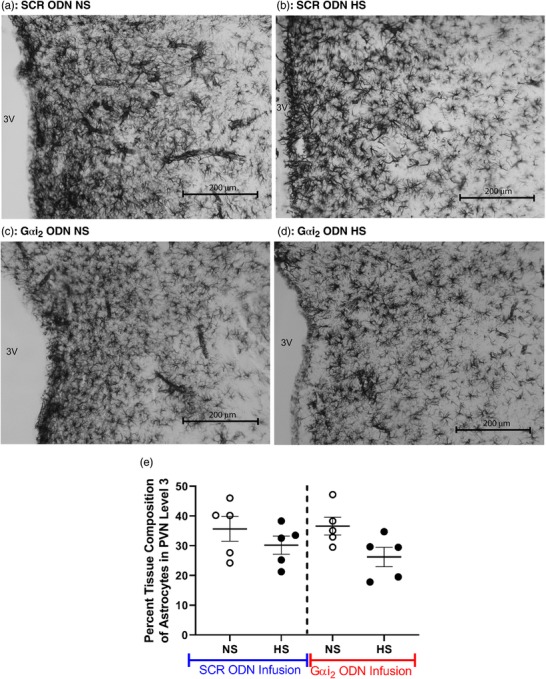
(a–d) Representative photomicrographs of astrocytes in the third level of the paraventricular nucleus (PVN) of targeted Gαi2 or control scrambled (SCR) intracerebroventricular oligodeoxynucleotide (ODN)‐infused [25 µg (5 µl)−1 day−1 for 7 days] male Sprague–Dawley rats on 7 days of normal‐salt (NS; 0.6% NaCl) or high‐salt (HS; 4% NaCl) diet. (a) SCR ODN‐infused rat on NS diet. (b) SCR ODN‐infused rat on HS diet. (c) Gαi2 ODN‐infused rat on NS diet. (d) Gαi2 ODN‐infused rat on HS diet. (e) Percentage tissue composition of astrocytes in the PVN of Sprague–Dawley rats during SCR or Gαi2 ODN infusion maintained on NS or HS diet. Abbreviation: 3V, third ventricle. (n = 5 per group, scale bar: 200 µm; ×20 magnification; mean ± SD.)
3.5. Impact of brain Gαi2 protein downregulation during 7 days of high salt intake on SFO microglia and cytokines
Immunohistochemistry for OX‐42 (CD11b/c; microglial antigen) demonstrated that 7 days of HS diet had no impact on SFO microglial density, number of active microglia or percentage of active microglia, regardless of ODN infusion (Figure 12). Furthermore, minocycline co‐infusion had no statistically significant impact on the aforementioned parameters, regardless of ODN infusion.
Figure 12.
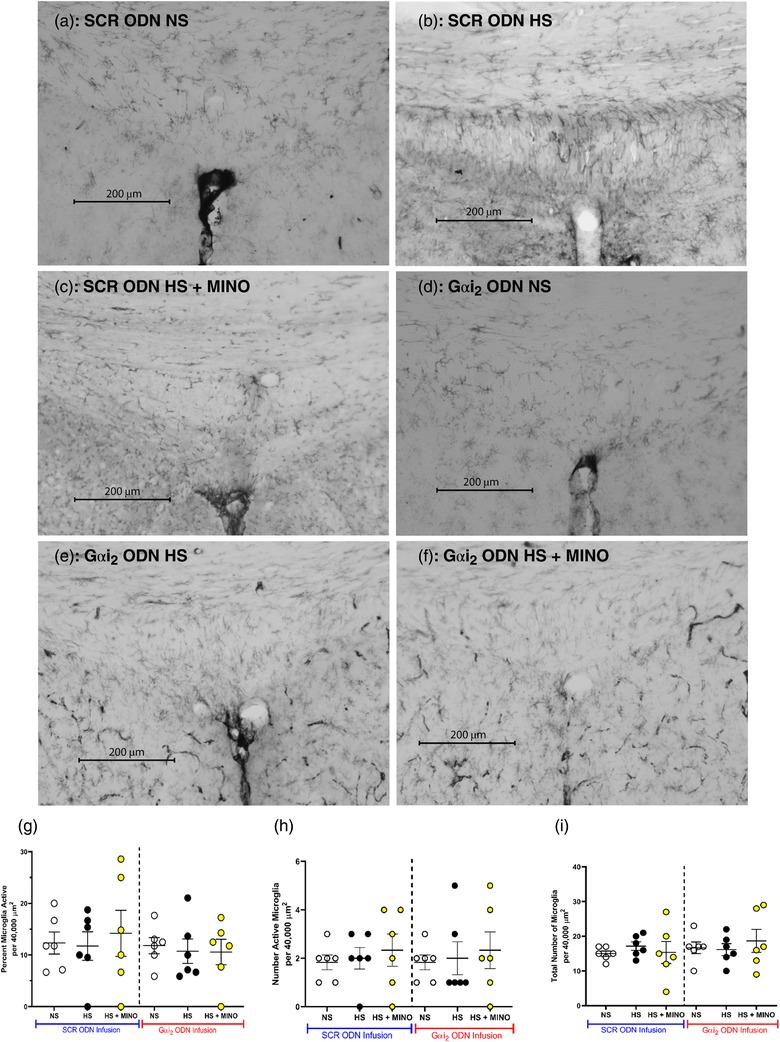
(a–f) Representative photomicrographs of microglia (primary antibody against OX‐42) in the subfornical organ (SFO) of targeted Gαi2 or control scrambled (SCR) intracerebroventricular oligodeoxynucleotide (ODN)‐infused [25 µg (5 µl)−1 day−1 for 7 days] and minocycline (MINO)–ODN co‐infused [ODN, 25 µg (5 µl)−1 day−1; MINO, 120 µg day−1 for 7 days in HS only] male Sprague–Dawley rats on 7 days of normal‐salt (NS; 0.6% NaCl) or high‐salt (HS; 4% NaCl) diet. (a) SCR ODN‐infused rat on NS diet. (b) SCR ODN‐infused rat on HS diet. (c) SCR ODN‐infused rat on HS diet co‐infused with minocycline. (d) Gαi2 ODN‐infused rat on NS diet. (e) Gαi2 ODN‐infused rat on HS diet. (f) Gαi2 ODN‐infused rat on HS diet co‐infused with MINO. (g) Impact of minocycline co‐infusion (120 µg day−1 for 7 days) on percentage activation of PVN microglia in Sprague–Dawley rats during SCR or Gαi2 ODN infusion maintained on HS diet. (h) Impact of minocycline co‐infusion (120 µg day−1 for 7 days) on number of active PVN microglia in Sprague–Dawley rats during SCR or Gαi2 ODN infusion maintained on HS diet. (I) Impact of minocycline co‐infusion (120 µg day−1 for 7 days) on total number of PVN microglia in Sprague–Dawley rats during SCR or Gαi2 ODN infusion maintained on HS diet. (n = 6 per group, scale bar: 200 µm, ×20 magnification, mean ± SD.)
Immunohistochemistry in the subfornical organ suggested that 7 days of HS diet elicited no change in SFO PIC protein levels of IL‐6, IL‐1β or TNFα, or anti‐inflammatory cytokine IL‐10 protein levels between SCR ODN‐infused and Gαi2 ODN‐infused rats (Figure 13).
Figure 13.
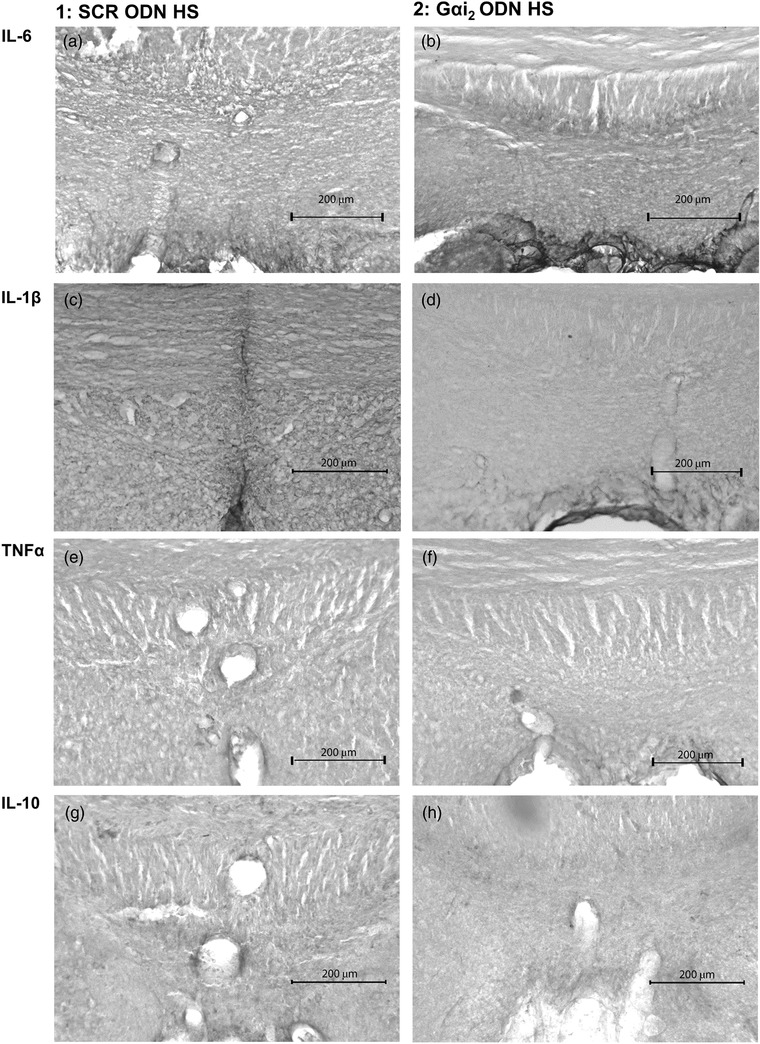
Representative photomicrographs of cytokine immunoreactivity in the subfornical organ (SFO) of control scrambled (SCR; a,c,e,g) or targeted Gαi2 (b,d,f,h) intracerebroventricular oligodeoxynucleotide (ODN)‐infused [25 µg (5 µl)−1 day−1 for 7 days] male Sprague–Dawley rats on 7 days of high‐salt (HS; 4% NaCl) diet. (a,b) IL‐6 stain. (c,d) IL‐1β stain. (e,f) TNFα stain. (g,h) IL‐10 stain. (n = 6 per group, scale bar: 200 µm; ×20 magnification.)
4. DISCUSSION
The present study was designed to investigate the potential involvement of central inflammation in Gαi2 protein‐dependent, salt‐sensitive hypertension. First, we demonstrated that PVN inflammation, but not SFO inflammation, involving increased PVN PIC levels, PVN microglial activation and infiltration, occurred in Gαi2 protein‐dependent, salt‐sensitive hypertension. Additionally, central administration of minocycline, a known inhibitor of microglia, attenuated PVN microglial activation and infiltration, abolished PVN inflammation, attenuated the elevation in plasma noradrenaline and attenuated the magnitude of hypertension in Gαi2 ODN‐infused rats fed a HS diet. These data together suggest a new mechanism whereby microglial activation and PVN inflammation contribute to the development of Gαi2 protein‐dependent, salt‐sensitive hypertension and suggest a potential role of Gαi2 protein signalling in countering PVN inflammatory processes during HS intake in the salt‐resistant Sprague–Dawley rat.
In agreement with our previous data generated in male Sprague–Dawley rats (Kapusta et al., 2013), we observed the development of sympathetically mediated salt‐sensitive hypertension after the central ODN‐mediated downregulation of Gαi2 proteins. These data extend our earlier report that Gαi2 protein downregulation evokes salt‐sensitive hypertension after 21 days of 8% NaCl intake (Kapusta et al., 2013), confirm our data generated in Dahl salt‐resistant rats that Gαi2 protein downregulation evokes hypertension by day 7 (Wainford et al., 2015) and establish that the salt sensitivity of blood pressure after central downregulation of Gαi2 protein develops at a lower, more physiologically relevant dietary intake level (4% NaCl). Owing to the incompatible methods of tissue preparation for immunohistochemistry (paraformaldehyde fixation) and western blotting (snap‐freezing) of PVN tissue, it was not possible to validate Gαi2 protein knockdown in animals in which microglia and cytokine expression were assessed by immunohistochemistry. However, to determine whether minocycline co‐infusion was impacting ODN‐mediated Gαi2 protein downregulation, in separate groups of animals co‐infused with Gαi2 or SCR ODN and minocycline, we performed immunoblotting of PVN punches. In these animals, minocycline did not impact ODN infusion, and Gαi2 ODN infusion successfully reduced PVN Gαi2 protein expression by 79%. In certain groups of animals in which we were unable to validate knockdown via western blot, blood pressure and plasma NA concentrations were used as a physiological measure of the development of salt‐sensitive hypertension (Carmichael, Carmichael, Kuwabara, Cunningham, & Wainford, 2016; Kapusta et al., 2013; Wainford et al., 2015). Despite experimental limitations preventing the confirmation of Gαi2 protein knockdown, based on our many earlier publications demonstrating the efficacy of our ODN approach to downregulate central Gαi2 proteins acutely and chronically, our confirmatory studies presented in minocycline‐infused animals, and the clear differences observed in Gαi2 versus SCR ODN‐infused animals in several inflammatory markers, we are confident that Gαi2 knockdown was achieved.
Several studies, conducted in different models of hypertension, including the spontaneously hypertensive rat and the angiotensin II infusion model in Sprague–Dawley rats, have reported the presence of neuroinflammation, including increased production of pro‐inflammatory cytokines (Bardgett et al., 2014; Biancardi et al., 2016; Shi et al., 2010). A recent study conducted in the DSS rat model also reported an upregulation of PVN pro‐inflammatory cytokines in response to high dietary sodium intake (Jiang et al., 2018). As such, we elected to investigate the potential role of PVN inflammation in our salt‐sensitive Gαi2 protein‐dependent hypertension model. On day 7 of high salt intake, we observed increased PVN PIC production of IL‐6, IL‐1β and TNFα mRNA. Interestingly, immunohistochemistry for these cytokines in the PVN suggested the increased protein expression of IL‐6 and IL‐1β only. It is possible that TNFα protein levels may be increased only transiently during the development of salt‐sensitive hypertension and are not required to maintain established hypertension. Alternatively, it is possible that although TNFα mRNA is upregulated, the neuroinflammatory response observed after Gαi2 protein downregulation is TNFα independent, as reported in angiotensin II‐dependent hypertension (Bardgett et al., 2014). At present, we are unable to determine the cell types to which pro‐inflammatory cytokines are localized. Given the high expression of multiple G‐Protein Coupled Receptors, metabotropic receptors containing alpha, beta and gamma subunits which activate upon ligand binding (GPCRs) in neurons and the impact of Gαi2 protein downregulation on sympathetic outflow, we speculate that the observed inflammatory processes might be occurring in neurons. To address this issue experimentally, future studies might use the double labelling of cells types in combination with cytokine expression to determine the cell type to which inflammatory cytokines in the PVN are localized. Interleukin‐10, an anti‐inflammatory cytokine, has previously been shown to be neuroprotective (Shi et al., 2010; Song et al., 2014). Levels of IL‐10 were downregulated at both the mRNA and protein levels during Gαi2 ODN infusion on the HS diet, suggesting a decrease in neuroprotective signalling in the PVN, consistent with literature suggesting that IL‐10 is protective against other forms of hypertension (Drews et al., 2019; Segiet et al., 2019). Lastly, minocycline administration, which lowered blood pressure and plasma NA levels in Gαi2 ODN‐infused rats on a HS diet, restored mRNA levels of PIC and anti‐inflammatory cytokines to baseline, suggesting a direct role of neuroinflammation in Gαi2 protein‐dependent hypertension. We speculate that there is an imbalance between anti‐inflammatory and pro‐inflammatory mechanisms occurring within the PVN that contributes to the development of salt‐sensitive hypertension, potentially via modulation of sympathetic outflow, a hypothesis supported by the recent data generated in DSS rats (Jiang et al., 2018). Given that in our previous study, we reported that an absence of PVN Gαi2 protein upregulation during high salt intake in the DSS rat contributes to sympathoexcitation and hypertension (Wainford et al., 2015), we speculate that impaired PVN Gαi2 protein signalling might contribute to PVN inflammation in the Dahl rat phenotype.
To attempt to identify the source of the PICs being produced in the PVN in the setting of Gαi2 protein‐dependent salt‐sensitive hypertension, we investigated the involvement of microglia and astrocytes. We elected to examine these as potential mediators of the observed increase in PICs because both microglia (innate immune cells in brain that are tightly linked to the production of PICs; Galic et al., 2012; Shi et al., 2010) and astrocytes (regulators of CNS inflammation; Colombo & Farina, 2016; Pekny et al., 2014) become activated in response to pathological stimuli (e.g. hypertension). Our immunohistochemical analysis revealed no impact of central Gαi2 protein downregulation on PVN astrocytic density or immunoreactivity irrespective of dietary salt intake or hypertension. These data suggest that Gαi2 protein‐dependent salt‐sensitive hypertension occurs independently of astrocyte activation. This finding supports earlier studies conducted in the angiotensin II‐dependent model of hypertension that reported an absence of astrocyte recruitment despite the presence of hypertension and PVN inflammation (Pekny et al., 2014; Verkhratsky & Nedergaard, 2018). When examining PVN microglia, we saw increased microglial infiltration (assessed as the number of microglia present within the PVN) and activation of microglia, as indicated by reduction in cell size and decreased branching complexity on Sholl analysis, suggesting that microglia play a role in the inflammation observed in Gαi2 protein‐dependent salt‐sensitive hypertension. Additionally, microglial infiltration, activation and PIC production were not observed in the SFO, a chemosensitive region important in blood pressure regulation. Given that activated microglia are primary producers of CNS PICs, this observation might suggest that the inflammatory mechanism in our model of hypertension is PVN specific. Further studies, beyond the scope of the present study, might be undertaken to investigate the potential role of inflammation in other neural control regions, such as the rostral ventrolateral medulla. To test the role of microglia in the observed PVN inflammatory response, we infused minocycline (inactivator of microglia; Yoon, Patel, & Dougherty, 2012). In rats in which central Gαi2 proteins were downregulated, minocycline co‐infusion abolished PVN microglial infiltration and activation, abolished PIC upregulation at the mRNA level, prevented elevations in plasma NA and significantly attenuated the magnitude of dietary sodium‐evoked hypertension. Therefore, we hypothesize that PVN microglia evoke central inflammation that contributes significantly, possibly via modulation of sympathetic outflow, to the pathophysiology of Gαi2 protein‐dependent salt‐sensitive hypertension. To elucidate the potential causal relationship between microglial activation, PIC production and Gαi2 protein‐dependent salt‐sensitive hypertension, future studies, beyond the scope of the present investigations, will assess the time course of microglial activation, PIC production and development of hypertension. Additionally, we have not characterized the impact of minocycline on PVN neuron excitability electrophysiologically. It is possible that minocycline, which has been demonstrated in subpopulations of neurons to modulate excitability (Liu, Zhang, Zhu, Luo, & Liu, 2015), operates independently of microglia to decrease the intrinsic excitability of PVN presympathetic neurons.
Collectively, these data indicate that Gαi2 protein signal transduction is a novel CNS mechanism that influences PVN inflammation in response to a chronic HS challenge to counter the development and magnitude of sympathetically mediated salt‐sensitive hypertension. Our present findings also suggest a potential role of Gαi2 protein signalling in countering PVN inflammatory processes during HS intake to prevent the development of salt‐sensitive hypertension. Given that we observed attenuated plasma NA and reductions in PIC and MAP after minocycline infusion, we speculate that microgliosis contributes significantly to Gαi2 protein‐dependent salt‐sensitive hypertension. Our data add to our understanding of the CNS inflammatory pathways influencing blood pressure regulation and contribute to the growing body of evidence that PVN PIC pathways have a direct influence on sympathetic outflow (Shi et al., 2011). Increased understanding of the PVN inflammatory responses to elevations in dietary salt intake has implications for the development of salt‐sensitive hypertension. We speculate that PVN neuro‐inflammation, mediated by microglial activation, plays a significant role in the pathophysiology of disease states in which sympathoexcitation is evident (e.g. several forms of hypertension, heart failure) and represents a potential therapeutic target. After our report of a positive association between the single nucleotide polymorphism rs10510755 in the human GNAI2 gene and the salt sensitivity of blood pressure, independently of sex or age, in the Genetic Epidemiology of Salt Sensitivity data set (Zhang, Frame, Williams, & Wainford, 2018), our data have translational implications for the development of personalized anti‐hypertensive therapeutics designed to target Gαi2 protein‐gated pathways.
COMPETING INTERESTS
None declared.
AUTHOR CONTRIBUTIONS
J.D.M., A.A.F. and R.D.W. conceived and designed research; J.D.M., P.C., A.A.F., F.P., K.M.N., E.A.A., J.C.G. and R.D.W. performed experiments; J.D.M., P.C., F.P., T.L.M. and R.D.W. analysed data; J.D.M., P.C. and R.D.W. interpreted results of experiments and drafted the manuscript; J.D.M., P.C., F.P. and R.D.W. prepared figures; J.D.M., P.C., A.A.F., F.P., K.M.N., E.A.A., T.L.M. and R.D.W. edited and revised the manuscript. All authors approved the final version of manuscript and agree to be accountable for all aspects of the work in ensuring that questions related to the accuracy or integrity of any part of the work are appropriately investigated and resolved. All persons designated as authors qualify for authorship, and all those who qualify for authorship are listed.
Moreira JD, Chaudhary P, Frame AA, et al. Inhibition of microglial activation in rats attenuates paraventricular nucleus inflammation in Gαi2 protein‐dependent, salt‐sensitive hypertension. Experimental Physiology. 2019;104:1892–1910. 10.1113/EP087924
Funding information
This work was supported by the US National Institutes of Health (NIH) R56 AG057687, R01 HL139867, R01 HL141406, R01 HL107330 and K02 HL112718 and American Heart Association 16MM32090001 17GRNT33670023 to R.D.W.; NIH F31 DK116501 to A.A.F. and T32 HL007224 to P.C.; and Society of Nephrology Foundation for Kidney Research Pre‐Doctoral Fellowship to F.P.
Edited by: Carolyn Barrett
REFERENCES
- Bardgett, M. E. , Holbein, W. W. , Herrera‐Rosales, M. , & Toney, G. M. (2014). Ang II–salt hypertension depends on neuronal activity in the hypothalamic paraventricular nucleus but not on local actions of tumor necrosis factor‐α. Hypertension, 63, 527–534. [DOI] [PMC free article] [PubMed] [Google Scholar]
- Biancardi, V. C. , Stranahan, A. M. , Krause, E. G. , de Kloet, A. D. , & Stern, J. E. (2016). Cross talk between AT1 receptors and Toll‐like receptor 4 in microglia contributes to angiotensin II‐derived ROS production in the hypothalamic paraventricular nucleus. American Journal of Physiology‐Heart and Circulatory Physiology, 310, H404–H415. [DOI] [PMC free article] [PubMed] [Google Scholar]
- Brouwers, S. , Smolders, I. , Wainford, R. D. , & Dupont, A. G. (2015). Hypotensive and sympathoinhibitory responses to selective central AT2 receptor stimulation in spontaneously hypertensive rats. Clinical Science, 129, 81–92. [DOI] [PMC free article] [PubMed] [Google Scholar]
- Carmichael, C. Y. , Carmichael, A. C. , Kuwabara, J. T. , Cunningham, J. T. , & Wainford, R. D. (2016). Impaired sodium‐evoked paraventricular nucleus neuronal activation and blood pressure regulation in conscious Sprague–Dawley rats lacking central Gαi2 proteins. Acta Physiologica, 216, 314–329. [DOI] [PMC free article] [PubMed] [Google Scholar]
- Colombo, E. , & Farina, C. (2016). Astrocytes: Key regulators of neuroinflammation. Trends in Immunology, 37, 608–620. [DOI] [PubMed] [Google Scholar]
- Drews, H. J. , Yenkoyan, K. , Lourhmati, A. , Buadze, M. , Kabisch, D. , Verleysdonk, S. , … Danielyan, L. (2019). Intranasal losartan decreases perivascular beta amyloid, inflammation, and the decline of neurogenesis in hypertensive rats. Neurotherapeutics, 16, 725–740. [DOI] [PMC free article] [PubMed] [Google Scholar]
- Frame, A. A. , Carmichael, C. Y. , Kuwabara, J. T. , Cunningham, J. T. , & Wainford, R. D. (2019). Role of the afferent renal nerves in sodium homeostasis and blood pressure regulation in rats. Experimental Physiology, 104, 1306–1323. [DOI] [PMC free article] [PubMed] [Google Scholar]
- Galic, M. A. , Riazi, K. , & Pittman, Q. J. (2012). Cytokines and brain excitability. Frontiers in Neuroendocrinology, 33, 116–125. [DOI] [PMC free article] [PubMed] [Google Scholar]
- Hadjimarkou, M. M. , Silva, R. M. , Rossi, G. C. , Pasternak, G. W. , & Bodnar, R. J. (2002). Feeding induced by food deprivation is differentially reduced by G‐protein α‐subunit antisense probes in rats. Brain Research, 955, 45–54. [DOI] [PubMed] [Google Scholar]
- Jiang, E. , Chapp, A. D. , Fan, Y. , Larson, R. A. , Hahka, T. , Huber, M. J. , … Shan, Z. (2018). Expression of proinflammatory cytokines is upregulated in the hypothalamic paraventricular nucleus of Dahl salt‐sensitive hypertensive rats. Frontiers in Physiology, 9, 104. [DOI] [PMC free article] [PubMed] [Google Scholar]
- Kapusta, D. R. , Pascale, C. L. , Kuwabara, J. T. , & Wainford, R. D. (2013). Central nervous system Gαi2‐subunit proteins maintain salt resistance via a renal nerve‐dependent sympathoinhibitory pathway. Hypertension, 61, 368–375. [DOI] [PMC free article] [PubMed] [Google Scholar]
- Kapusta, D. R. , Pascale, C. L. , & Wainford, R. D. (2012). Brain heterotrimeric Gαi2‐subunit protein‐gated pathways mediate central sympathoinhibition to maintain fluid and electrolyte homeostasis during stress. FASEB Journal, 26, 2776–2787. [DOI] [PMC free article] [PubMed] [Google Scholar]
- Liu, N. , Zhang, D. , Zhu, M. , Luo, S. , & Liu, T. (2015). Minocycline inhibits hyperpolarization‐activated currents in rat substantia gelatinosa neurons. Neuropharmacology, 95, 110–120. [DOI] [PubMed] [Google Scholar]
- Lloyd‐Jones, D. M. , Hong, Y. , Labarthe, D. , Mozaffarian, D. , Appel, L. J. , Van Horn, L. , … Rosamond, W. D. (2010). Defining and setting national goals for cardiovascular health promotion and disease reduction: The American Heart Association's strategic impact goal through 2020 and beyond. Circulation, 121, 586–613. [DOI] [PubMed] [Google Scholar]
- Mozaffarian, D. , Benjamin, E. J. , Go, A. S. , Arnett, D. K. , Blaha, M. J. , Cushman, M. , … Turner, M. B. (2016). Heart disease and stroke statistics—2016 update: A report from the American Heart Association. Circulation, 133, e38–e48. [DOI] [PubMed] [Google Scholar]
- Paxinos, G. , Watson, C. (2007). The Rat Brain in Stereotaxic Coordinates, 6th Edn. San Diego, CA: Academic Press. [Google Scholar]
- Pekny, M. , Wilhelmsson, U. , & Pekna, M. (2014). The dual role of astrocyte activation and reactive gliosis. Neuroscience Letters, 565, 30–38. [DOI] [PubMed] [Google Scholar]
- Reboussin, D. M. , Allen, N. B. , Griswold, M. E. , Guallar, E. , Hong, Y. , Lackland, D. T. , … Thompson‐Paul, A. M. , & Vupputuri, S. (2018). Systematic review for the 2017 ACC/AHA/AAPA/ABC/ACPM/AGS/APhA/ASH/ASPC/NMA/PCNA Guideline for the prevention, detection, evaluation, and management of high blood pressure in adults: A report of the American College of Cardiology/American Heart Association Task Force on Clinical Practice Guidelines. Hypertension, 71, 2176–2198. [DOI] [PMC free article] [PubMed] [Google Scholar]
- Rossi, G. C. , Standifer, K. M. , & Pasternak, G. W. (1995). Differential blockade of morphine and morphine‐6β‐glucuronide analgesia by antisense oligodeoxynucleotides directed against MOR‐1 and G‐protein α subunits in rats. Neuroscience Letters, 198, 99–102. [DOI] [PubMed] [Google Scholar]
- Segiet, A. , Smykiewicz, P. , Kwiatkowski, P. , & Zera, T. (2019). Tumour necrosis factor and interleukin 10 in blood pressure regulation in spontaneously hypertensive and normotensive rats. Cytokine, 113, 185–194. [DOI] [PubMed] [Google Scholar]
- Shi, P. , Diez‐Freire, C. , Jun, J. Y. , Qi, Y. , Katovich, M. J. , Li, Q. , … Raizada, M. K. (2010). Brain microglial cytokines in neurogenic hypertension. Hypertension, 56, 297–303. [DOI] [PMC free article] [PubMed] [Google Scholar]
- Shi, Z. , Gan, X. B. , Fan, Z. D. , Zhang, F. , Zhou, Y. B. , Gao, X. Y. , … Zhu, G. Q. (2011). Inflammatory cytokines in paraventricular nucleus modulate sympathetic activity and cardiac sympathetic afferent reflex in rats. Acta Physiologica, 203, 289–297. [DOI] [PubMed] [Google Scholar]
- Silva, R. M. , Rossi, G. C. , Mathis, J. P. , Standifer, K. M. , Pasternak, G. W. , & Bodnar, R. J. (2000). Morphine and morphine‐6β‐glucuronide‐induced feeding are differentially reduced by G‐protein α‐subunit antisense probes in rats. Brain Research, 876, 62–75. [DOI] [PubMed] [Google Scholar]
- Somsanith, N. , Kim, Y. K. , Jang, Y. S. , Lee, Y. H. , Yi, H. K. , Jang, J. H. , … Lee, M. H. (2018). Enhancing of osseointegration with propolis‐loaded TiO2 nanotubes in rat mandible for dental implants. Materials (Basel), 11, E61. [DOI] [PMC free article] [PubMed] [Google Scholar]
- Song, X. A. , Jia, L. L. , Cui, W. , Zhang, M. , Chen, W. , Yuan, Z. Y. , … Kang, Y. M. (2014). Inhibition of TNF‐α in hypothalamic paraventricular nucleus attenuates hypertension and cardiac hypertrophy by inhibiting neurohormonal excitation in spontaneously hypertensive rats. Toxicology and Applied Pharmacology, 281, 101–108. [DOI] [PubMed] [Google Scholar]
- Standifer, K. M. , Rossi, G. C. , & Pasternak, G. W. (1996). Differential blockade of opioid analgesia by antisense oligodeoxynucleotides directed against various G protein alpha subunits. Molecular Pharmacology, 50, 293–298. [PubMed] [Google Scholar]
- Verkhratsky, A. , & Nedergaard, M. (2018). Physiology of astroglia. Physiological Reviews, 98, 239–389. [DOI] [PMC free article] [PubMed] [Google Scholar]
- Wainford, R. D. , Carmichael, C. Y. , Pascale, C. L. , & Kuwabara, J. T. (2015). Gαi2‐protein‐mediated signal transduction: Central nervous system molecular mechanism countering the development of sodium‐dependent hypertension. Hypertension, 65, 178–186. [DOI] [PMC free article] [PubMed] [Google Scholar]
- Wainford, R. D. , Pascale, C. L. , & Kuwabara, J. T. (2013). Brain Gαi2‐subunit protein‐gated pathways are required to mediate the centrally evoked sympathoinhibitory mechanisms activated to maintain sodium homeostasis. Journal of Hypertension, 31, 747–757. [DOI] [PubMed] [Google Scholar]
- Wolf, S. A. , Boddeke, H. W. , & Kettenmann, H. (2017). Microglia in physiology and disease. Annual Review of Physiology, 79, 619–643. [DOI] [PubMed] [Google Scholar]
- Yoon, S. Y. , Patel, D. , & Dougherty, P. M. (2012). Minocycline blocks lipopolysaccharide induced hyperalgesia by suppression of microglia but not astrocytes. Neuroscience, 221, 214–224. [DOI] [PMC free article] [PubMed] [Google Scholar]
- Zhang, X. , Frame, A. A. , Williams, J. S. , & Wainford, R. D. (2018). GNAI2 polymorphic variance associates with salt sensitivity of blood pressure in the Genetic Epidemiology Network of Salt Sensitivity study. Physiological Genomics, 50, 724–725. [DOI] [PMC free article] [PubMed] [Google Scholar]
- Zuriaga, M. A. , Fuster, J. J. , Farb, M. G. , MacLauchlan, S. , Breton‐Romero, R. , Karki, S. , … Walsh, K. (2017). Activation of non‐canonical WNT signaling in human visceral adipose tissue contributes to local and systemic inflammation. Scientific Reports, 7, 17326. [DOI] [PMC free article] [PubMed] [Google Scholar]


