Abstract
Background
In recent years, the role of pre-treatment C-reactive protein/albumin ratio (CAR) in prognosis of esophageal cancer (EC) has been investigated by several studies. This meta-analysis aimed to provide a more accurate and objective assessment of the prognostic value of pre-treatment CAR in EC.
Methods
Studies assessing the role of pre-treatment CAR in prognosis of EC were searched from PubMed, Embase and the Cochrane Library (last update by April 16, 2019). The hazard ratios (HRs) of CAR and the corresponding 95% CIs for overall survival (OS) or cancer-specific survival (CSS) in EC were extracted for pooled analysis.
Results
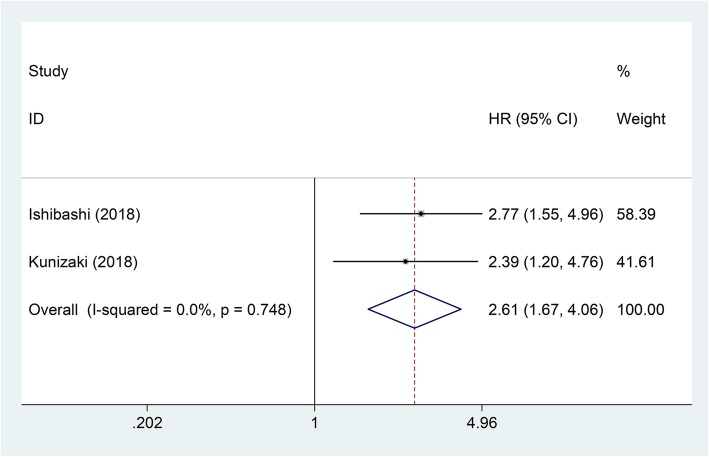
A total of eight observational studies including 2255 patients were collected. The pooled analysis showed that high CAR was related to worse OS in EC (pooled HR = 1.81; 95% CI = 1.40–2.35; P < 0.001). Subgroup analyses showed that the negative correlation between the CAR and OS was consistently demonstrated in subgroups stratified by country, pathological type, and cut-off value (P < 0.05). However, there was no relation between CAR and OS in subgroup of patients receiving neoadjuvant chemotherapy at a proportion of 100% (HR = 1.15, 95% CI = 0.56–2.69; P = 0.715). In addition, high CAR was also related to worse CSS in EC (pooled HR = 2.61; 95% CI = 1.67–4.06; P < 0.001).
Conclusions
High pre-treatment CAR was an adverse prognostic factor for EC patients. More large-sample clinical trials are still needed to verify the prognostic value of pre-treatment CAR in EC.
Keywords: Esophageal cancer, C-reactive protein/albumin ratio, Prognosis, Meta-analysis
Background
Esophageal cancer (EC) is one of the most common malignant tumors of digestive system [1]. 62.9% of new cases of EC in the world come from China, and are mainly esophageal squamous cell carcinoma (ESCC) [2, 3]. In addition, about 400,000 people die of EC every year in the world, and China’s deaths from EC accounts for about half of the world’s total deaths [2, 3]. Early diagnosis and correct treatment strategy based on prognostic assessment are the key to improve the prognosis of EC. Some biomarkers with high sensitivity and specificity are of great significance for prognostic assessment and determining the optimal treatment strategy. Currently, there is still a need for more research on prognostic biomarkers in EC, because few biomarkers have sufficient specificity and sensitivity to assess the prognosis of EC.
C-reactive protein (CRP), as an acute phase reactant (APR), is mainly produced by liver cells and regulated by interleukin-6 (IL-6, [4]. Albumin (Alb) can reflect the nutritional status of the body [5]. CRP/Alb ratio (CAR) is an indicator that reflects both inflammatory and nutritional status. Most patients with malignant tumors have elevated CAR [6, 7]. Elevated CAR indicates an increase in serum CRP concentration and hypoalbuminemia, suggesting that the overall condition of the patient is poor [8]. Studies have shown that CAR is related to prognosis in different tumors [9–11].
The relation between CAR and the prognosis of EC has been investigated in several studies. For example, Ishibashi et al. [12] and Kunizaki et al. [13] reported that EC patients with a high pre-treatment CAR level had poor overall survival (OS) and cancer-specific survival (CSS). However, another study showed a different result that the prognosis of EC patients was not related to the pre-treatment CAR level [14]. Because the role of CAR in the prognosis of EC is still controversial, we meta-analyzed several independent studies investigating the prognostic role of CAR in EC.
Methods
Search strategy
For this meta-analysis, the PRISMA guidelines were followed [15]. PubMed, Embase and the Cochrane Library (last update by April 16, 2019) were used to search the literatures. C-Reactive Protein, Albumins and Esophageal Neoplasms were the Medical Subject Heading (MeSH) terms. The language was not restricted. The text of all retrieved literatures was read, and the reference lists were also searched to supply data.
Inclusion criteria
The included studies must meet the following criteria: (1) Studies investigated the role of CAR in the prognosis of EC; (2) Serum CRP and albumin levels were obtained prior to operation and chemotherapy; (3) The hazard ratio (HR) and 95% confidence intervals (CI) for survival were reported or could be figured out.
Data extraction
The first author’s surname, publication year, country, case number, pathological type, proportion of patients receiving neoadjuvant chemotherapy (NAC), tumor location, Tumor Node Metastasis (TNM) stage, length of follow-up, cut-off value, analysis method, HRs of CAR for survival and the corresponding 95% CIs were extracted. Compared with the results of univariate analyses, the results of multivariate analyses were prioritized because the latter adjusted the confounding factors.
Quality assessment
The quality of each included study was evaluated using the Newcastle-Ottawa Quality Assessment Scale (NOS). The score of NOS ranges from 0 to 9. A score above 5 represents high quality.
Statistical analysis
All enrolled studies defined high and low CARs using the optimal cut-off value. The prognostic value of CAR in EC patients was assessed by HR and 95% CI. When the HR and 95% CI was not directly reported, we figured out them from Kaplan-Meier survival curves using the method of Tierney [16]. When necessary, we e-mailed the corresponding author to get additional information or original data. Chi-square test and the I2 statistic were used to assess the heterogeneity [17, 18]. When there was significant heterogeneity (P value of chi-square test < 0.05 and/or I2 ≥ 25%), the random-effects model was used [19], otherwise the fixed-effects model was used [20]. Begg’s and Egger’s tests and funnel plot were used to assess the publication bias. When publication bias was observed (P values of Begg’s and Egger’s tests < 0.05 and/or the funnel plot was asymmetric), the “Trim and Fill” method was used to adjust the bias [21]. All analyses and figures were performed or generated using STATA version 12.0. A P value less than 0.05 represented statistical significance.
Results
Study characteristics
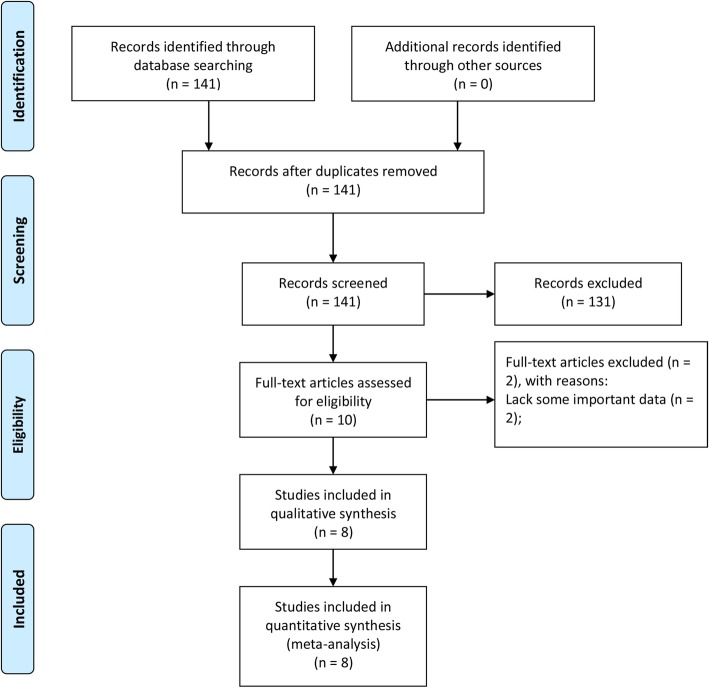
By retrieving the database, we initially identified 141 studies. After the preliminary screening, 131 studies were excluded because they did not investigate the role of CAR in the prognosis of EC, and then the remaining ten studies were assessed by reading the full text. Among these, two studies without some important data were excluded. Finally, eight studies with 2255 patients were included (Fig. 1) [12–14, 22–26]. Their mean score of NOS was 7 (range 5–9) (Table 1).
Fig. 1.
Flow diagram of the study selection process
Table 1.
Main characteristics of all studies included in the meta-analysis
| Study | Country | Case number | High expression (%) | Pathological type | NAC (%) | Location | Tumor stage | Follow-up (months) | Cut-off value | Multivariate analysis | HRs provided from | Outcome | NOS score |
|---|---|---|---|---|---|---|---|---|---|---|---|---|---|
| Ishibashi 2018 [12] | Japan | 143 | 75 (51.7) | Multiple | 72 (50.3) | 22/56/65 | 33/33/60/17 | NR | 0.085 | Yes/No | Report/SC | OS/CSS | 7 |
| Kunizaki 2018 [13] | Japan | 116 | 51 (44) | Squamous | NR | 15/31/19 | 0-II36/III-IV29 | Median 35.9 | 0.042 | Yes/No | Report/SC | OS/CSS | 7 |
| Otowa 2017 [14] | Japan | 149 | 114 (76.5) | Squamous | 149 (100) | 24/73/52 | IIA24/IIB36/III89 | NR | 0.03 | Yes | Report | OS | 6 |
| Shao 2015 [24] | China | 633 | 140 (22.1) | Squamous | 0 (0) | 33/428/172 | I106/IIa203/IIb92/III232 | Median 39 | 0.012 | Yes | Report | OS | 7 |
| Matsunaga 2019 [25] | Japan | 163 | 69 (42.3) | Multiple | 95 (58.3) | 32/86/45 | 012/I48/II45/III54/IV4 | NR | 0.0375 | No | SC | OS | 7 |
| Wei 2015 [22] | China | 423 | 147 (34.8) | Squamous | NR | 36/252/135 | 41/131/81/23 | Median 35.7 | 0.055 | Yes | Report | OS | 8 |
| Xu 2015 [23] | China | 468 | 87 (18.6) | Squamous | 0 (0) | 155/64/249 | I24/II181/IIIA121/IIIB+IIIC142 | Median 49.9 | 0.5 | Yes | Report | OS | 9 |
| Yu 2018 [26] | China | 160 | 85 (53.1) | Squamous | 0 (0) | 26/104/30 | I160 | Median 71.8 | 0.023 | Yes | Report | OS | 5 |
NAC neoadjuvant chemotherapy, NR not report, HR hazard ratio, SC survival curve, OS overall survival, CSS cancer-specific survival, NOS Newcastle-Ottawa Quality Assessment Scale
The main characteristics of included studies were showed in Table 1. The number of patients in each study ranged from 116 to 633. Patients came from two countries: China or Japan. Six studies included only ESCC, while other two studies included multiple pathological types of EC. In three studies, the proportion of patients receiving NAC was 0%, and in one study it was 100%. EC in each study was distributed in the upper, middle and lower segments of esophagus. All studies used the optimal cut-off values. Only two studies focused on patients’ CSS. HRs for OS were reported directly in seven studies. HRs for CCS in two studies were both estimated indirectly.
Overall survival
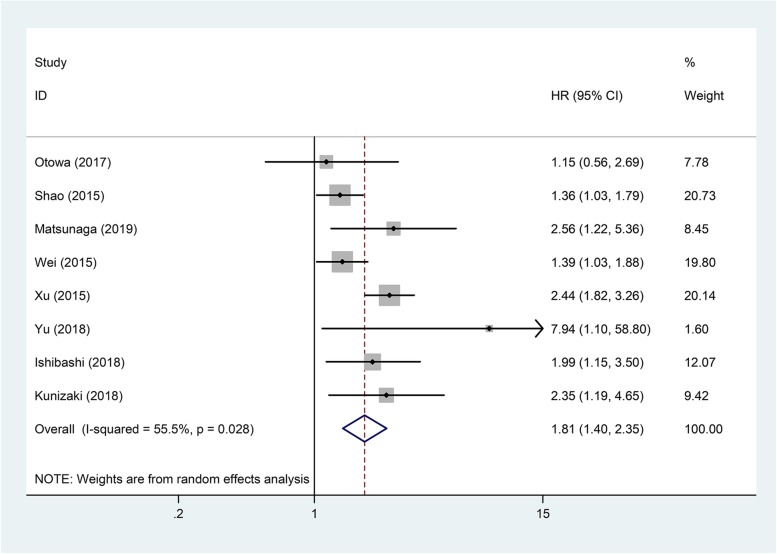
Table 2 showed the main results of pooled analyses. Eight articles with 2255 patients investigated the influence of CAR to OS in EC. Because there was significant heterogeneity among these studies (I2 = 55.5%, P = 0.028), a random-effects model was used for the pooled analysis. The result showed that high CAR was related to worse OS (pooled HR = 1.81; 95% CI = 1.40–2.35; P < 0.001) (Fig. 2). We further conducted subgroup analyses, sensitivity analysis and meta-regression to explore the sources of heterogeneity.
Table 2.
Pooled hazard ratios for OS and CSS according to subgroup analyses
| Outcome subgroup | Study number | Case number | HR (95%CI)-model | P value | Heterogeneity | |
|---|---|---|---|---|---|---|
| I2 (%) | P | |||||
| OS | 8 | 2255 | 1.81 (1.40–2.35)-random | < 0.001 | 55.5 | 0.028 |
| Country | ||||||
| Japan | 4 | 571 | 1.98 (1.41–2.77)-fixed | < 0.001 | 0 | 0.469 |
| China | 4 | 1684 | 1.76 (1.19–2.59)-random | 0.005 | 75.9 | 0.006 |
| Pathological type | ||||||
| Squamous | 6 | 1949 | 1.73 (1.26–2.38)-random | 0.001 | 65.0 | 0.014 |
| Multiple | 2 | 306 | 2.18 (1.40–3.40)-fixed | 0.001 | 0 | 0.597 |
| Proportion of NAC | ||||||
| 100% | 1 | 149 | 1.15 (0.56–2.69) | 0.715 | ||
| None | 3 | 1261 | 2.02 (1.13–3.62)-random | < 0.001 | 80.7 | 0.006 |
| Others | 4 | 845 | 1.79 (1.32–2.41)-random | < 0.001 | 25.5 | 0.259 |
| Cut-off value | ||||||
| < 0.04 | 4 | 1105 | 1.68 (1.03–2.73)-random | 0.037 | 46.6 | 0.132 |
| ≥ 0.04 | 4 | 1150 | 1.94 (1.41–2.69)-random | < 0.001 | 59.0 | 0.063 |
| CSS | 2 | 259 | 2.61 (1.67–4.06)-fixed | < 0.001 | 0 | 0.748 |
OS overall survival, CSS cancer-specific survival, NAC neoadjuvant chemotherapy, HR hazard ratio, CI confidence interval
Fig. 2.
Forest plot of studies evaluating the hazard ratio of high C-reactive protein/albumin ratio for overall survival of esophageal cancer patients
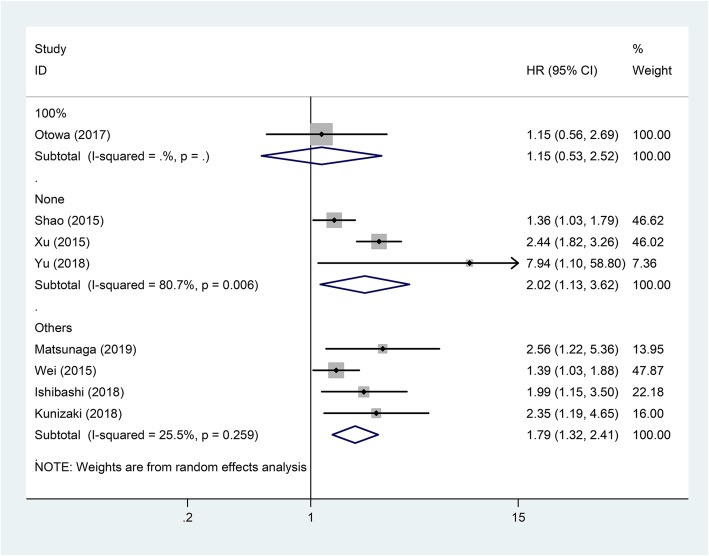
Subgroup analyses showed that the negative correlation between CAR and OS was consistently demonstrated in subgroups stratified by country, pathological type, and cut-off value (P < 0.05, Table 2). The relationship between CAR and OS was only affected by the proportion of patients receiving NAC. In subgroup of patients receiving NAC at a proportion of 100%, there was no relation between CAR and OS (HR = 1.15, 95% CI = 0.56–2.69; P = 0.715) (Fig. 3).
Fig. 3.
Forest plot of studies evaluating the hazard ratio of high C-reactive protein/albumin ratio for overall survival of esophageal cancer patients divided by the ratio of neoadjuvant chemotherapy
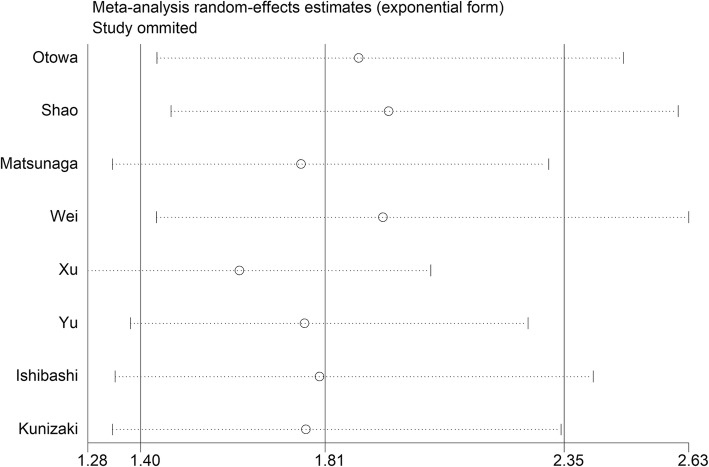
Sensitivity analysis showed that deletion of any study did not change the negative association between CAR and OS in EC (Fig. 4). Meta-regression showed that the pooled effect size was not significantly impacted by the country (P = 0.674), NAC rate (P = 0.585), pathological type (P = 0.481), and cut-off value (P = 0.518).
Fig. 4.
Sensitivity analysis of studies evaluating the relationship between C-reactive protein/albumin ratio and patients’ overall survival in esophageal cancer
Because the funnel plot was asymmetrical (Fig. 5), a publication bias existed among these studies even though the P values of Egger’s and Begg’s tests were both greater than 0.05. The “Trim and Fill” method was used to adjust the publication bias. After the adjustment, the pooled HR of CAR for OS in EC was 1.71 (95% CI = 1.33–2.21; P < 0.001).
Fig. 5.
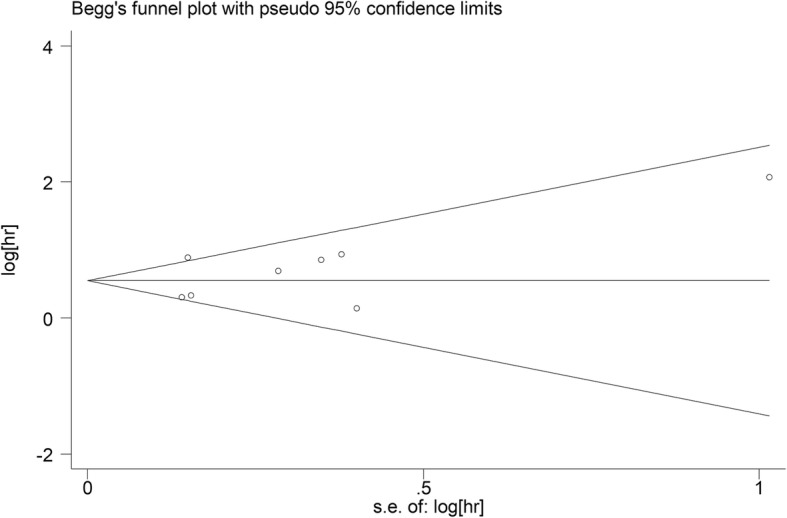
Funnel plot of publication bias for studies evaluating the relationship between C-reactive protein/albumin ratio and patients’ overall survival in esophageal cancer
Cancer-specific survival
Two studies with 259 patients investigated the influence of CAR to CSS in EC. Because there was no heterogeneity among these studies (I2 = 0%, P = 0.748), a fixed-effects model was used. The pooled analysis showed that high CAR was related to worse CSS in EC (pooled HR = 2.61; 95% CI = 1.67–4.06; P < 0.001) (Table 2; Fig. 6).
Fig. 6.
Forest plot of studies evaluating the hazard ratio of high C-reactive protein/albumin ratio for cancer-specific survival of esophageal cancer patients
Discussion
Recently, many studies have indicated that inflammation-based biological indicators for measuring the severity of systemic inflammatory reaction, such as CAR, Glasgow Prognostic Score (GPS), modified GPS (mGPS), neutrophil-to-lymphocyte ratio (NLR), and platelet-to-lymphocyte ratio (PLR), have prognostic value in various types of tumor, including EC [27–30]. Compared with other tumors, EC often causes difficulty in eating, so the proportion of malnutrition and cachexia in EC patients is relatively high. In addition, EC patients often receive multiple treatments such as chemotherapy, radiation therapy, and surgery. The inappetence and increased consumption caused by treatment will further aggravate the malnutrition. Low serum albumin level, as an indicator of malnutrition status, is associated with survival outcomes in EC [31, 32]. Therefore, CAR calculated from serum CRP and albumin concentrations is particularly suitable for assessing the prognosis of EC patients. In addition, CAR can influence the clinical decision-making of EC. Because patients with high CAR usually have severe tumor-related inflammatory reaction or poor nutritional status, these patients may benefit from anti-inflammatory therapy or nutritional support. In other words, anti-inflammatory therapy and nutritional support can be added to the individualized treatment regimen of EC patients with high CAR.
Besides CAR, GPS and mGPS are two other biological indicators based on serum CRP and albumin concentrations, which can also be used as independent prognostic factors in EC [24, 33]. GPS and mGPS are calculated by converting serum CRP and albumin concentrations into categorical variables, while CAR is directly calculated from numerical variables of serum CRP and albumin. Therefore, compared with GPS and mGPS, CAR is easier to apply. In addition, Shao et al. [24] found that most ESCC patients were allocated to the group of score 0 according to mGPS and GPS, but according to CAR, they can be evenly grouped. Therefore, CAR seems to have a wider clinical application than GPS and mGPS. Backward stepwise selection used in their study also demonstrated that the CAR, instead of GPS and mGPS, was chosen to build the best-fit prediction model. Furthermore, Liu et al. [34] also revealed that the CAR was superior to GPS and mGPS, because the CAR had a higher value of area under the curve (AUC).
The present meta-analysis, including cohort data of 2255 patients from 8 studies, provides strong evidence that a high pretreatment CAR is a predictor of poor survival for EC patients. Subgroup analyses showed that negative correlation between pretreatment CAR and OS was not affected by country, pathological type, or cut-off value. Only in subgroup of patients receiving NAC at a proportion of 100%, CAR had no influence to OS. In addition, this meta-analysis showed that high CAR was also related to worse CSS for EC patients.
This is the first meta-analysis focusing on the role of CAR in the prognosis of EC. However, some shortages of this meta-analysis should also be pointed out. First, this meta-analysis included only eight studies. The small number of included studies led to a lack of sufficient data to support the results of the subgroup analyses. For example, the result from the subgroup analysis based on NAC ratio showed that CAR was not associated with patients’ OS in subgroup of 100%, but this subgroup contained only one study, so the evidence may not be sufficient. Second, since the included studies were from China or Japan, ESCC was the most important type of EC in these two countries [35], so no studies have evaluated the role of CAR in the prognosis of esophageal adenocarcinoma alone. The subgroup analysis based on pathological type in this meta-analysis also did not contain adenocarcinoma subgroup. However, in North America and Europe, esophageal adenocarcinoma is the most important type of EC [35]. Therefore, our findings may be more applicable to EC patients in Asia than North America and Europe. Third, several HRs were from univariate analyses which may overestimate the effect size. Fourth, because the number of eligible studies was too small, a study with a NOS score of only 5 was also included in this meta-analysis, which reduced the quality of this meta-analysis to some extent. Finally, several HRs estimated from the survival curves may differ from the actual values.
Conclusion
Pre-treatment CAR is a novel and promising inflammation-based prognostic indicator for EC patients. Due to its simplicity, utility and economy, pre-treatment CAR may be an important factor in improving clinical decision-making of EC. Of course, our results also need to be validated by large-sample clinical trials.
Acknowledgements
Not applicable.
Abbreviations
- APR
Acute phase reactant
- CAR
C-reactive protein/albumin ratio
- CI
Confidence intervals
- CSS
Cancer-specific survival
- EC
Esophageal cancer
- ESCC
Esophageal squamous cell carcinoma
- HR
Hazard ratio
- IL-6
Interleukin-6
- MeSH
Medical subject heading
- NOS
Newcastle-Ottawa quality assessment scale
- OS
Overall survival
- TNM
Tumor node metastasis
Authors’ contributions
HTS and LYC conceived and designed the study. ZHL and HTS performed the analysis, prepared the figures and tables and wrote the main manuscript. All of the authors reviewed the manuscript. All authors read and approved the final manuscript.
Funding
Not applicable.
Availability of data and materials
Meta-analysis is a secondary analysis, which the data are all fully available without restriction, and all the material can be found in the included original studies.
Ethics approval and consent to participate
All analyses were based on previous published studies, thus no ethical approval and patient consent are required.
Consent for publication
Not applicable.
Competing interests
The authors declare that they have no competing interests.
Footnotes
Publisher’s Note
Springer Nature remains neutral with regard to jurisdictional claims in published maps and institutional affiliations.
Contributor Information
Zhenhua Liu, Email: 8841988@163.com.
Hongtai Shi, Phone: +86-515-81606112, Email: shiscar@163.com.
Longyun Chen, Phone: +86-515-81606112, Email: chenlongyun@yeah.net.
References
- 1.Siegel RL, Miller KD, Jemal A. Cancer statistics, 2017. CA Cancer J Clin. 2017;67(1):7–30. doi: 10.3322/caac.21387. [DOI] [PubMed] [Google Scholar]
- 2.Torre LA, Bray F, Siegel RL, Ferlay J, Lortet-Tieulent J, Jemal A. Global cancer statistics, 2012. CA Cancer J Clin. 2015;65(2):87–108. doi: 10.3322/caac.21262. [DOI] [PubMed] [Google Scholar]
- 3.Chen W, Zheng R, Zuo T, Zeng H, Zhang S, He J. National cancer incidence and mortality in China. Chin J Cancer Res. 2012;28(1):1–11. doi: 10.3978/j.issn.1000-9604.2016.02.08. [DOI] [PMC free article] [PubMed] [Google Scholar]
- 4.Weinhold B, Ruther U. Interleukin-6-dependent and -independent regulation of the human C-reactive protein gene. Biochem J. 1997;327(Pt 2):425–429. doi: 10.1042/bj3270425. [DOI] [PMC free article] [PubMed] [Google Scholar]
- 5.Fuhrman MP, Charney P, Mueller CM. Hepatic proteins and nutrition assessment. J Am Diet Assoc. 2004;104(8):1258–1264. doi: 10.1016/j.jada.2004.05.213. [DOI] [PubMed] [Google Scholar]
- 6.Kudou K, Saeki H, Nakashima Y, Kamori T, Kawazoe T, Haruta Y, Fujimoto Y, Matsuoka H, Sasaki S, Jogo T, et al. C-reactive protein/albumin ratio is a poor prognostic factor of esophagogastric junction and upper gastric cancer. J Gastroenterol Hepatol. 2019;34(2):355–363. doi: 10.1111/jgh.14442. [DOI] [PubMed] [Google Scholar]
- 7.Ren Y, Fan X, Chen G, Zhou D, Lin H, Cai X. Preoperative C-reactive protein/albumin ratio to predict mortality and recurrence of patients after curative resection with hepatocellular carcinoma. Med Clin. 2018. [DOI] [PubMed]
- 8.Miyamoto T, Fujitani M, Fukuyama H, Hatanaka S, Koizumi Y, Kawabata A. The C-reactive protein/albumin ratio is useful for predicting short-term survival in cancer and noncancer patients. J Palliat Med. 2018. [DOI] [PubMed]
- 9.He X, Li JP, Liu XH, Zhang JP, Zeng QY, Chen H, Chen SL. Prognostic value of C-reactive protein/albumin ratio in predicting overall survival of Chinese cervical cancer patients overall survival: comparison among various inflammation based factors. J Cancer. 2018;9(10):1877–1884. doi: 10.7150/jca.23320. [DOI] [PMC free article] [PubMed] [Google Scholar]
- 10.Haruki K, Shiba H, Horiuchi T, Sakamoto T, Gocho T, Fujiwara Y, Furukawa K, Misawa T, Yanaga K. Impact of the C-reactive protein to albumin ratio on long-term outcomes after hepatic resection for colorectal liver metastases. Am J Surg. 2017;214(4):752–756. doi: 10.1016/j.amjsurg.2017.02.001. [DOI] [PubMed] [Google Scholar]
- 11.Wu M, Guo J, Guo L, Zuo Q. The C-reactive protein/albumin ratio predicts overall survival of patients with advanced pancreatic cancer. Tumour Biol. 2016;37(9):12525–12533. doi: 10.1007/s13277-016-5122-y. [DOI] [PMC free article] [PubMed] [Google Scholar]
- 12.Ishibashi Y, Tsujimoto H, Hiraki S, Kumano I, Yaguchi Y, Horiguchi H, Nomura S, Ito N, Shinto E, Aosasa S, et al. Prognostic value of preoperative systemic Immunoinflammatory measures in patients with esophageal cancer. Ann Surg Oncol. 2018;25(11):3288–3299. doi: 10.1245/s10434-018-6651-y. [DOI] [PubMed] [Google Scholar]
- 13.Kunizaki M, Tominaga T, Wakata K, Miyazaki T, Matsumoto K, Sumida Y, Hidaka S, Yamasaki T, Yasutake T, Sawai T, et al. Clinical significance of the C-reactive protein-to-albumin ratio for the prognosis of patients with esophageal squamous cell carcinoma. Mol Clin Oncol. 2018;8(2):370–374. doi: 10.3892/mco.2017.1527. [DOI] [PMC free article] [PubMed] [Google Scholar]
- 14.Otowa Y, Nakamura T, Yamamoto M, Kanaji S, Matsuda Y, Matsuda T, Oshikiri T, Sumi Y, Suzuki S, Kakeji Y. C-reactive protein to albumin ratio is a prognostic factor for patients with cStage II/III esophageal squamous cell cancer. Dis Esophagus. 2017;30(12):1–5. doi: 10.1093/dote/dox107. [DOI] [PubMed] [Google Scholar]
- 15.Liberati A, Altman DG, Tetzlaff J, Mulrow C, Gotzsche PC, Ioannidis JP, Clarke M, Devereaux PJ, Kleijnen J, Moher D. The PRISMA statement for reporting systematic reviews and meta-analyses of studies that evaluate health care interventions: explanation and elaboration. J Clin Epidemiol. 2009;62(10):e1–34. doi: 10.1016/j.jclinepi.2009.06.006. [DOI] [PubMed] [Google Scholar]
- 16.Tierney JF, Stewart LA, Ghersi D, Burdett S, Sydes MR. Practical methods for incorporating summary time-to-event data into meta-analysis. Trials. 2007;8:16. doi: 10.1186/1745-6215-8-16. [DOI] [PMC free article] [PubMed] [Google Scholar]
- 17.Higgins JP, Thompson SG. Quantifying heterogeneity in a meta-analysis. Stat Med. 2002;21(11):1539–1558. doi: 10.1002/sim.1186. [DOI] [PubMed] [Google Scholar]
- 18.Higgins JP, Thompson SG, Deeks JJ, Altman DG. Measuring inconsistency in meta-analyses. BMJ. 2003;327(7414):557–560. doi: 10.1136/bmj.327.7414.557. [DOI] [PMC free article] [PubMed] [Google Scholar]
- 19.DerSimonian R, Laird N. Meta-analysis in clinical trials. Control Clin Trials. 1986;7(3):177–188. doi: 10.1016/0197-2456(86)90046-2. [DOI] [PubMed] [Google Scholar]
- 20.Mantel N, Haenszel W. Statistical aspects of the analysis of data from retrospective studies of disease. J Natl Cancer Inst. 1959;22(4):719–748. [PubMed] [Google Scholar]
- 21.Duval S, Tweedie R. Trim and fill: a simple funnel-plot-based method of testing and adjusting for publication bias in meta-analysis. Biometrics. 2000;56(2):455–463. doi: 10.1111/j.0006-341X.2000.00455.x. [DOI] [PubMed] [Google Scholar]
- 22.Wei XL, Wang FH, Zhang DS, Qiu MZ, Ren C, Jin Y, Zhou YX, Wang DS, He MM, Bai L, et al. A novel inflammation-based prognostic score in esophageal squamous cell carcinoma: the C-reactive protein/albumin ratio. BMC Cancer. 2015;15:350. doi: 10.1186/s12885-015-1379-6. [DOI] [PMC free article] [PubMed] [Google Scholar]
- 23.Xu XL, Yu HQ, Hu W, Song Q, Mao WM. A novel inflammation-based prognostic score, the C-reactive protein/albumin ratio predicts the prognosis of patients with operable esophageal squamous cell carcinoma. PLoS One. 2015;10(9):e0138657. doi: 10.1371/journal.pone.0138657. [DOI] [PMC free article] [PubMed] [Google Scholar]
- 24.Shao Y, Ning Z, Chen J, Geng Y, Gu W, Huang J, Pei H, Shen Y, Jiang J. Prognostic nomogram integrated systemic inflammation score for patients with esophageal squamous cell carcinoma undergoing radical esophagectomy. Sci Rep. 2015;5:18811. doi: 10.1038/srep18811. [DOI] [PMC free article] [PubMed] [Google Scholar]
- 25.Matsunaga T, Miyata H, Sugimura K, Motoori M, Asukai K, Yanagimoto Y, Takahashi Y, Tomokuni A, Yamamoto K, Akita H, et al. Prognostic significance of sarcopenia and systemic inflammatory response in patients with esophageal cancer. Anticancer Res. 2019;39(1):449–458. doi: 10.21873/anticanres.13133. [DOI] [PubMed] [Google Scholar]
- 26.Yu X, Wen Y, Lin Y, Zhang X, Chen Y, Wang W, Wang G, Zhang L. The value of preoperative Glasgow prognostic score and the C-reactive protein to albumin ratio as prognostic factors for long-term survival in pathological T1N0 esophageal squamous cell carcinoma. J Cancer. 2018;9(5):807–815. doi: 10.7150/jca.22755. [DOI] [PMC free article] [PubMed] [Google Scholar]
- 27.Nakamura M, Iwahashi M, Nakamori M, Ojima T, Katsuda M, Iida T, Hayata K, Kato T, Yamaue H. New prognostic score for the survival of patients with esophageal squamous cell carcinoma. Surg Today. 2014;44(5):875–883. doi: 10.1007/s00595-013-0628-z. [DOI] [PubMed] [Google Scholar]
- 28.Zhou X, Du Y, Huang Z, Xu J, Qiu T, Wang J, Wang T, Zhu W, Liu P. Prognostic value of PLR in various cancers: a meta-analysis. PLoS One. 2014;9(6):e101119. doi: 10.1371/journal.pone.0101119. [DOI] [PMC free article] [PubMed] [Google Scholar]
- 29.Kawashima M, Murakawa T, Shinozaki T, Ichinose J, Hino H, Konoeda C, Tsuchiya T, Murayama T, Nagayama K, Nitadori J, et al. Significance of the Glasgow prognostic score as a prognostic indicator for lung cancer surgery. Interact Cardiovasc Thorac Surg. 2015;21(5):637–643. doi: 10.1093/icvts/ivv223. [DOI] [PubMed] [Google Scholar]
- 30.Templeton AJ, McNamara MG, Seruga B, Vera-Badillo FE, Aneja P, Ocana A, Leibowitz-Amit R, Sonpavde G, Knox JJ, Tran B, et al. Prognostic role of neutrophil-to-lymphocyte ratio in solid tumors: a systematic review and meta-analysis. J Natl Cancer Inst. 2014;106(6):dju124. doi: 10.1093/jnci/dju124. [DOI] [PubMed] [Google Scholar]
- 31.Borda F, Borda A, Jimenez J, Zozaya JM, Prieto C, Gomez M, Urman J, Ibanez B. Predictive value of pre-treatment hypoalbuminemia in prognosis of resected colorectal cancer. Gastroenterol Hepatol. 2014;37(5):289–295. doi: 10.1016/j.gastrohep.2013.12.007. [DOI] [PubMed] [Google Scholar]
- 32.Crumley AB, Stuart RC, McKernan M, McMillan DC. Is hypoalbuminemia an independent prognostic factor in patients with gastric cancer? World J Surg. 2010;34(10):2393–2398. doi: 10.1007/s00268-010-0641-y. [DOI] [PubMed] [Google Scholar]
- 33.Lindenmann J, Fink-Neuboeck N, Avian A, Pichler M, Habitzruther M, Maier A, Smolle-Juettner FM. Preoperative Glasgow prognostic score as additional independent prognostic parameter for patients with esophageal cancer after curative esophagectomy. Eur J Surg Oncol. 2017;43(2):445–453. doi: 10.1016/j.ejso.2016.10.015. [DOI] [PubMed] [Google Scholar]
- 34.Liu X, Sun X, Liu J, Kong P, Chen S, Zhan Y, Xu D. Preoperative C-reactive protein/albumin ratio predicts prognosis of patients after curative resection for gastric cancer. Transl Oncol. 2015;8(4):339–345. doi: 10.1016/j.tranon.2015.06.006. [DOI] [PMC free article] [PubMed] [Google Scholar]
- 35.Rustgi AK, El-Serag HB. Esophageal carcinoma. N Engl J Med. 2014;371(26):2499–2509. doi: 10.1056/NEJMra1314530. [DOI] [PubMed] [Google Scholar]
Associated Data
This section collects any data citations, data availability statements, or supplementary materials included in this article.
Data Availability Statement
Meta-analysis is a secondary analysis, which the data are all fully available without restriction, and all the material can be found in the included original studies.


