

Abstract
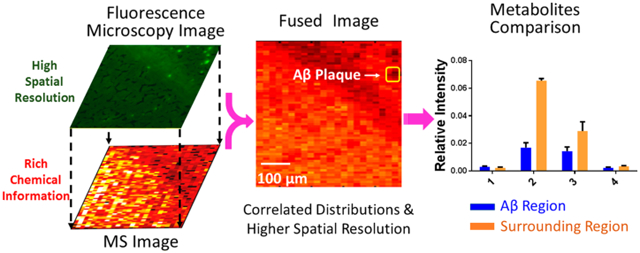
Alzheimer’s disease (AD) is one of the most common neurodegenerative diseases. The formation of amyloid plaques by aggregated amyloid beta (Aβ) peptides is a primary event in AD pathology. Understanding the metabolomic features and related pathways is critical for studying plaque-related pathological events (e.g., cell death and neuron dysfunction). Mass spectrometry imaging (MSI), due to its high sensitivity and ability to obtain the spatial distribution of metabolites, has been applied to AD studies. However, limited studies of metabolites in amyloid plaques have been performed due to the drawbacks of the commonly used techniques such as matrix-assisted laser desorption/ionization MSI. In the current study, we obtained high spatial resolution (~17 μm) MS images of the AD mouse brain using the Single-probe, a microscale sampling and ionization device, coupled to a mass spectrometer under ambient conditions. The adjacent slices were used to obtain fluorescence microscopy images to locate amyloid plaques. The MS image and the fluorescence microscopy image were fused to spatially correlate histological protein hallmarks with metabolomic features. The fused images produced significantly improved spatial resolution (~5 μm), allowing for the determination of fine structures in MS images and metabolomic biomarkers representing amyloid plaques.
Graphical Abstract
Alzheimer’s disease (AD) affects more than 5.3 million Americans, and it is the most common neurodegenerative disease causing cognitive impairment.1 There are two major pathologic features of AD: intracellular neurofibrillary tangles (NFTs), which are composed of hyperphosphorylated tau proteins, and extracellular plaques, which contain the aggregated β-amyloid peptide (Aβ).2 Although the mechanisms of plaque formation are still unclear, the most commonly accepted hypothesis is that Aβ is secreted into the extracellular space and aggregated to form amyloid plaques.3 Aβ plaques are believed to be toxic to neuron cells, both in vitro and in vivo,4 causing the symptom of AD such as cognitive impairment, oxidative damage, and inflammation.5,6 In the past decades, a large number of studies have focused on the Aβ plaques using genomics,7 proteomics,8 and metabolomics.9-12 At the gene level, the genes of β-amyloid precursor protein (APP) on chromosome 21 are highly expressed in Down’s syndrome patients (trisomy 21),13 and the duplication of the APP gene induces early onset AD.14 At the protein level, soluble oligomerized Aβs are regarded as the main cause of synaptic dysfunction instead of the Aβ monomer or larger aggregates.8 In addition, studying metabolomics, which directly reflects the status of cells,15 is essential to the research of AD. For example, certain metabolites, such as lipids,9 neurotransmitters,10 fatty acids,11 and glucose,12 are highly correlated with AD pathology, and they may play important roles in the development of the disease. The metabolomics studies in AD can significantly benefit the understanding of physiopathology, drug discovery, and related metabolite pathways.
High-resolution mass spectrometry (MS), with high sensitivity and wide ranges of molecular coverage, is one of the most important analytical methods to detect large numbers of metabolites from samples when coupling to separation techniques such as liquid chromatography (LC), gas chromatography (GC), and capillary electrophoresis (CE).16 However, because lysates need to be prepared from homogenized samples, the spatial distribution of metabolites, which is critical to understanding the complex biological process and the pathophysiology, is inevitably lost.17,18 Mass spectrometry imaging (MSI) is a powerful technique to acquire the spatial information on metabolites on a biological sample surface.18 Different MSI techniques, such as matrix-assisted laser desorption/ionization (MALDI),19 desorption electrospray ionization (DESI),20 secondary ion MS (SIMS),21 and nanospray desorption electrospray ionization (nano DESI),22 have been applied to study the metabolomics. Among these developed MS imaging methods, MALDI and SIMS are nonambient techniques, which have excellent spatial resolution and sensitivity, whereas DESI and nano-DESI belong to ambient sampling and ionization techniques, which require less or no sample preparation. In particular, MALDI has been implemented to analyze proteins, peptides, and metabolites in AD studies.9,23-28 However, because of the complex background of MALDI mass spectra in the low-mass range (<500 Da),29 this technique is generally less effective for measuring small but important molecules, including neurotransmitters,30 fatty acids,11 and phospholipids.24 In addition to MS imaging techniques, laser capture microdissection (LCM) coupled to MS has been used to isolate the region of interest in tissue and to determine the metabolite profiles.27
Here we utilized the Single-probe MSI technique to study the metabolites in both Aβ plaques and their surrounding regions. The Single-probe is a microscale sampling and ionization device that can be directly coupled to a mass spectrometer to conduct research in multiple fields, including live single-cell analysis,31-38 extracellular metabolites in spheroids,35 and the MSI of biological tissues.39-42 Because the Single-probe MSI technique is based on microliquid extraction without using a matrix (e.g., molecules involved in MALDI-MSI technique), a relatively clean background, particularly in the low-mass range, facilitates MSI studies of small molecules such as metabolites. To spatially correlate the metabolites with Aβ plaques, an image fusion method developed by Caprioli et al. for MALDI-TOF MSI,43 which has recently been implemented to DESI and nano-DESI MSI,44 was applied to fuse the images of the Single-probe MSI and fluorescence microscopy in this study. This combined method takes advantage of both techniques, that is, rich chemical information from MSI and high spatial resolution from the fluorescence microscopy image, to provide the metabolomic information correlated to Aβ plaques and improve our understanding of the pathways and functions of metabolites related to AD.
EXPERIMENTAL SECTION
Chemicals and Materials.
The chemicals used in the experiments include methanol, water (Sigma-Aldrich, St. Louis, MO), ethanol (Pharmco-AAPPER, Shelbyville, KY), xylene (Sigma-Aldrich, St. Louis, MO), and thioflavin S (Chem Cruz, Dallas, TX). The materials needed to fabricate the Single-probe include the fused capillary (O.D. 105 μm; I.D. 40 μm, Polymicro Technologies, Phoenix, AZ) and dual-bore quartz tubing (O.D. 500 μm; I.D. 127 μm, Friedrich & Dimmock, Millville, NJ).
The detailed fabrication protocol of the Single-probe was described in our previous work,32 and only the outlined procedures are provided here. The Single-probe has three components: a laser-pulled dual-bore quartz needle, a fused silica capillary (solvent-providing capillary), and a nano-electrospray (nano-ESI) emitter. A Sutter P-2000 laser micropipette puller (Sutter Instrument, Novato, CA) is used to prepare the dual-bore needle and the nano-ESI emitter. A Single-probe is fabricated by embedding within a dual-bore quartz needle with one fused silica capillary and one nano-ESI emitter.
Single-Probe MSI Setup.
The experiment setup is largely adopted from our previous MS single cell and MSI study45 (Figure S1). To precisely control the movement of the tissue slice, the sample was attached to an XYZ translational stage system (CONEX-MFACC, Newport, Irvine, CA) controlled using a LabView software package.46 A digital microscope was placed next to the Single-probe to adjust the distance between the Single-probe tip and the tissue slice surface and to monitor the sampling process. MS spectra were collected using a Thermo LTQ XL mass spectrometer (Thermo Scientific, Waltham, MA) with the following parameters: mass resolution 60 000 (m/Δm), 4.5 kV ionization voltage (both positive and negative ion mode), 1 microscan, 100 ms max injection time, and AGC on (5 × 10⁵). The sampling solvent (i.e., 85% methanol/15% water (v/v)) was continuously delivered (flow rate 200 nL/min) by a syringe pump (PHD ULTRA, Harvard Apparatus, Holliston, MA). Ions of interest were identified using tandem MS (MS2) directly on tissue slices, and results were compared with the database METLIN. The MS images of selected ions were generated using MSI QuickView software.46 More experimental details related to the current study are provided in the Supporting Information.
Animal Sample Preparation.
Animals used in this study were treated in accordance with the NIH Guide for the Care and Use of Laboratory Animals. All protocols were approved by the St. Jude Children’s Research Hospital ACUC under the IACUC protocol. Experiments were carried out in accordance with The Code of Ethics of the World Medical Association (Declaration of Helsinki) for animal experiments.
Two pairs of control (wild type) and 5xFAD mice (Tg (APPSwFlLon, PSEN1*M146L*L286V) 6799Vas) obtained from Jackson Laboratory (Bar Harbor, ME) were used in this study. Mice were housed in a temperature- and humidity-controlled room with a 12:12 h reversed light/dark cycle. Food and water were available ad libitum. All mice used in this study were sacrificed at 10–12 months old with weight between 23 and 25 g by cervical dislocation and decapitation. Brains were rapidly removed from the calvarias and immediately frozen on dry ice, then stored in 2 mL Eppendorf tubes at −80 °C until further experiments. Approximately 5 min per mouse was required for the brain collection.
Mouse brain was embedded in 10% HPMC ((hydroxypropyl)methyl cellulose, Sigma-Aldrich, St. Louis, MO), frozen on dry ice, sectioned into slices (~15 μm in thickness) using a cryotome (American Optical 845 Cryo-cut Microtome, Southbridge, MA) at −15 °C, and attached onto a microscope slide (VWR, Radnor, PA). The mouse brain slices were dried in air and stored at −80 °C before usage. The bright-field optical images of slices were taken using a PathScan Enabler IV histology slide scanner (Meyer Instruments, Houston, TX) prior to the MSI experiment. One tissue slide of each mouse brain sample was reported in each MSI study.
Fluorescence Microscopy Image.
The mouse brain slice adjacent to the one used for the MSI measurement of each brain sample was thawed at room temperature for 20 min before usage. The slices were fixed (in 75% ethanol for 1 min), stained (in 1% thioflavin S aqueous solution for 1 min), and differentiated (in 75% ethanol for 1 min) to remove excess fluorochrome. After that, the slices were dehydrated in a series of graded ethanol (95% ethanol twice, 100% ethanol twice, and 3–5 s for each step), cleared (in xylene for 5 min), and dried in the air. The stained slices were kept in a dark environment, and fluorescence microscope images were immediately taken using a Nikon Eclipse Ti–S fluorescence microscope (Melville, NY).
Data Preprocessing.
Before conducting the image fusion, the MSI data (.raw) need to be converted into an appropriate format that can be utilized in the Molecular Image Fusion software. The data preprocessing method is adopted from our previous publication,39 and a brief outline is provided here. First, the MSI data format was converted from .raw to .mzML using MSConvert (a tool in ProteoWizard) and further converted into .imzML format using the imzML Converter.47 Second, a built-in function of the MATLAB, Bioinformatics Toolbox, was implemented to achieve data preprocessing, including smoothing, noise removal, peak alignment, peak picking, and insensitivity normalization. Third, a data matrix was generated to represent the MS imaging data. For example, the data matrix of the positive MS image is composed of 2115 × 996, that is, 2115 pixels (141(scans/line) × 15 lines) with 996 aligned common ions. The number of pixels of each MS image depends on the size and the spatial resolution of the MS image. The details of data preprocessing are provided in the Supporting Information.
Image Fusion.
The image fusion was conducted using Molecular Image Fusion software.43,44 Six files, including microscope image data, microscope image information (pixel size, pixel number, and spatial resolution), MS image data, MS image information (pixel size, pixel number, and spatial resolution), fusion parameters, and registration information, were needed to conduct the image fusion. Among them, the MSI data matrix was achieved using data preprocessing, as previously mentioned, whereas the microscopy image data matrix and registration information were generated using an in-house developed MATLAB script. (Details are provided in the Supporting Information.)
Averaged MS Spectra and t Test.
On the basis of the fused image, the pixels representing Aβ plaques and their surrounding regions were manually selected from the MSI data set and averaged into two mass spectra, respectively, using an in-house-developed R script. To obtain the metabolites with significant differences between two regions, a t test was carried out using GraphPad.
RESULTS AND DISCUSSION
Fluorescence Microscopy Imaging of the Mouse Brain.
As a common fluorescence dye binding to Aβ plaques,48 thioflavin S was utilized to stain brain slices obtained from 5xFAD mice and from the littermate control group. Although thioflavin S labels both amyloid plaques and tau tangles, they can be readily distinguished based on their morphologies. Aβ plaques are extracellular, and they are larger with round structures; tau tangles are intraneuronal, and they are smaller with a flame shape.49 The fluorescence microscopy image shows that the Aβ aggregated areas are clearly illustrated as bright green dots on the slice of 5xFAD mouse brain (Figure 1A), but they are not observed in the control sample (Figure 1B). Previous studies indicate that the plaque size generally ranges from 10 to 80 μm with an average size of around 50–60 μm.50 In our studies, most plaques are <50 μm, indicating that high-spatial-resolution MSI techniques are needed to conduct experiments.
Figure 1.

Fluorescence microscopy images of brain slices of (A) 5xFAD and (B) control mice.
MSI of Mouse Brain and Image Fusion.
Previous studies indicate that Aβ plaques have relatively higher abundances in the hippocampus because APPs are transported to the nerve terminal in this region and further processed into Aβ.51 Thus we conducted MSI measurements of the selected small areas (e.g., 1 mm × 0.3 mm) on the brain slice containing the hippocampus. For example, a slice of whole mouse brain with AD (Figure 2A) containing the hippocampus, as shown in a zoomed-in picture (Figure 2B), was selected for the MSI experiments. The MSI experiments were conducted in both positive and negative ion modes to detect broader ranges of molecules. In the positive ion mode, a large number of lysophospholipids were observed, whereas in the negative ion mode, organic acids were primarily detected. The MS images of the selected metabolites were then constructed (Figure 2) to demonstrate their spatial distributions. For example, [PC(36:1) + H]+ (m/z 788.6137) and [PC(38:1) + H]+ (m/z 814.6292) were mainly distributed in the white matter, whereas [PC(38:4) + K]+ (m/z 848.5542) and [PC(38:6) + K]+ (m/z 844.5221) were primarily observed in the gray area. Similar results of a number of lipids were reported in previous studies.52,53 For example, Veloso et al.52 showed that PC(38:4) and PC(38:6) are more abundant in the gray matter, whereas PC(36:1) has a higher abundance in the white matter. MSI experiments of mice brain samples in the control group were also conducted (positive ion mode), and MS images of representative metabolites in the white and gray matter are provided in Figure S10. All metabolites were identified using MS2 from the tissue slice, and the results were compared with METLIN (Figure S11).
Figure 2.

Optical and MS images of FAD mouse brain. Optical image of (A) a coronal section of mouse brain and (B) the zoomed-in region containing the area for MSI measurement (enclosed in the red rectangle). MS images of (C) [PC(36:1) + H]+ and (D) [PC(38:1) + H]+) representing metabolites primarily distributed in the white matter. MS images of (E) [PC(38:4) + K]+ and (F) [PC(38:6) + K]+) representing metabolites primarily distributed in the gray matter. All metabolites were identified using MS2 from the tissue slice, and the results were compared with METLIN (Table S4).
To localize the area of the Aβ plaques, the adjacent slice was stained using thioflavin S, and the fluorescence microscopy image was taken to match the region measured in the MSI experiment (Figure 3A). Molecular Image Fusion software was employed to fuse the MS image and the corresponding fluorescence microscopy image, and the spatial resolution of MS images (~17 μm), which was determined based on a previously established method,54 has been increased to ~5 μm in the fused image (Figure 3C). (The characterization of the spatial resolution is provided in Figure S8.) For example, the fused images of [PC(34:1) + H]+ (m/z 760.5851) and [PC(38:8) + H]+ (m/z 834.5983) become sharper compared with their original MS images. High reconstruction rates (76.3–78.4%, Figure S2) indicate that the image fusion process is reliable and satisfactory (i.e., a reconstruction rate >75% is regarded as satisfied fusion43). In particular, the fused images correlate histological protein hallmarks with metabolomic features. We obtained a number of ions (e.g., [LPC(18:0) + H]+ (m/z 524.3693)) accumulated on Aβ plaques (i.e., bright spots on the fluorescence microscopy images).
Figure 3.

Fusion of the fluorescence microscopy image and the MS image. (A) Fluorescence microscopy image of a 5XFAD mouse brain slice stained using Thioflavin S. (B) Original MS images of metabolites ([PC(34:1) + H]+ (m/z 760.5851) (top), [PC(38:6) + H]+ (m/z 844.5218) (middle), and [LPC(18:0) + H]+ (m/z 524.3693) (bottom)) and (C) their fused images. All metabolites were identified using MS2 from the tissue slice, and the results were compared with METLIN (Figure S3).
Data Analysis.
To achieve a comprehensive analysis of MSI data representing Aβ plaques and their surrounding regions, a statistical data analysis was carried out. By comparing the fused image with the fluorescence microscope image (Figures 3A and 4A), multiple Aβ plaques were identified, and three of them were selected to determine the metabolites with significantly different abundances between Aβ plaques and their surrounding regions. On the basis of the fused image, pixels representing different regions were manually selected to generate the averaged mass spectra. For example, in region 1, the pixels encompassed by the blue rectangle represent the Aβ plaque, whereas those between the yellow and blue rectangles represent the surrounding region of the Aβ plaque. (Details of the pixel number selection are provided in Table S1.) An averaged mass spectrum of each region (Figure 4B) was generated using the corresponding MSI data, and ion intensities were normalized to the TIC (total ion current) of the average mass spectrum. The t test was conducted to determine the ions with significantly different abundances between Aβ plaques and their surrounding regions.
Figure 4.

Pixel selection and average spectra (MS positive ion mode). (A) Fused image and the pixels representing Aβ plaques and their surrounding region. (B) Averaged mass spectra of an Aβ plaque and its surrounding region.
Except for the example shown in Figure 4, two additional plaques were analyzed (Figure S6). Our results indicate that metabolites accumulated in Aβ plaques (Figure 5) are primarily lysophospholipids such as LPC (lysophosphatidylcholine) and LPG (lysophosphatidylglycerol). For example, the relative intensities of [LPC(16:0) + H]+ and [LPC(18:1) + H]+ were about 14 and 11 times higher in Aβ plaques than the surrounding regions, respectively. Previous studies demonstrate that lysophospholipids are mainly generated along with fatty acids through the hydrolyzation of membrane phospholipids.55 As bioactive lipid mediators, lysophospholipids play a variety of roles such as proliferation, differentiation, survival, migration, adhesion, invasion, and morphogenesis.56 However, lysophospholipids may potentially cause cell membrane disruption and ultimately lead to cell lysis due to their toxic detergent-like properties.57 Thus the change in lysophospholipid level may deter the fundamental functions of cell membrane such as ion transportation,58 molecule secretion,59 and membrane-related signal reception.60 According to previous studies of immunostaining of amyloid peptide in 5xFAD mice models, the accumulation of LPCs in the Aβ plaque is likely due to the hyperactivity of enzyme PLA2. (An enzyme directly converts phospholipids to lysophospholipids and fatty acids.)61 Kaya et al.62 also demonstrated that other lysophospholipids (e.g., LPC, lysophosphatidic acid (LPA), and lysophosphatidylethanolamine (LPE)) are aggregated in the plaque of the AD mice brain using the multimode MALDI-IMS technique. Furthermore, decreasing the overexpressed PLA2 is regarded as one of the goals in AD treatment. For example, the PLA2 inhibitor has been employed to treat Alzheimer’s disease.63 In fact, the reduction of PLA2 can ameliorate the cognitive deficits in a mouse model of AD.64
Figure 5.

Representative metabolites (MS positive ion mode) with significantly different abundances between Aβ plaques and their surrounding regions. Results were obtained from three Aβ plaques. The error bar indicates the standard deviation of the relative intensities obtained from the selected pixels. All metabolites were identified using MS2 from the tissue slice, and the results were compared with METLIN (Figure S3) (from t test: ***, <0.001).
In addition to LPCs, we discovered that the abundances of a number of other small molecules (e.g., spermine and arachidonic acid (AA)) are significantly different between plaques and their surrounding regions (Table S2). Spermine, which has the largest number of amine groups among three naturally occurring polyamines65 (i.e., spermine, spermidine, and putrescine), plays multiple important roles such as controlling gene express, stabilizing chromatin,66 and protecting replicating DNA from being damaged by singlet oxygen.67 The upregulation of spermine in plaques can be understood as a protective mechanism: Aβ is toxic to neurons through a free-radical-dependent oxidative mechanism,68 whereas increased polyamines can act as radical scavengers to neutralize free radicals generated by the Aβ and protect neurons.69,70 Another small molecule that accumulated in the Aβ plaque is AA, which is an essential omega-6 fatty acid critical for synaptic signaling, long-term potentiation, learning, and memory.71 Although AA can be generated from other sources, such as the hydrolysis of fatty acid amide hydrolase and monoacylglycerol lipase, the level of free AA in the brain is primarily determined by a specific form of PLA2, GIVA-PLA2.58 According to previous studies, the stimulation of Aβ results in an increased level of GIVA-PLA2 and further alters the amount of AA.72 For example, the upregulation of AA was previously reported in the APP-transferred PC12 cells73 and in the plaque region of the mouse using the PET (positron emission tomography).74
The MSI experiments were also conducted in the negative ion mode, and the area is 0.5 mm × 0.5 mm. The fluorescence microscopy image (Figure 6A) and the MS image (Figure 6B,C) were obtained from the AD mouse brain slice and fused using the procedures described above. Similar to the results acquired from the positive ion mode, metabolites exhibit different distribution features. For example, ([PA(O-32:0)-2H]2−) and dodecenoic acid ([M+K-2H]−) are primarily present in the white matter and gray matter, respectively (Figure 6D,E). Comparing the fused image with the fluorescence microscopy image, multiple Aβ regions were located, and two of them were selected to extract pixels representing Aβ plaques and their surrounding regions (Figure 7 and Figure S7). A number of metabolites (e.g., malic acid, glutamine, aspartic acid, and docosahexaenoic acid (DHA)) possess significantly different abundances between Aβ plaques and their surrounding regions (Table S3). For example, the relative ion intensity of glutamine is two times lower in the plaque region compared with its surrounding region (Figure 7B). Glutamine is an important amino acid for multiple processes, such as promoting and maintaining cell function.75 Glutamine is mainly produced by glutamine synthetase (GS), which converts glutamate and ammonium to glutamine.76 It was reported that intense oxidative stress is one of the important symptoms of the AD brain77,78 and is closely related to the Aβ.79,80 The oxidative stress leads to alterations of large numbers of molecular processes such as lipid peroxidation,81 DNA oxidation,82 and protein dysfunction.83 In particular, the activity of GS is significantly decreased due to the oxidative stress84,85 which may further result in the deactivation of GS in the Aβ region and lower the level of glutamine.
Figure 6.

Image fusion of fluorescence microscopy and MS images (MS negative ion mode). (A) Fluorescence microscopy image of 5xFAD mouse brain. (B) MS image of [PA(O-32:0)-2H]2− and (C) its fused image. (D) MS image of dodecenoic acid [M+K-2H]− and (E) its fused image.
Figure 7.

Pixel selection and ion abundance comparison (MS negative ion mode). (A) Pixels representing Aβ plaques and their surrounding areas in the fused images. (B) Representative metabolites possessing significantly different abundances between Aβ plaques and their surrounding regions (from t test: ***, < 0.001). All metabolites were identified using MS2 from the tissue slice, and the results were compared with METLIN (Figure S4).
The relative intensity of aspartic acid was about four times lower in Aβ plaques compared with the surrounding regions. A previous study revealed that the metabolic profiles of a number of amino acids and relevant molecules, including aspartic acid, alanine, serine, glycine and N-acetyl aspartic acid, were significantly altered in the mice during aging.86,87 For example, the level of aspartic acid is decreased in AD mice compared with control mice brain;87 this trend is similar to our results. The potential mechanism is likely related to the dysfunction of mitochondrial and hypometabolism in AD pathogenesis.88,89 In addition, our results indicate that the relative abundance of malic acid is ~1.5 times higher in plaque than in the surrounding region; the upregulation of malic acid in plaque was also reported in previous studies.90 As an important intermediate molecule, malic acid is involved in the Krebs cycle, mainly occurring in the mitochondria.91 Thus the alteration of malic acid is likely due to mitochondrial dysfunction and the decreased function of key enzymes in AD.92 In addition, the abundances of other metabolites, such as xanthine and DHA (Table S3), are also significantly different between the Aβ and surrounding regions, whereas the relevant mechanisms need to be further studied.
CONCLUSIONS
In this study, we utilized the Single-probe MSI technique to achieve high-resolution, ambient MS images of a mouse brain with Alzheimer’s disease in both negative and positive ion modes. Fluorescence microscopy images were obtained using the adjacent mouse brain slices to locate Aβ plaque positions. Image fusion was carried out to integrate fluorescence microscopy images (with higher spatial resolution) and MS images (with rich chemical information). In particular, the fused images can provide significantly improved spatial resolution of MS images, allowing for the correlation of histological hallmarks of Aβ plaques and their surrounding regions to their relevant metabolomic profiles. Our results indicate that a number of metabolites (e.g., lysophospholipids, spermine, AA, malic acid, glutamine, and aspartic acid) are abnormally expressed in Aβ plaques, and they are very likely related to the development of AD. Our method can potentially be used in other studies to illustrate the spatially resolved correlations between metabolites and potential biomarkers of diseases. The fully established methods may benefit the physiopathology, therapeutic resistance, and biomarker discovery.
Supplementary Material
ACKNOWLEDGMENTS
This research was supported by National Institutes of Health grants R01GM116116 (Z.Y.), R21CA204706 (Z.Y.), and R01AG047928 (J.P.). C.C.-H.’s lab was supported by the Ministry of Science and Technology (MOST), R.O.C. (grant no. MOST 108-2636-M-002-008-). We also thank Dr. Chuanbin Mao and Ningyun Zhou for helping us to use the fluorescence microscope.
Footnotes
Supporting Information
The Supporting Information is available free of charge on the ACS Publications website at DOI:10.1021/acs.analchem.9b02792.
Experimental details, supporting tables, and supporting figures (PDF)
The authors declare no competing financial interest.
REFERENCES
- (1).Kumar A; Singh A; Ekavali. Pharmacol. Rep 2015, 67 (2), 195–203. [DOI] [PubMed] [Google Scholar]
- (2).Gamblin TC; Chen F; Zambrano A; Abraha A; Lagalwar S; Guillozet AL; Lu M; Fu Y; Garcia-Sierra F; LaPointe N; Miller R; Berry RW; Binder LI; Cryns VL Proc. Natl. Acad. Sci. U. S. A 2003, 100 (17), 10032–10037. [DOI] [PMC free article] [PubMed] [Google Scholar]
- (3).Takahashi RH; Nagao T; Gouras GK Pathol. Int 2017, 67 (4), 185–193. [DOI] [PubMed] [Google Scholar]
- (4).Pike CJ; Walencewicz AJ; Glabe CG; Cotman CW Brain Res. 1991, 563 (1), 311–314. [DOI] [PubMed] [Google Scholar]
- (5).Takeda A; Aliev G; Atwood CS; Perry G; Smith MA; Petersen RB; Nunomura A; Balraj EK; Hirai K; Jones PK; Chiba S; Ghanbari H; Wataya T; Shimohama S J. Neuropathol. Exp. Neurol 2001, 60 (8), 759–767. [DOI] [PubMed] [Google Scholar]
- (6).Akiyama H; Barger S; Barnum S; Bradt B; Bauer J; Cole GM; Cooper NR; Eikelenboom P; Emmerling M; Fiebich BL; Finch CE; Frautschy S; Griffin WST; Hampel H; Hull M; Landreth G; Lue LF; Mrak R; Mackenzie IR; McGeer PL; O’Banion MK; Pachter J; Pasinetti G; Plata–Salaman C; Rogers J; Rydel R; Shen Y; Streit W; Strohmeyer R; Tooyoma I; Van Muiswinkel FL; Veerhuis R; Walker D; Webster S; Wegrzyniak B; Wenk G; Wyss–Coray T Neurobiol. Aging 2000, 21 (3), 383–421. [DOI] [PMC free article] [PubMed] [Google Scholar]
- (7).Selkoe DJ Neurol. Clin 2000, 18 (4), 903–921. [DOI] [PubMed] [Google Scholar]
- (8).Walsh DM; Townsend M; Podlisny MB; Shankar GM; Fadeeva JV; El Agnaf O; Hartley DM; Selkoe DJ J. Neurosci 2005, 25 (10), 2455–62. [DOI] [PMC free article] [PubMed] [Google Scholar]
- (9).Michno W; Kaya I; Nystrom S; Guerard L; Nilsson KPR; Hammarstrom P; Blennow K; Zetterberg H; Hanrieder J Anal. Chem 2018, 90 (13), 8130–8138. [DOI] [PubMed] [Google Scholar]
- (10).Nitsch RM Neurodegeneration 1996, 5 (4), 477–482. [DOI] [PubMed] [Google Scholar]
- (11).Söderberg M; Edlund C; Kristensson K; Dallner G Lipids 1991, 26 (6), 421. [DOI] [PubMed] [Google Scholar]
- (12).Hoyer S Eur. J. Pharmacol 2004, 490 (1–3), 115–25. [DOI] [PubMed] [Google Scholar]
- (13).Motte J; Williams RS Acta Neuropathol. 1989, 77 (5), 535–546. [DOI] [PubMed] [Google Scholar]
- (14).Prasher VP; Farrer MJ; Kessling AM; Fisher EMC; West RJ; Barber PC; Butler AC Ann. Neurol 1998, 43 (3), 380–383. [DOI] [PubMed] [Google Scholar]
- (15).Minchinton AI; Tannock IF Nat. Rev. Cancer 2006, 6 (8), 583–92. [DOI] [PubMed] [Google Scholar]
- (16).Major HJ; Williams R; Wilson AJ; Wilson ID Rapid Commun. Mass Spectrom 2006, 20 (22), 3295–302. [DOI] [PubMed] [Google Scholar]
- (17).Lee DY; Bowen BP; Northen TR BioTechniques 2010, 49 (2), 557–65. [DOI] [PMC free article] [PubMed] [Google Scholar]
- (18).Miura D; Fujimura Y; Wariishi H J. Proteomics 2012, 75 (16), 5052–60. [DOI] [PubMed] [Google Scholar]
- (19).Cornett DS; Reyzer ML; Chaurand P; Caprioli RM Nat. Methods 2007, 4, 828. [DOI] [PubMed] [Google Scholar]
- (20).Chen H; Pan Z; Talaty N; Raftery D; Cooks RG Rapid Commun. Mass Spectrom 2006, 20 (10), 1577–84. [DOI] [PubMed] [Google Scholar]
- (21).Passarelli MK; Winograd N Biochim. Biophys. Acta, Mol. Cell Biol. Lipids 2011, 1811 (11), 976–90. [DOI] [PMC free article] [PubMed] [Google Scholar]
- (22).Roach PJ; Laskin J; Laskin A Analyst 2010, 135 (9), 2233–6. [DOI] [PubMed] [Google Scholar]
- (23).Carlred L; Michno W; Kaya I; Sjovall P; Syvanen S; Hanrieder J J. Neurochem 2016, 138 (3), 469–78. [DOI] [PubMed] [Google Scholar]
- (24).Kaya I; Brinet D; Michno W; Baskurt M; Zetterberg H; Blenow K; Hanrieder J ACS Chem. Neurosci 2017, 8 (12), 2778–2790. [DOI] [PubMed] [Google Scholar]
- (25).Stoeckli M; Staab D; Staufenbiel M; Wiederhold K-H; Signor L Anal. Biochem 2002, 311 (1), 33–39. [DOI] [PubMed] [Google Scholar]
- (26).Strnad S; Prazienkova V; Sykora D; Cvacka J; Maletinska L; Popelova A; Vrkoslav V Talanta 2019, 201, 364–372. [DOI] [PubMed] [Google Scholar]
- (27).Xu BJ Proteomics: Clin. Appl 2010, 4 (2), 116–23. [DOI] [PubMed] [Google Scholar]
- (28).Kaya I; Michno W; Brinet D; Iacone Y; Zanni G; Blennow K; Zetterberg H; Hanrieder J Anal. Chem 2017, 89 (8), 4685–4694. [DOI] [PubMed] [Google Scholar]
- (29).Knochenmuss R; Dubois F; Dale MJ; Zenobi R Rapid Commun. Mass Spectrom 1996, 10 (8), 871–877. [DOI] [PubMed] [Google Scholar]
- (30).Francis PT CNS Spectrums 2005, 10 (S18), 6–9. [DOI] [PubMed] [Google Scholar]
- (31).Pan N; Rao W; Standke SJ; Yang Z Anal. Chem 2016, 88 (13), 6812–9. [DOI] [PMC free article] [PubMed] [Google Scholar]
- (32).Pan N; Rao W; Kothapalli NR; Liu R; Burgett AW; Yang Z Anal. Chem 2014, 86 (19), 9376–80. [DOI] [PubMed] [Google Scholar]
- (33).Sun M; Yang Z; Wawrik B Front. Plant Sci 2018, 9, 571. [DOI] [PMC free article] [PubMed] [Google Scholar]
- (34).Sun M; Yang Z Anal. Chem 2019, 91 (3), 2384–2391. [DOI] [PMC free article] [PubMed] [Google Scholar]
- (35).Sun M; Tian X; Yang Z Anal. Chem 2017, 89 (17), 9069–9076. [DOI] [PMC free article] [PubMed] [Google Scholar]
- (36).Standke SJ; Colby DH; Bensen RC; Burgett AWG; Yang Z Anal. Chem 2019, 91 (3), 1738–1742. [DOI] [PMC free article] [PubMed] [Google Scholar]
- (37).Liu R; Zhang G; Yang Z Chem. Commun 2019, 55, 616–619. [DOI] [PMC free article] [PubMed] [Google Scholar]
- (38).Zhu Y; Liu R; Yang Z Anal. Chim. Acta 2019, 1084, 53. [DOI] [PMC free article] [PubMed] [Google Scholar]
- (39).Tian X; Zhang G; Shao Y; Yang Z Anal. Chim. Acta 2018, 1037, 211–219. [DOI] [PMC free article] [PubMed] [Google Scholar]
- (40).Rao W; Pan N; Yang ZJ Visualized Exp. 2016, No. 112, No. e53911. [DOI] [PMC free article] [PubMed] [Google Scholar]
- (41).Rao W; Pan N; Tian X; Yang ZJ Am. Soc. Mass Spectrom 2016, 27 (1), 124–34. [DOI] [PMC free article] [PubMed] [Google Scholar]
- (42).Tian X; Zhang G; Zou Z; Yang Z Anal. Chem 2019, 91 (9), 5802–5809. [DOI] [PMC free article] [PubMed] [Google Scholar]
- (43).Van de Plas R; Yang J; Spraggins J; Caprioli RM Nat. Methods 2015, 12 (4), 366–72. [DOI] [PMC free article] [PubMed] [Google Scholar]
- (44).Chen C-L; Lin L-E; Huang Y-C; Chung H-H; Lin C-W; Chen K-C; Peng Y-J; Ding S-T; Shen T-L; Hsu C-C High Spatial Resolution Ambient Ionization Mass Spectrometry Imaging Using Microscopy Image Fusion Determines Tumor Margins. 2019, bioRxiv 657494. bioRxiv Preprint Server. https://www.biorxiv.org/content/10.1101/657494v4. [DOI] [PubMed] [Google Scholar]
- (45).Rao W; Pan N; Yang ZB J. Am. Soc. Mass Spectrom 2015, 26 (6), 986–993. [DOI] [PubMed] [Google Scholar]
- (46).Lanekoff I; Heath BS; Liyu A; Thomas M; Carson JP; Laskin J Anal. Chem 2012, 84 (19), 8351–8356. [DOI] [PubMed] [Google Scholar]
- (47).Race AM; Styles IB; Bunch J J. Proteomics 2012, 75 (16), 5111–5112. [DOI] [PubMed] [Google Scholar]
- (48).Urbanc B; Cruz L; Le R; Sanders J; Ashe KH; Duff K; Stanley HE; Irizarry MC; Hyman BT Proc. Natl. Acad. Sci. U. S. A 2002, 99 (22), 13990. [DOI] [PMC free article] [PubMed] [Google Scholar]
- (49).Liao L; Cheng D; Wang J; Duong DM; Losik TG; Gearing M; Rees HD; Lah JJ; Levey AI; Peng J J. Biol. Chem 2004, 279 (35), 37061–8. [DOI] [PubMed] [Google Scholar]
- (50).Sheikh AM; Nagai A FEBS J. 2011, 278 (4), 634–42. [DOI] [PubMed] [Google Scholar]
- (51).Buxbaum JD; Thinakaran G; Koliatsos V; O’Callahan J; Slunt HH; Price DL; Sisodia SS J. Neurosci 1998, 18 (23), 9629. [DOI] [PMC free article] [PubMed] [Google Scholar]
- (52).Veloso A; Fernandez R; Astigarraga E; Barreda-Gomez G; Manuel I; Giralt MT; Ferrer I; Ochoa B; Rodriguez-Puertas R; Fernandez JA Anal. Bioanal Chem 2011, 401 (1), 89–101. [DOI] [PubMed] [Google Scholar]
- (53).Yuki D; Sugiura Y; Zaima N; Akatsu H; Takei S; Yao I; Maesako M; Kinoshita A; Yamamoto T; Kon R; Sugiyama K; Setou M Sci. Rep 2015, 4, 7130. [DOI] [PMC free article] [PubMed] [Google Scholar]
- (54).Luxembourg SL; Mize TH; McDonnell LA; Heeren RMA Anal. Chem 2004, 76 (18), 5339–5344. [DOI] [PubMed] [Google Scholar]
- (55).Ross BM; Kish SJ J. Neurochem 1994, 63 (5), 1839–1848. [DOI] [PubMed] [Google Scholar]
- (56).Ishii I; Fukushima N; Ye X; Chun J Annu. Rev. Biochem 2004, 73 (1), 321–354. [DOI] [PubMed] [Google Scholar]
- (57).Weltzien HU Biochim. Biophys. Acta, Rev. Biomembr 1979, 559 (2), 259–287. [DOI] [PubMed] [Google Scholar]
- (58).Rustenbeck I; Lenzen S Cell Calcium 1992, 13 (4), 193–202. [DOI] [PubMed] [Google Scholar]
- (59).Soga T; Ohishi T; Matsui T; Saito T; Matsumoto M; Takasaki J; Matsumoto S.-i.; Kamohara M; Hiyama H; Yoshida S; Momose K; Ueda Y; Matsushime H; Kobori M; Furuichi K Biochem. Biophys. Res. Commun 2005, 326 (4), 744–751. [DOI] [PubMed] [Google Scholar]
- (60).Gräler MH; Goetzl EJ Biochim. Biophys. Acta, Mol. Cell Biol. Lipids 2002, 1582 (1), 168–174. [DOI] [PubMed] [Google Scholar]
- (61).Hong JH; Kang JW; Kim DK; Baik SH; Kim KH; Shanta SR; Jung JH; Mook-Jung I; Kim KP J. Lipid Res 2016, 57 (1), 36–45. [DOI] [PMC free article] [PubMed] [Google Scholar]
- (62).Kaya I; Zetterberg H; Blennow K; Hanrieder J ACS Chem. Neurosci 2018, 9 (7), 1802–1817. [DOI] [PubMed] [Google Scholar]
- (63).Clemens JA; Sofia MJ; Stephenson DT Use of PLA2 inhibitors As Treatment for Alzheimer’s Disease. U.S. Patent 5,478,857A, December 26, 1995.
- (64).Sanchez-Mejia RO; Newman JW; Toh S; Yu G-Q; Zhou Y; Halabisky B; Cissé M; Scearce-Levie K; Cheng IH; Gan L; Palop JJ; Bonventre JV; Mucke L Nat. Neurosci 2008, 11, 1311. [DOI] [PMC free article] [PubMed] [Google Scholar]
- (65).Muscari C; Guarnieri C; Stefanelli C; Giaccari A; Caldarera CM Mol. Cell. Biochem 1995, 144 (2), 125–129. [DOI] [PubMed] [Google Scholar]
- (66).Yatin SM; Yatin M; Varadarajan S; Ain KB; Butterfield DA J. Neurosci. Res 2001, 63 (5), 395–401. [DOI] [PubMed] [Google Scholar]
- (67).Khan AU; Mei YH; Wilson T Proc. Natl. Acad. Sci. U. S. A 1992, 89 (23), 11426. [DOI] [PMC free article] [PubMed] [Google Scholar]
- (68).Yatin SM; Yatin M; Aulick T; Ain KB; Butterfield DA Neurosci. Lett 1999, 263 (1), 17–20. [DOI] [PubMed] [Google Scholar]
- (69).Ha HC; Sirisoma NS; Kuppusamy P; Zweier JL; Woster PM; Casero RA Proc. Natl. Acad. Sci. U. S. A 1998, 95 (19), 11140. [DOI] [PMC free article] [PubMed] [Google Scholar]
- (70).Gilad GM; Gilad VH Exp. Neurol 1991, 111 (3), 349–355. [DOI] [PubMed] [Google Scholar]
- (71).Sanchez-Mejia RO; Mucke L Biochim. Biophys. Acta, Mol. Cell Biol. Lipids 2010, 1801 (8), 784–90. [DOI] [PMC free article] [PubMed] [Google Scholar]
- (72).Malaplate-Armand C; Florent-Bechard S; Youssef I; Koziel V; Sponne I; Kriem B; Leininger-Muller B; Olivier JL; Oster T; Pillot T Neurobiol. Dis 2006, 23 (1), 178–89. [DOI] [PubMed] [Google Scholar]
- (73).Chalimoniuk M; Stolecka A; Cakała M; Hauptmann S; Schulz K; Lipka U; Leuner K; Eckert A; Muller WE; Strosznajder JB Acta Biochim. Polym 2007, 54 (3), 611–623. [PubMed] [Google Scholar]
- (74).Esposito G; Giovacchini G; Liow JS; Bhattacharjee AK; Greenstein D; Schapiro M; Hallett M; Herscovitch P; Eckelman WC; Carson RE; Rapoport SI J. Nucl. Med 2008, 49 (9), 1414–21. [DOI] [PMC free article] [PubMed] [Google Scholar]
- (75).Newsholme P; Procopio J; Lima MM; Pithon-Curi TC; Curi R Cell Biochem. Funct 2003, 21 (1), 1–9. [DOI] [PubMed] [Google Scholar]
- (76).Robinson SR J. Neurosci. Res 2001, 66 (5), 972–980. [DOI] [PubMed] [Google Scholar]
- (77).Markesbery WR Free Radical Biol. Med 1997, 23 (1), 134–147. [DOI] [PubMed] [Google Scholar]
- (78).Nunomura A; Castellani RJ; Perry G; Zhu X; Smith MA; Moreira PI J. Neuropathol. Exp. Neurol 2006, 65 (7), 631–641. [DOI] [PubMed] [Google Scholar]
- (79).Swomley AM; Forster S; Keeney JT; Triplett J; Zhang Z; Sultana R; Butterfield DA Biochim. Biophys. Acta, Mol. Basis Dis 2014, 1842 (8), 1248–57. [DOI] [PMC free article] [PubMed] [Google Scholar]
- (80).Christen Y Am. J. Clin. Nutr 2000, 71 (2), 621S–629S. [DOI] [PubMed] [Google Scholar]
- (81).Butterfield DA; Lauderback CM Free Radical Biol. Med 2002, 32 (11), 1050–1060. [DOI] [PubMed] [Google Scholar]
- (82).Gabbita SP; Lovell MA; Markesbery WR J. Neurochem 1998, 71 (5), 2034–2040. [DOI] [PubMed] [Google Scholar]
- (83).Smith CD; Carney JM; Starke-Reed PE; Oliver CN; Stadtman ER; Floyd RA; Markesbery WR Proc. Natl. Acad. Sci. U.S. A 1991, 88 (23), 10540. [DOI] [PMC free article] [PubMed] [Google Scholar]
- (84).Emerit J; Edeas M; Bricaire F Biomed. Pharmacother 2004, 58 (1), 39–46. [DOI] [PubMed] [Google Scholar]
- (85).Castegna A; Aksenov M; Aksenova M; Thongboonkerd V; Klein JB; Pierce WM; Booze R; Markesbery WR; Butterfield DA Free Radical Biol. Med 2002, 33 (4), 562–571. [DOI] [PubMed] [Google Scholar]
- (86).Wang H; Lian K; Han B; Wang Y; Kuo SH; Geng Y; Qiang J; Sun M; Wang M J. Alzheimer′s Dis 2014, 39 (4), 841–8. [DOI] [PMC free article] [PubMed] [Google Scholar]
- (87).Oberg J; Spenger C; Wang FH; Andersson A; Westman E; Skoglund P; Sunnemark D; Norinder U; Klason T; Wahlund LO; Lindberg M Neurobiol. Aging 2008, 29 (9), 1423–33. [DOI] [PubMed] [Google Scholar]
- (88).Bubber P; Haroutunian V; Fisch G; Blass JP; Gibson GE Ann. Neurol 2005, 57 (5), 695–703. [DOI] [PubMed] [Google Scholar]
- (89).Yao J; Brinton RD Adv. Pharmacol 2012, 64, 327–71. [DOI] [PMC free article] [PubMed] [Google Scholar]
- (90).Xu J; Begley P; Church SJ; Patassini S; Hollywood KA; Jullig M; Curtis MA; Waldvogel HJ; Faull RL; Unwin RD; Cooper GJ Biochim. Biophys. Acta, Mol. Basis Dis 2016, 1862 (6), 1084–92. [DOI] [PMC free article] [PubMed] [Google Scholar]
- (91).Krebs H Perspect. Biol. Med 1970, 14 (1), 154–172. [DOI] [PubMed] [Google Scholar]
- (92).Gibson GE; Starkov A; Blass JP; Ratan RR; Beal MF Biochim. Biophys. Acta, Mol. Basis Dis 2010, 1802 (1), 122–34. [DOI] [PMC free article] [PubMed] [Google Scholar]
Associated Data
This section collects any data citations, data availability statements, or supplementary materials included in this article.