Abstract
Breast cancer is the most prevalent malignancy and second leading cause of death in women worldwide, with hormone receptor positive luminal breast cancers being the most widespread subtype. While these tumors are generally amenable to endocrine therapy, cellular heterogeneity and acquired ability of tumor cells to undergo cell state switching makes these populations difficult to be fully targeted and eradicated through conventional methods. We have leveraged a quality-by-design (QbD) approach that integrates biological responses with predictive mathematical modeling to identify key combinations of commercially available drugs to induce estrogen receptor expression for therapeutic targeting. This technology utilizes a high level of automation through a custom-built platform to reduce bias as well as design-of-experiments methodology to minimize the experimental iterations required. Utilizing this approach, we identified a combination of clinical compounds, each at concentrations well below their efficacious dose, able to induce the expression of estrogen receptor alpha (ESR1) in hormone positive breast cancer cells. Induction of ESR1 in luminal cells leads to chemosensitization. These findings provide proof of concept for the utility of the QbD strategy and identify a unique drug cocktail able to sensitize breast cancer cells to tamoxifen.
Keywords: estrogen receptor, luminal, tamoxifen, breast cancer, chemosensitization
Introduction
The American Cancer Society estimates 252,710 women and 2,470 men will be diagnosed with invasive breast cancer in the United States each year, with approximately 41,070 associated deaths. Approximately 80% of breast cancers are invasive or infiltrating, and as such often metastasize to the lungs and brain (Society, 2017). Although breast cancer is referred to as a single disease, there are up to 21 distinct histological subtypes and at least four molecular subtypes that differ in terms of risk factors, presentation, response to treatment, and outcomes (Dieci et al., 2014, Tamimi et al., 2012). Due to the complexity of the disease, breast cancers are routinely classified by stage, pathology, grade, and expression of estrogen receptor (ER), progesterone receptor (PR), or human epidermal growth factor receptor (Her2/neu), and multiple therapies have been designed around these receptors (Dent et al., 2007, Jemal et al., 2011).
The luminal A breast cancer subtype makes up around 70% of diagnosed cases in the United States (Society, 2017). It is positive for estrogen receptor (ER) and progesterone receptor (PR) expression, but negative for the human epidermal growth factor receptor 2 (Her2) oncogene. Standard of care for patients with luminal types of breast cancer is endocrine therapy, e.g. with tamoxifen. Since its introduction, tamoxifen has been widely used in both pre- and post-menopausal ER-positive breast cancer patients (Normanno et al., 2005). Tamoxifen and its active metabolite 4-OH tamoxifen, belong to the selective estrogen receptor modulator (SERM) family and block estrogen receptor alpha (ESR1, ERα) in breast tissue, consequently inhibiting cell growth. Although it has emerged as an efficacious treatment, tamoxifen does not adequately target all luminal breast cancer cells. Due to intrinsic heterogeneity of cancer cells, specifically in their expression of estrogen receptor, ER-negative cells are able to escape and cause subsequent relapse (Lindstrom et al., 2018, Weaver, 2014). The importance of this therapeutic evasion is further underscored by a recent multivariable analysis which showed ER-positive breast cancer patients with high intra-tumoral heterogeneity of ER had a two-time greater risk of long term fatal breast cancer regardless of receiving tamoxifen treatment (Lindstrom et al., 2018).
Breast cancers, including the luminal subtype, evolve rapidly in situ and result in enhanced cellular and molecular response mechanisms. These are a major barrier to the development of durable therapies. Research throughout the field has characterized a landscape of genetic and epigenetic alterations that are the basis in the development of next generation targeted therapies (Alvarez et al., 2010, Baudino, 2015). Despite initial successes in the identification of new therapeutic targets, these targets have limited clinical efficacy, offering little to no survival or outcome benefit over conventional cytotoxic therapies.
To investigate multiple candidate chemotherapies simultaneously and to overcome the limitations of single-pathway therapeutic strategies, we utilized a novel systems oncology-based method using design-of-experiments (DoE) approach. DoE relies on Quality by Design (QbD) fundamentals, a systemic method to product development that begins with pre-defined objectives. It emphasizes product and process understanding, commonly utilized by the FDA in guidance to the pharmaceutical industry (Yu et al., 2014). Through this approach we identified a group of compounds which together are able to induce ESR1 expression despite each being administered at sub pharmacologic effective doses. Following pre-treatment with this cocktail of drugs, luminal breast cancer cells were sensitized to the conventional endocrine therapy drug tamoxifen.
Methods
Cell Culture
MDA-MB-231, MCF7, and T47D breast cancer cells (American Type Culture Collection, Manassas, VA, USA) were cultured in log-growth phase in Dulbecco’s modified Eagle’s medium (DMEM/mammary epithelial cell growth medium; Lonza, Basel, Switzerland) with 10% heat-inactivated fetal bovine serum (unless otherwise noted) at 37 °C in a humidified atmosphere (5% CO2).
Cell Proliferation
Cells were plated following 48 hour incubation with phenol red free media, as phenol red has weak estrogen activity, containing 10% heat inactivated charcoal/dextran treated fetal bovine serum (HyClone) to remove estrogen from the serum. Cells were plated in 96-well plates at 1000 cells/well and pre-treated for 3 days with either media containing the BEPP combination consisting of 27nM belinostat, 2nM everolimus, 1pM paclitaxel, and 10nM pictilisib (GDC-0941) or containing 1% DMSO vehicle control. On day 3, cells were treated with 1μM or 5μM 4-hyrdroxytamoxifen (4-OH tamoxifen, Sigma Aldrich) for an additional 7 days. Cells were lysed with CellTiter-Glo® Luminescent Cell Viability Assay reagent (Promega) and luminescence was recorded at day 0, 3, 7, and 10 of the study and percent cell viability was calculated relative to vehicle treated cells and normalized to the day 0 reading.
Estradiol Studies
Cells were plated following 48 hour incubation with phenol red free media containing 10% heat inactivated charcoal/dextran treated fetal bovine serum (HyClone) in 96-well plates at 1000 cells/well and pre-treated for 3 days with either media containing BEPP or containing 1% DMSO vehicle control. On day 3, cells were treated with 100nM 17-Beta estradiol (Sigma Aldrich) alone or 17-Beta estradiol and 1μM or 5μM 4-OH tamoxifen for 72 hours. Cells were subsequently lysed with CellTiter-Glo® and analyzed as above. Percent cell viability was calculated relative to vehicle treated cells.
Flow Cytometry Analysis
Following 3 days pre-treatment with BEPP or vehicle, MCF7, T47D, and MDA-MB-231 cells were treated with 1μM and 5μM 4-OH tamoxifen (Sigma Aldrich) for an additional 7 days, lifted with Accutase (Corning) and counted. Cells were stained for 30 minutes at room temperature (RT) with a fixable UV-Live/Dead dye (Thermo Scientific), washed twice with 2% BSA in PBS, and stained using the FITC Annexin V/Dead Cell Apoptosis Kit with FITC Annexin V and PI for flow cytometry (Invitrogen) following the manufacturer’s protocol as written. Appropriate isotype control antibodies and live/dead dyes were used to set gates. Data analysis was performed using the FlowJo software v10.
Immunofluorescence Staining
MCF7 and MDA-MB-231 cells were seeded onto coverslips and following 3 days treatment with vehicle or BEPP, were fixed in 4% paraformaldehyde (PFA) in PBS (VWR). Cells were incubated for 10 minutes at room temperature (RT) washed and permeabilized with blocking buffer containing 3% goat serum and 0.3% Triton X-100 (Fisher Scientific) for an additional 15 minutes at RT. Cells were washed 3 times with PBS and incubated overnight at 4C with anti-Estrogen Receptor antibody (ab16660, 1:1000). Following 3 washes, cell were incubated at RT for 1 hour with FITC labeled secondary antibody (1:2000, Thermo Scientific), washed and stained with DAPI dye (1:1000, Thermo scientific) for 10 min at room temperature in the dark, and mounted in FluorSave Reagent (CalBiochem). Slides were imaged at 20x and analyzed using high-throughput automated single-cell imaging analysis (HASCIA), which was described previously (Chumakova et al., 2019). HASCIA image processing script and ImageJ v1.52k were used to obtain single-cell measurements of marker intensity. Using the HASCIA web-app, the expression was normalized to DNA intensity, and relative expression difference between groups was assessed using t-test.
Protein Extraction and Western Blot Analysis
Cell lysates (20μg total protein) were resolved by 10% sodium dodecyl sulfate-polyacrylamide gel electrophoresis and semi-dry transferred to PVDF membrane. After blocking, membranes were incubated overnight at 4 °C with primary antibodies against estrogen receptor alpha (AbCam, 1:1000) and Cyclophillin B (Cell Signaling, 1:5,000), followed by incubation with secondary anti-mouse or anti-rabbit immunoglobulin G (IgG) antibodies conjugated to horseradish peroxidase (Jackson ImmunoResearch, after incubating with Pierce ECL plus (Thermo Scientific).
RNA Extraction and PCR Analysis
Total cell mRNA was extracted using the Nucleospin RNA Plus kit according to manufacturer instructions (Takara). Nanodrop was used to measure the absorption at 260/280 nm to assess the quality and quantity of the collected RNA. Subsequently, the RNA was transcribed to first strand cDNA using the First Strand cDNA Synthesis Kit (Primscript TakaraBio) for gene expression analysis. Primers were designed for selected transcripts (GAPDH-forward: TGCACCACCAACTGCTTAGC, GAPDH-reverse: GGCATGGACTGTGGTCATGAG, ESR1-forward: 5’ACTACCTGGAGAACGAGCCC 3’, ESR1-reverse: 5’CCTTGGCAGACTCCATGATC 3’) and real time polymerase chain reaction (qPCR) was performed with SYBR® Green I master mix (Applied Biosystems). The relative expression of the transcripts was calculated using the 2ΔΔ CT method.
Statistical analysis
All the experiments presented were run in triplicate, unless otherwise indicated. The values reported in the results are mean values ± standard deviation. One-way analysis of variance was used to calculate the statistical significance, p values are detailed in the text and figure legends.
Drug Matrix and DoE Design
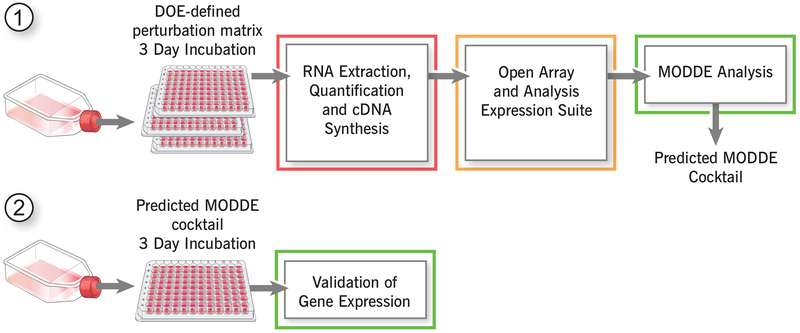
A series of complex multidimensional experiments were conducted by Trailhead Biosystems. A perturbation matrix was generated using robotic liquid handling system for 96 conditions, each condition representing different combinations of 12 drugs/effectors tested 0–10nM pictilisib/GDC-0941, 0–2nM everolimus, 0–27nM belinostat, 0–1pM paclitaxel, 0–6nM PF03084014, 0–5nM ABT888, 0–50nM PD173074, 0–3nM jakafi, 0–20μM zoledronate, 0–0.3μM CBL0137, 0–0.4μM WWL123, and 0–0.1nM SB743921. Following 72 hours of matrix treatment, luminal MCF7 breast cancer cells were analyzed by quantitative polymerase chain reaction (qPCR) using the QuantStudio flex open array containing the following 53 candidate target genes: ABCB1, ABCG2, AXIN2, BCL2L11, BIRC5, BMI1, BRCA1, CASP3, CCNB2, CD24, CD44, CHEK1, CTNNB1, HSPA5, ID1, ITGA6, ITGB1, ITGB3, MDM2, MK167, MUC1, NANOG, NFE2L2, NFKB1, NOTCH3, PCNA, POU5F1, PTCH1, PYGO1, DUSP6, ELF5, EPCAM, ERBB2, ESR1, ESR2, ETV4, FGF2, FGF4, FGFR1, FGFR2, FGFR4, FOXA1, GATA3, HES1, HIF1A, RBBP5, SOD1, SOX2, STAT3, STAT5A, TNFSF10, TP53, XBP1. This generated >5000 data points (96 samples × 56 genes). Data were analyzed by the MODDE software package (Sartorius). Each response was fitted to a PLS statistical regression model for analyzing effectors and multifactor interactions for each gene using MVDA-maximizing Q2 and R2 values. We then extracted conditions for maximizing expression of ESR1 (Figure 1).
Figure 1. Design-of-Experiment approaches to identify points of fragility for breast cancer targeting.
Schematic depicting the proposed QbD workflow. This experimental paradigm has been previously developed by Trailhead Biosystems to assess cell-type specific differentiation from pluripotent stem cells.
Results
DoE Factors and ESR1 response global model fitting
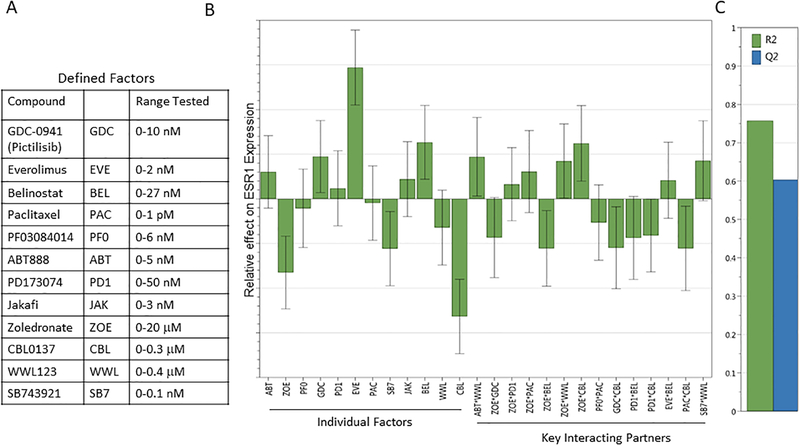
Twelve commercially available standard-of-care chemotherapeutics and inhibitory compounds against known pathways were selected to test their efficacy in MCF7 cells (Figure 2A). These inhibitors were used at 0.1x of the reported half maximal inhibitory concentrations (IC50) in breast cancer cell lines. As a readout, we chose 53 target gene candidates based on their published involvement in self-renewal and therapeutic resistance pathways in breast cancer cell. Each gene response model contained between 12 and 23 mathematical terms (primary terms and pathway interaction terms) and each effector’s relative contribution on the gene set was assessed, leading to an impact-table for each breast cancer cell line, which could be used to build a model to assess individual and combinatorial effects of each inhibitor compound on gene expression. Although multiple gene expression profiles became candidates for exploration through this approach (Supplemental Figure 1), we focused on estrogen receptor alpha (ESR1) as the best clinical target for our study (Figure 2B).
Figure 2. DoE Factors and ESR1 response global model fitting.
Using the defined factors at the indicated concentration ranges (A) and ESR1 as the response target, global model fitting was performed to optimize the R2/Q2 ratio. (B) The graph depicts individual factor contribution and key interacting partners and their effects on ESR1 expression allowing for optimal predictive model fitting.
A key aspect in global model fitting is the Q2/R2 ratio. Q2 estimates the predictive ability of the model (significance is defined as a value from 0–1), and R2 is the fraction of variance of the response explained by the model (a value of 1 shows an exact fit). Using the data collected from the DoE approach, less important interacting partners are excluded until an optimal Q2/R2 ratio is achieved, resulting in a model that can be utilized to predict effects of specific compound combinations on specific target genes. The model that is generated through iterative optimization can be significantly different depending on the target gene selected. The final model for ESR1 included all inhibitor compounds individually, as well as statistically significant combinations thereof (Figure 2B), each with their effects on overall ESR1 expression levels.
The optimal inhibitor combination for maximal ESR1 expression is identified through MODDE software dynamic profile analysis
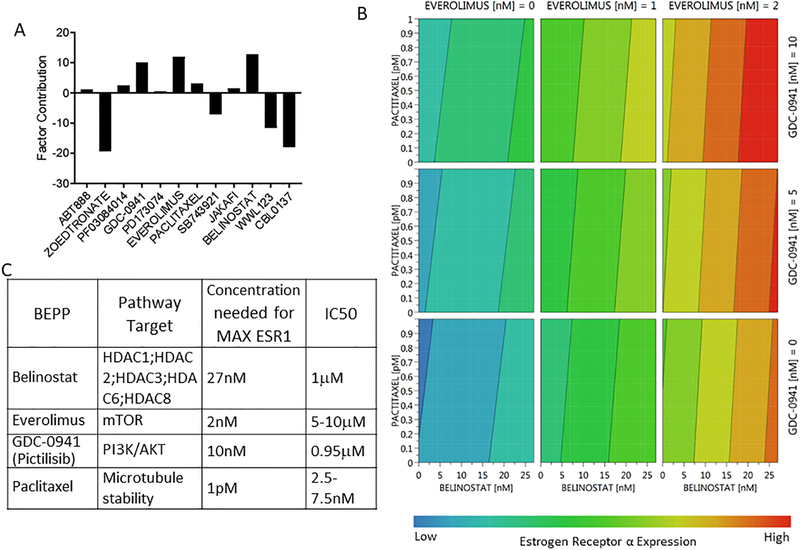
The overall impact of individual factors was determined by the collective coefficient magnitude on ESR1 expression levels in MCF7 cells. The higher the value, the more contribution the individual factor has on overall ESR1 expression (Figure 3A). We determined the most effective contributors to ESR1 expression of the compounds tested in MCF7 cells were zoledronate, pictilisib, everolimus, paclitaxel, SB743921, belinostat, WWL123, and CBL0137. Although these compounds are all key contributors, some (zoledronate, SB743921, WWL123, and CBL0137) are predicted repressors resulting in a decrease of ESR1 expression therefore are required to be absent. Other compounds (belinostat, everolimus, paclitaxel, and pictilisib) are predicted enhancers and therefore are required to be present for maximal ESR1 expression in MCF7 cells. Thus, to achieve the maximum level of ESR1 in MCF7 cells, the optimal drug cocktail includes belinostat, everolimus, paclitaxel, and pictilisib. Interaction analysis revealed that the effects of these compounds on ESR1 expression are additive, not cooperative, which is demonstrated in the contour plot (Figure 3B). These findings suggest that all four drugs must be added to MCF7 cells at specific concentrations to achieve the maximum ESR1 expression (red). The contour plot also suggests that when treating with these drugs individually or in a two- or three-part combination, maximum ESR1 expression is not achieved. The optimal four drug cocktail, referred to as BEPP in rest of manuscript, consisted of 27nM belinostat, 2nM everolimus, 1pM paclitaxel and 10nM pictilisib (Figure 3C). Importantly, the optimal concentrations for induction of ESR1 expression were well below or at their respective inhibitory concentrations (IC50) (Jordan et al., 2014, Junttila et al., 2009, Reshkin et al., 2003).
Figure 3. The MODDE software dynamic profile of tested clinically relevant inhibitors.
Following treatment with the perturbation matrix PCR data was analyzed through MODDE software. (A) Multiple compounds had key factor contributions to ESR1 expression such as zoledronate, pictilisib, everolimus, SB743921, belinostat, WWL123, and CBL0137. Compounds that decreases ESR1 expression are shown as negative and those that increase ESR1 expression are shown as positive. (B) The four compounds predicted to increase ESR1 expression were analyzed using a 4D contour plot to assess their individual and combined effects over the concentrations tested. This plot shows that for the maximal ESR1 response (red) all 4 compounds must be used together. (C) The specific MODDE predicted drug cocktail BEPP is outlined showing specific pathway targets, each concentration needed to achieve maximal ESR1 expression and the reported IC50.
Validation of the DoE defined drug cocktail, BEPP, in vitro
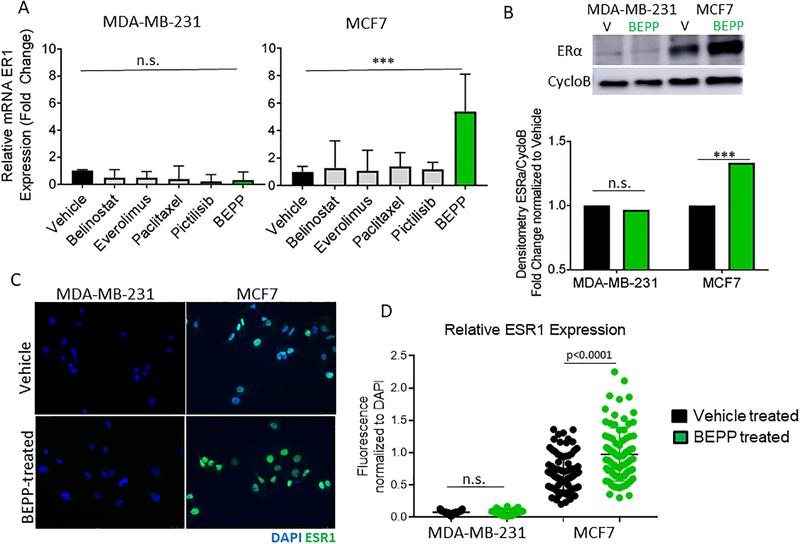
ESR1 mRNA levels were increased following BEPP treatment in MCF7 cells but were not increased in MDA-MB-231 TNBC cells based on real-time qPCR analysis (Figure 4A). As TNBC do not express ESR1, BEPP was not able to increase estrogen receptor in these cells. Additionally, MCF7 and MDA-MB-231 cells treated with each individual component of BEPP showed no significant difference in ESR1 expression when compared to vehicle controls, further validating the prediction that all BEPP components are needed to achieve maximal ESR1 expression. To validate whether BEPP treatment resulted in a difference at the protein level, we incubated MCF7 and MDA-MB-231 cells with either vehicle or BEPP for 3 days followed by ESR1 Western blot (Figure 4B) and immunofluorescence analysis (Figure 4C, D) for ESR1 expression. BEPP induced a significant increase in ESR1 expression in the luminal MCF7 by both Western blot of total cell lysate and intracellular immunofluorescence staining. As expected, the TNBC cell line MDA-MB-231 did not show a significant change when compared to vehicle control samples.
Figure 4. Validation of the DoE-defined MODDE drug cocktail, BEPP.
(A) MDA-MB-231 and MCF7 cells were treated with vehicle, BEPP, or each component individually. qPCR results confirm that the highest ESR1 expression was achieved with BEPP treatment in MCF7 cells. Following treatment with BEPP or vehicle, MDA-MB-231 and MCF7 cells were analyzed by western blot (B) and immunofluorescence staining (C and D) for estrogen receptor alpha (ERα) expression. MCF7 cells exhibited an increase in ERα expression following BEPP treatment (green) compared to vehicle (black), whereas ERα expression in MDA-MB-231 cells did not change in both western blot and immunofluorescence staining analysis. *** p<0.001 **p<0.01 *p<0.05 n.s-not significant
BEPP pre-treatment enhances estradiol-induced proliferation and the effect of 4-OH tamoxifen treatment
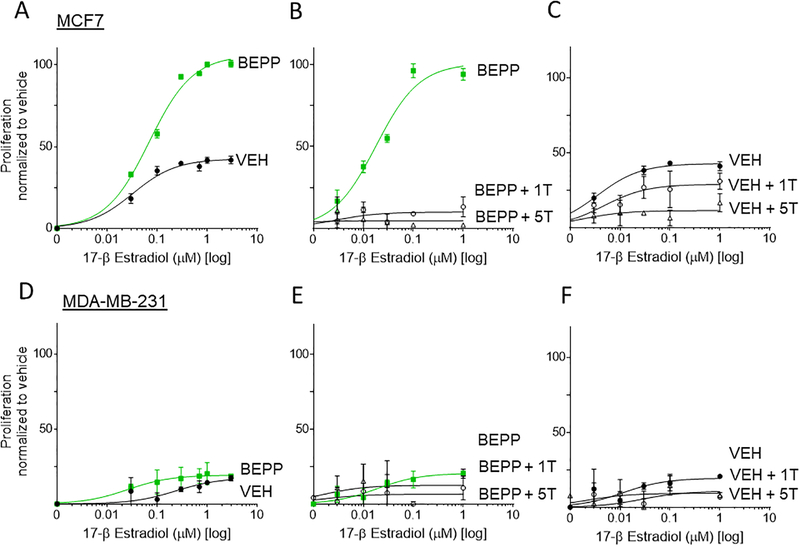
To ensure that BEPP pre-treatment results in an increase in functional estrogen receptor expression, and to determine the effect of tamoxifen treatment in the presence of the estrogen receptor ligand 17- β Estradiol (E2), MCF7, T47D, and MDA-MB-231 cells were incubated with 0–3 μM E2 for 72 hours following BEPP or vehicle pre-treatment alone or in the presence of 1μM or 5μM 4-OH tamoxifen. In MCF7 cells, response to E2 treatment was enhanced by BEPP as evidenced by a decreased EC50 (30 nM in BEPP group as compared to 60nM in the vehicle) and increased overall proliferation levels (~2-fold change in the BEPP group as compared to vehicle) (Figure 5A). Furthermore, when MCF7 cells were co-treated with E2 and either 1μM or 5μM 4-OH tamoxifen, proliferation levels were attenuated in the BEPP group compared to vehicle (Figure 5B, C). As expected, MDA-MB-231 cells did not exhibit an increase in proliferation when treated with E2 in BEPP or vehicle pre-treatment conditions (Figure 5D), and no significant changes were observed with the addition of either 1μM or 5μM 4-OH tamoxifen co-treatment (Figure 5D, E). In further support of this effect of BEPP pre-treatment on ER positive breast cancer, similar results were observed in another luminal A breast cancer cell line, T47D (Supplemental Figure 2).
Figure 5. MCF7 and T47D Cell Proliferation is increased following 17-β Estradiol treatment and is attenuated by 4-OH tamoxifen addition following BEPP pre-treatment.
Following pre-treatment with either BEPP (BEPP) or vehicle (VEH), MCF7 cells were incubated in phenol-red free media with 17-β Estradiol Alone (E2), E2 and 1μM 4-OH tamoxifen (1T), or E2 and 5μM 4-OH tamoxifen (5T). (A) BEPP pre-treated MCF7 cells exhibit increased proliferation when treated with E2 compared to vehicle pre-treated cells. Proliferation is attenuated in BEPP pretreated cells (B) and to a lesser extent in vehicle pretreated cells (C) upon E2 and 1μM or 5μM tamoxifen co-treatment compared to E2 treatment alone. (D) BEPP pre-treated MDA-MB-231 cells exhibit no significant difference in proliferation when treated with E2 compared to vehicle pre-treated cells. Proliferation is also not changed in BEPP pretreated cells (E) or vehicle pretreated cells (F) upon E2 and 1μM or 5μM tamoxifen co-treatment compared to E2 treatment alone.
Luminal breast cancer cells are sensitized to tamoxifen following BEPP pre-treatment.
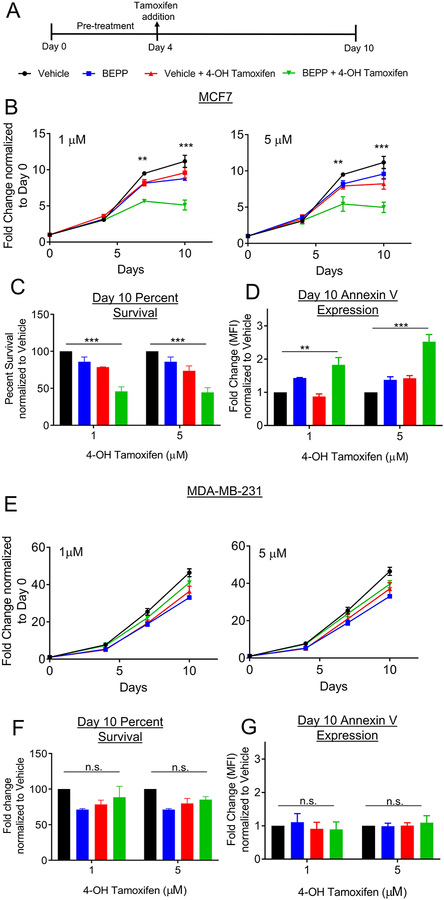
We next sought to test the hypothesis that increased expression of ESR1 would sensitize the cells to 4-OH tamoxifen and whether these findings are translatable to additional luminal and TNBC breast cancer cell lines. Following three days of co-culture with BEPP or vehicle, MCF7, T47D, and MDA-MB-231 cells were treated with 1μM or 5μM 4-OH tamoxifen for an additional 7 days (Figure 6A). A luminescence assay measuring the number of viable cells was used to follow changes in cell proliferation throughout the course of the experiment, while apoptosis was measured by Annexin V flow cytometry analysis. Luminal breast cancer MCF7 (Figure 6B) and T47D (Supplemental Figure 3) cells pre-treated with BEPP exhibited attenuated cell proliferation after 1μM and 5μM 4-OH tamoxifen treatment when compared to vehicle pre-treatment. By day 10, MCF7 cells had an overall 50% decrease in survival (Figure 6C) and a significant increase in Annexin V expression, (Figure 6D) in both 1 μM and 5 μM 4-OH tamoxifen treatment groups when compared to vehicle controls. Additionally, MCF7 and T47D cells receiving BEPP alone throughout in the absence of 4-OH tamoxifen treated were not significantly affected when compared to vehicle controls. As expected, TNBC cell line MDA-MB-231 did not show any change in sensitization to 4-OH tamoxifen upon BEPP pre-treatment (Figure 6E–G).
Figure 6. Luminal breast cancer cells are sensitized to tamoxifen following BEPP pre-treatment.
(A) Following 3 days of pretreatment with BEPP or vehicle, MCF7 and MDA-MB-231 cells were treated with 1 or 5 μM 4-OH tamoxifen for an additional 7 days and analyzed at predetermined time points by CellTiter-Glo®. (B) MCF7 cells exhibited decreased proliferation following treatment with 1μM (left) or 5μM (right) 4-OH tamoxifen after pre-treatment with BEPP (green) when compared to cells pre-treated with vehicle before 4-OH tamoxifen (red), or cells treated with vehicle (black) or BEPP (blue) alone throughout. At day 10, overall survival (C) was decreased in BEPP pretreated cells and Annexin V expression levels (D) were increased in BEPP pretreated cells when compared to the other three groups. (E) MDA-MB-231 cells exhibited no significant differences in proliferation following treatment with 1μM (left) or 5μM (right) 4-OH tamoxifen after pre-treatment with BEPP (green), pre-treated with vehicle before 4-OH tamoxifen (red), or cells treated with vehicle (black) or BEPP (blue) alone throughout. At day 10, overall survival (F) and Annexin V expression (G) were not significantly altered in BEPP pretreated cells when compared to the other three groups. *** p<0.001 **p<0.01 *p<0.05 n.s-not significant
Discussion
While computational-aided multi-drug therapeutic strategies have been described in the literature, previously reported methods are resource-consuming and only analyze a small subset of compound combinations. Furthermore, these studies only analyze a single pathway, reporting combinatorial drug effects on one or two targets such as overall proliferation or cell survival (Brandl et al., 2014, Ji et al., 2017, Sima et al., 2018). In this study, we introduce the use of a novel systems oncology-based QbD approach in targeting hormone-positive breast cancer cells that overcomes the limitations of single-pathway therapeutic strategies. Instead of identifying new drugs with novel cancer targeting properties, we investigated a pool of known drugs and sought to find a combination that would minimize cellular heterogeneity in order to drive cancer cells to a state more amenable to conventional cytotoxic therapy, ultimately reducing resistance and recurrence. We demonstrate the ability of a novel drug cocktail, BEPP, consisting of belinostat, everolimus, paclitaxel, and pictilisib, to increase ESR1 expression leading to enhanced 4-OH tamoxifen sensitivity in hormone receptor-positive breast cancer cell lines.
This type of study is practically achievable through the power of a DoE approach. DoE is a fundamental part of QbD and is used in the engineering and manufacturing industries to study the complex relationships between the output of a process and the input factors and how this impacts the manufacturing process. In biologic systems, which are inherently more complex than any manufactured device, the biologic inputs and outputs are interconnected in complex ways by diverse second messengers and signaling molecules. Yet, the traditional paradigm for assessing cellular response is mainly based on single pathway interrogation. As biologic systems, specifically the multiple compensatory mechanisms available to a cancer cell, are not governed by single pathways but rather complex interacting networks, it is not surprising that single drug therapies are often inadequate for effectively eradicating cancer cells in a given patient. Compounding the challenge of multiple pathways is the multiplicity of cell states in cancer populations and the ability of cells to freely change states. Yet, defining specific, targeted, efficacious therapies represents the goal of precision medicine in cancer care.
QbD offers a next-generation approach in how new cancer drug therapies can be discovered. This study provides a proof of principle of this approach. DoE allows us to rapidly identify individual cell states while providing a highly predictive assessment of conditions that control such states. This approach facilitates the systematic determination of relationships between the output of a process (transcriptome signatures reflecting the cell state) and the input factors impacting the process. This allows us to develop a therapeutic strategy based on cell state control to achieve increased tumor cell homogeneity that can be targeted with standard-of-care chemotherapy. Using a cellular model of breast cancer, our study reveals a novel combination of four FDA approved drugs that are able to enhance ESR1 expression greater than any one drug alone.
Combination therapies are one strategy to increase treatment efficacy, as they act on multiple interconnected and independent signaling pathways concurrently. The success in treatment of HIV/AIDS was obtained from a combinatorial solution rather than a single compound, and this is likely to be applicable to many advanced cancers where single-agent targeted therapies have not been clinically impactful. In addition, combination therapy can enable greater treatment efficacy without the need to find new drugs. While the pipeline from discovery of a novel compound to the establishment of human safety to its prescribing is time-consuming and expensive, a combination therapy of well-studied compounds may allow for expedited study. In our drug cocktail BEPP, all of the FDA-approved compounds are well-studied and characterized in the literature for use in breast cancer treatment individually. At therapeutic doses, belinostat is a HDAC inhibitor being explored to target specific steps in the estrogen receptor signaling pathway; everolimus has been shown to inhibit the mTOR pathway, a key pathway in breast cancer tumorigenesis; paclitaxel targets fast dividing cells by interfering with the normal breakdown of microtubules during cell division; Pictilisib, or GDC-0941, is an inhibitor of the PI3K pathway, which in concert with mTOR and Akt plays a critical role in endocrine therapy resistance in breast cancer (Renoir et al., 2013, Royce and Osman, 2015, Sarker et al., 2015, Thomas et al., 2013).
Combination therapy also has the great advantage of allowing clinically significant low doses for each of the drugs, reducing individual side effects and the risk of drug-drug interactions. In our study, the concentration required for maximal ESR1 expression is significantly below the IC50 reported for each of the drugs. Since the side effects of these drugs is generally dose-dependent, it is reasonable to assume that such low doses of each of the compounds would have a lower rate of adverse side effects overall. Further, 95% cell death was observed when cells utilized throughout this study were treated with the IC50 reported for each compound (data not shown).
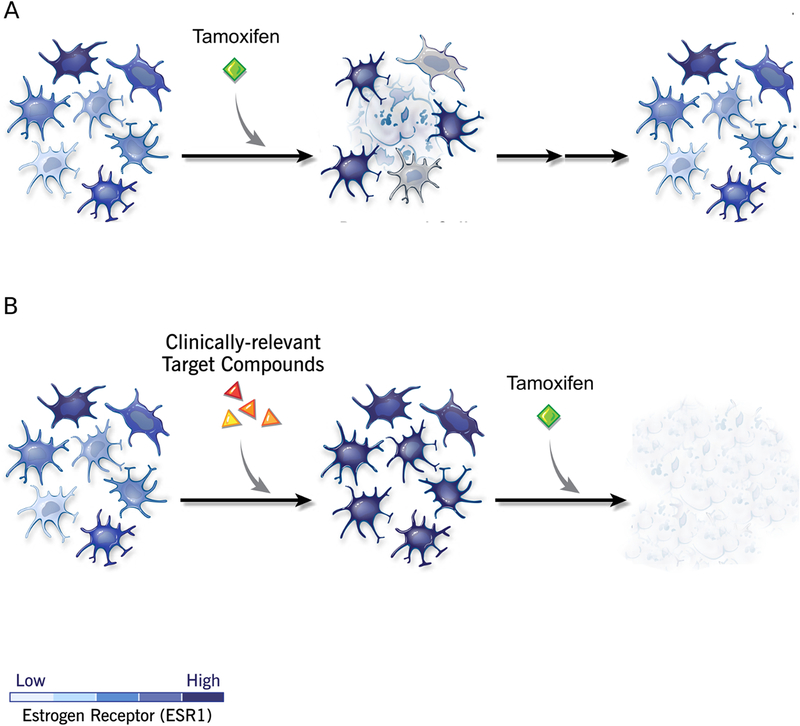
In conclusion, we provide a proof-of-principle of how a QbD approach can be used to discover a novel combinatorial strategy for cancer chemo sensitization, and we report one such novel combination therapy, BEPP, which enhances 4-OH tamoxifen treatment specifically of a hormone receptor positive breast cancer cell line (Figure 7). This approach represents a paradigm shift in experimental design with the ultimate goal of rapid translation of low-dose drug combinations that are safe and efficacious in sensitizing cancer cells in a multi-phase approach to treating luminal breast cancer.
Figure 7. Model of strategy to reduce cell states for increased targeting efficiency.
Heterogeneous populations of cancer cells are treated with varying doses of clinically relevant small molecule inhibitors. The optimal combination of therapeutic drugs is obtained to promote cell differentiation to a homogeneous state that can be targeted for cell killing.
Supplementary Material
Supplemental Figure 1. Heat map denoting the effect of factor compound treatments on tested gene responses in MCF7 cells.
Supplemental Figure 2. Following pre-treatment with either BEPP or vehicle (VEH), MDA-MB-231 cells were incubated in phenol-red free media with 17-β Estradiol Alone (E2), E2 and 1μM 4-OH tamoxifen (1T), or E2 and 5uM 4-OH tamoxifen (5T). (A) BEPP pre-treated T47D cells exhibit increased proliferation when treated with E2 compared to vehicle pre-treated cells. Proliferation is attenuated in BEPP pretreated cells (B) and to a lesser extent in vehicle pretreated cells (C) upon E2 and 1μM or 5μM tamoxifen co-treatment compared to E2 treatment alone.
Supplemental Figure 3. (A) Following 3 days of pretreatment with BEPP or vehicle, cells were treated with 5uM 4-OH Tamoxifen for an additional 7 days and analyzed at pre-determined time points by CellTiter-Glo®. (B) T47D cells exhibited decreased proliferation following treatment with 1uM or 5uM 4-OH Tamoxifen after pre-treatment with BEPP (green) when compared to cells pre-treated with vehicle before 4-OH Tamoxifen (red), or cells treated with vehicle (black) or BEPP (blue) alone throughout. At day 10, overall survival (B) was decreased in BEPP pretreated cells and Annexin V expression levels (C) were increased in BEPP pretreated cells when compared to the other three groups. *** p<0.001 **p<0.01 *p<0.05 n.s-not significant
Funding and Acknowledgements
This work was partially funded by National Institutes of Health grant CA191263 (O.R. and J.D.L.) and the Cleveland Clinic Lerner Research Institute Chair’s Innovation Award (O.R., J.D.L, and J.J.). We would like to thank members of the Lathia and Reizes laboratories for critical insights and reviews of the manuscript.
Footnotes
Declaration of Interest
There are no conflicts of interest to report.
References
- ALVAREZ RH, VALERO V & HORTOBAGYI GN 2010. Emerging targeted therapies for breast cancer. J Clin Oncol, 28, 3366–79. [DOI] [PubMed] [Google Scholar]
- BAUDINO TA 2015. Targeted Cancer Therapy: The Next Generation of Cancer Treatment. Curr Drug Discov Technol, 12, 3–20. [DOI] [PubMed] [Google Scholar]
- BRANDL MB, PASQUIER E, LI F, BECK D, ZHANG S, ZHAO H, KAVALLARIS M & WONG ST 2014. Computational analysis of image-based drug profiling predicts synergistic drug combinations: applications in triple-negative breast cancer. Mol Oncol, 8, 1548–60. [DOI] [PMC free article] [PubMed] [Google Scholar]
- CHUMAKOVA AP, HITOMI M, SULMAN EP & LATHIA JD 2019. High-Throughput Automated Single-Cell Imaging Analysis Reveals Dynamics of Glioblastoma Stem Cell Population During State Transition. Cytometry A, 95, 290–301. [DOI] [PMC free article] [PubMed] [Google Scholar]
- DENT R, TRUDEAU M, PRITCHARD KI, HANNA WM, KAHN HK, SAWKA CA, LICKLEY LA, RAWLINSON E, SUN P & NAROD SA 2007. Triple-negative breast cancer: clinical features and patterns of recurrence. Clin Cancer Res, 13, 4429–34. [DOI] [PubMed] [Google Scholar]
- DIECI MV, ORVIETO E, DOMINICI M, CONTE P & GUARNERI V 2014. Rare breast cancer subtypes: histological, molecular, and clinical peculiarities. Oncologist, 19, 805–13. [DOI] [PMC free article] [PubMed] [Google Scholar]
- JEMAL A, BRAY F, CENTER MM, FERLAY J, WARD E & FORMAN D 2011. Global cancer statistics. CA Cancer J Clin, 61, 69–90. [DOI] [PubMed] [Google Scholar]
- JI Z, SU J, WU D, PENG H, ZHAO W, NLONG ZHAO B & ZHOU X 2017. Predicting the impact of combined therapies on myeloma cell growth using a hybrid multi-scale agent-based model. Oncotarget, 8, 7647–7665. [DOI] [PMC free article] [PubMed] [Google Scholar]
- JORDAN NJ, DUTKOWSKI CM, BARROW D, MOTTRAM HJ, HUTCHESON IR, NICHOLSON RI, GUICHARD SM & GEE JM 2014. Impact of dual mTORC1/2 mTOR kinase inhibitor AZD8055 on acquired endocrine resistance in breast cancer in vitro. Breast Cancer Res, 16, R12. [DOI] [PMC free article] [PubMed] [Google Scholar]
- JUNTTILA TT, AKITA RW, PARSONS K, FIELDS C, LEWIS PHILLIPS GD, FRIEDMAN LS, SAMPATH D & SLIWKOWSKI MX 2009. Ligand-independent HER2/HER3/PI3K complex is disrupted by trastuzumab and is effectively inhibited by the PI3K inhibitor GDC-0941. Cancer Cell, 15, 429–40. [DOI] [PubMed] [Google Scholar]
- LINDSTROM LS, YAU C, CZENE K, THOMPSON CK, HOADLEY KA, VAN’T VEER LJ, BALASSANIAN R, BISHOP JW, CARPENTER PM, CHEN YY, et al. 2018. Intratumor Heterogeneity of the Estrogen Receptor and the Long-term Risk of Fatal Breast Cancer. J Natl Cancer Inst, 110, 726–733. [DOI] [PMC free article] [PubMed] [Google Scholar]
- NORMANNO N, DI MAIO M, DE MAIO E, DE LUCA A, DE MATTEIS A, GIORDANO A, PERRONE F & GROUP NC-NBC 2005. Mechanisms of endocrine resistance and novel therapeutic strategies in breast cancer. Endocr Relat Cancer, 12, 721–47. [DOI] [PubMed] [Google Scholar]
- RENOIR JM, MARSAUD V & LAZENNEC G 2013. Estrogen receptor signaling as a target for novel breast cancer therapeutics. Biochem Pharmacol, 85, 449–65. [DOI] [PubMed] [Google Scholar]
- RESHKIN SJ, BELLIZZI A, CARDONE RA, TOMMASINO M, CASAVOLA V & PARADISO A 2003. Paclitaxel induces apoptosis via protein kinase A- and p38 mitogen-activated protein-dependent inhibition of the Na+/H+ exchanger (NHE) NHE isoform 1 in human breast cancer cells. Clin Cancer Res, 9, 2366–73. [PubMed] [Google Scholar]
- ROYCE ME & OSMAN D 2015. Everolimus in the Treatment of Metastatic Breast Cancer. Breast Cancer (Auckl), 9, 73–9. [DOI] [PMC free article] [PubMed] [Google Scholar]
- SARKER D, ANG JE, BAIRD R, KRISTELEIT R, SHAH K, MORENO V, CLARKE PA, RAYNAUD FI, LEVY G, WARE JA, et al. 2015. First-in-human phase I study of pictilisib (GDC-0941), a potent pan-class I phosphatidylinositol-3-kinase (PI3K) inhibitor, in patients with advanced solid tumors. Clin Cancer Res, 21, 77–86. [DOI] [PMC free article] [PubMed] [Google Scholar]
- SIMA N, SUN W, GORSHKOV K, SHEN M, HUANG W, ZHU W, XIE X, ZHENG W & CHENG X 2018. Small Molecules Identified from a Quantitative Drug Combinational Screen Resensitize Cisplatin’s Response in Drug-Resistant Ovarian Cancer Cells. Transl Oncol, 11, 1053–1064. [DOI] [PMC free article] [PubMed] [Google Scholar]
- SOCIETY AC 2017. Breast Cancer Facts & Figures 2017–2018. Atlanta: American Cancer Society Inc. [Google Scholar]
- TAMIMI RM, COLDITZ GA, HAZRA A, BAER HJ, HANKINSON SE, ROSNER B, MAROTTI J, CONNOLLY JL, SCHNITT SJ & COLLINS LC 2012. Traditional breast cancer risk factors in relation to molecular subtypes of breast cancer. Breast Cancer Res Treat, 131, 159–67. [DOI] [PMC free article] [PubMed] [Google Scholar]
- THOMAS S, THURN KT, RAHA P, CHEN S & MUNSTER PN 2013. Efficacy of histone deacetylase and estrogen receptor inhibition in breast cancer cells due to concerted down regulation of Akt. PLoS One, 8, e68973. [DOI] [PMC free article] [PubMed] [Google Scholar]
- WEAVER BA 2014. How Taxol/paclitaxel kills cancer cells. Mol Biol Cell, 25, 2677–81. [DOI] [PMC free article] [PubMed] [Google Scholar]
- YU LX, AMIDON G, KHAN MA, HOAG SW, POLLI J, RAJU GK & WOODCOCK J 2014. Understanding pharmaceutical quality by design. AAPS J, 16, 771–83. [DOI] [PMC free article] [PubMed] [Google Scholar]
Associated Data
This section collects any data citations, data availability statements, or supplementary materials included in this article.
Supplementary Materials
Supplemental Figure 1. Heat map denoting the effect of factor compound treatments on tested gene responses in MCF7 cells.
Supplemental Figure 2. Following pre-treatment with either BEPP or vehicle (VEH), MDA-MB-231 cells were incubated in phenol-red free media with 17-β Estradiol Alone (E2), E2 and 1μM 4-OH tamoxifen (1T), or E2 and 5uM 4-OH tamoxifen (5T). (A) BEPP pre-treated T47D cells exhibit increased proliferation when treated with E2 compared to vehicle pre-treated cells. Proliferation is attenuated in BEPP pretreated cells (B) and to a lesser extent in vehicle pretreated cells (C) upon E2 and 1μM or 5μM tamoxifen co-treatment compared to E2 treatment alone.
Supplemental Figure 3. (A) Following 3 days of pretreatment with BEPP or vehicle, cells were treated with 5uM 4-OH Tamoxifen for an additional 7 days and analyzed at pre-determined time points by CellTiter-Glo®. (B) T47D cells exhibited decreased proliferation following treatment with 1uM or 5uM 4-OH Tamoxifen after pre-treatment with BEPP (green) when compared to cells pre-treated with vehicle before 4-OH Tamoxifen (red), or cells treated with vehicle (black) or BEPP (blue) alone throughout. At day 10, overall survival (B) was decreased in BEPP pretreated cells and Annexin V expression levels (C) were increased in BEPP pretreated cells when compared to the other three groups. *** p<0.001 **p<0.01 *p<0.05 n.s-not significant


