Abstract
Background
Macrophage migration inhibitory factor (MIF) has been shown to play an important role in the inflammatory and immune response in squamous cell carcinoma (SCC). Recent studies have reported that MIF is involved in the tumorigenesis and overexpressed in various cancers. In this study, we assessed the prognostic role of MIF expression in SCC of the lung, and demonstrated the effect of knockdown of MIF on the migration in lung SCC cell lines.
Methods
The relationship between MIF expression and clinicopathological parameters and the prognostic role of MIF expression were evaluated with immunohistochemical staining in 96 patients with SCC of the lung. The expression of MIF mRNA and protein was analyzed by semi‐quantitative polymerase chain reaction and Western blot in lung SCC cell. The effect of knockdown of MIF was assessed by wound healing assay.
Results
The high percentage of MIF‐positive cells was significantly associated with lymph node metastasis (P = 0.004), and was a poor prognostic factor of disease‐free survival (DFS) (hazard ratio [HR]: 3.125; 95% confidence interval [CI], 1.628–5.998; P = 0.001) and disease‐specific survival (DSS) (HR: 2.303; 95% CI, 1.172–4.525; P = 0.016). Moreover, Kaplan‐Meier analysis showed that SCC patients with a high percentage of MIF‐positive cells had a significantly lower DFS (P = 0.001) and DSS (P = 0.014) than those with a low percentage. Furthermore, wound healing assay revealed that knockdown of MIF resulted in decreased cellular migration.
Conclusion
MIF is closely associated with tumor progression and could be a prognostic factor in SCC of the lung.
Keywords: Lung, macrophage migration inhibitory factor, prognosis, RNA interference, squamous cell carcinoma
Introduction
Lung cancer is a common cause of cancer‐related mortality worldwide.1 Non‐small cell lung cancer (NSCLC) accounts for approximately 85% of lung cancer and, of these, approximately 30% are squamous cell carcinoma (SCC).2, 3 The majority of SCC patients present with locally advanced or metastatic disease at the time of the diagnosis.4 Despite surgical resection and/or additional therapy, the prognosis for SCC patients remains poor. Therefore, development of biomarkers that can reliably and accurately predict clinical outcomes for SCC patients are necessary for the improvement of cancer management and treatment.5
Macrophage migration inhibitory factor (MIF) was originally found to be a pituitary hormone, inflammatory cytokine, and glucocorticoid‐induced immune‐regulator, and has been previously indicated to play an important role in the host inflammatory and immune response.6, 7 MIF basically circulates in serum, and extra MIF is secreted in the anterior pituitary gland and activates monocytes/macrophages in response to various stimuli.7 Other than their biologic properties, MIF has been associated with multiple inflammatory and immune‐mediated diseases including rheumatoid arthritis, inflammatory lung diseases, glomerulonephritis and atherosclerosis.8 Moreover, recent studies imply that MIF could be closely involved in the cell proliferation, angiogenesis and tumorigenesis by activating the MAPK/PI3K/Akt pathways.6, 8, 9, 10, 11 MIF has been reported to be overexpressed in various cancers, including gastric, esophageal, colorectal, liver, pancreatic, ovarian, breast and prostate cancers.12, 13 Furthermore, MIF overexpression has been found to be related to a poor prognosis in hepatocellular carcinoma, oral squamous cell carcinoma, metastatic melanoma and pancreatic ductal adenocarcinoma.14
However, the exact role of MIF is not clearly understood in SCC of the lung. In this study, we investigated MIF expression as a prognostic factor in SCC of the lung using immunohistochemistry and evaluated the expression of MIF mRNA and protein and the effect of MIF knockdown on the migration in lung SCC cell lines.
Methods
Patients and tissues
Formalin‐fixed, paraffin‐embedded tissues from 96 patients diagnosed with SCC of the lung who underwent surgical resection at Gyeongsang National University Hospital (Jinju, Korea) between January 2002 and December 2009 were recruited into the study. Tumors were reviewed by two pathologists and restaged by the guidelines in the eighth edition of the American Joint Committee on Cancer tumor‐node‐metastasis (TNM) classification of Malignant Tumors. Clinical and survival data were collected through medical records and National Statistical Office (Seoul, South Korea) records. Disease‐free survival (DFS) was defined as the period from the date of surgery to the date of cancer recurrence, while disease‐specific survival (DSS) was defined as the period from the date of surgery to the date of death, which was mostly due to SCC of the lung.15 Smoking history was defined as non‐smokers (<100 lifetime cigarettes) or smokers that included current and ex‐smokers. Patient data are shown in Table 1. This study was approved by the Institutional Review Board of Gyeongsang National University Hospital with a waiver of informed consent (2018‐07‐029‐001).
Table 1.
Clinicopathological characteristics of the patients
| Characteristic | Number (%) (n = 96) |
|---|---|
| Median age (years) | 66.50 |
| Male | 92 (95.8) |
| Smokers | 72 (75.0) |
| Surgical procedure | |
| Lobectomy | 79 (82.3) |
| Bilobectomy or sleeve lobectomy | 14 (14.6) |
| Pneumonectomy | 3 (3.1) |
| Histologic differentiation | |
| Well‐differentiated | 15 (15.6) |
| Moderately‐differentiated | 58 (60.4) |
| Poorly‐differentiated | 23 (24.0) |
| Tumor stage | |
| T1 | 27 (28.1) |
| T2 | 45 (46.9) |
| T3 | 17 (17.7) |
| T4 | 7 (7.3) |
| Lymph node metastasis | |
| N0 | 58 (60.4) |
| N1 | 35 (36.5) |
| N2 | 3 (3.1) |
| Distant metastasis | |
| M0 | 95 (99.0) |
| M1a | 1 (1.0) |
| Tumor‐node‐metastasis stage | |
| I | 36 (37.5) |
| II | 45 (46.9) |
| III | 14 (14.6) |
| IV | 1 (1.0) |
| Median survival (months) | 38.50 |
Tissue microarray construction and immunohistochemistry
Tissue microarray blocks were constructed. A core (3 mm in diameter) of representative invasive tumor area was selected from each case. Tissue sections were stained with monoclonal anti‐MIF antibody at a dilution of 1:100 (Abcam, ab55445), using the automated immunostainer (Benchmark Ultra, Ventana Medical Systems Inc., Tucson, AZ, USA). The positive control was using tumor‐infiltrating macrophages in SCC of the lung. The primary antibody was omitted for the negative control. The representative images are shown in Figure 1a,b.
Figure 1.
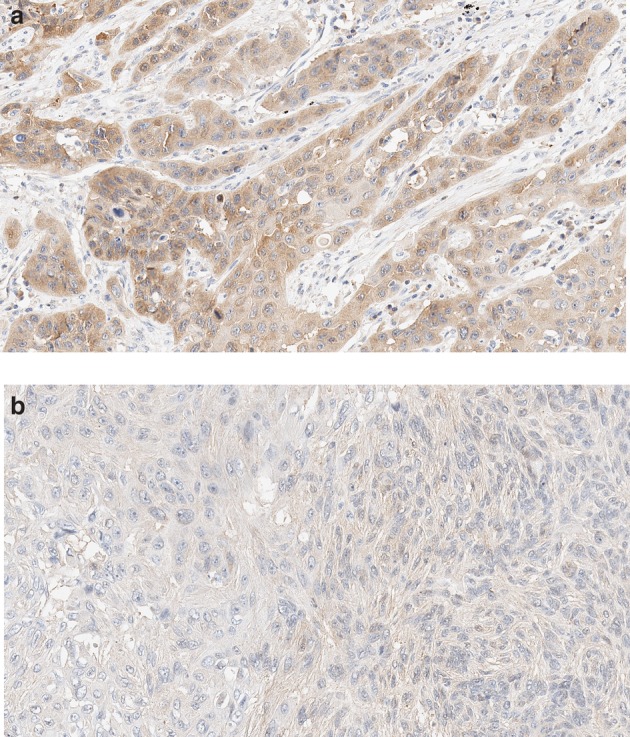
Representative images of MIF expression. (a) High and (b) low expression of MIF in squamous cell carcinoma of the lung (original magnification 200x).
MIF expression was assessed according to the widely‐used Remmele system.12 The intensity of staining of tumor cells was scored as 0 (no color reaction), one (mild reaction), two (moderate reaction) and three (intense reaction). The percentage of positive tumor cells was classified as <10%, 10%–50%, 51%–80% and >80% positive cells. In this study, each case was subdivided as low (<2 or <80%) or high (others) group based on the intensity score and percentage of positive tumor cells, respectively.
Cell culture and RNA interference
Five human lung SCC cell lines, HCC‐95, HCC‐1588, SNU‐1300, SW‐900 and SK‐MES‐1, were purchased from the Korean cell line bank (Seoul, South Korea). The cell lines were cultured in RPMI‐1640 medium (Gibco, 22400‐089) supplemented with 10% fetal bovine serum (FBS, Gibco, 26140‐079), 1% penicillin‐streptomycin (Corning, 30‐002‐CI) at 37°C in 5% CO2.
To achieve knockdown of MIF, HCC‐1588 cells were transfected with small interfering RNA (siRNA). Cells were cultured in Opti‐MEM reduced serum medium (Gibco) in accordance with the manufacturer's instructions. All siRNAs were transfected using lipofectamine 3000 reagent (Invitrogen, Carlsbad, CA, USA), according to the manufacturer's instructions. Cells were harvested 72 hours after transfection and the levels of MIF mRNA were assessed by semi‐quantitative polymerase chain reaction (PCR). Western blot analysis was used to measure MIF.
Semi‐quantitative PCR
Total RNA was extracted from the cells using TRIzol reagent (Qiagen) as instructed. Reverse transcription was performed using Maxime RT PreMix Kit (iNtRON, 25 081) according to the manufacturer's instruction. GAPDH was used as an internal control with a forward primer 5′‐ GTC CAC CAC CCT GTT GCT GTA G ‐3′, and a reverse primer 5′‐ CAA GGT CAT CCA TGA CAA CTT TG ‐3′. A total of 25 cycles of PCR were performed as follows: 94°C, 20 seconds, 58°C, 10 seconds, 72°C, 20 seconds and then 72°C, two minutes. The reverse transcription‐PCR products were examined by electrophoresis in 1.5% agarose gel.
Western blot analysis
Proteins were extracted using RIPA lysis buffer (Thermo Fisher Scientific, 89900) with protease inhibitor cocktail (Thermo Fisher Scientific, 78430). The total protein concentration of each cell lysate was measured by the Bradford method using bovine serum albumin as a standard. Equal amounts of protein lysates (50 ug) were loaded on a denaturing polyacrylamide gel, and then transferred to a nitrocellulose membrane. The primary antibodies used for immunoblot were MIF (Abcam, ab55445), GAPDH (Abcam, ab8245), followed by horseradish peroxidase‐conjugated secondary antibodies, and developed by enhanced chemiluminescence reaction (Thermo Fisher Scientific, 32109). The digital chemiluminescence images were taken by Fusion solo (Vilber).
Wound healing assay
HCC‐1588 cells were cultured in a 24‐well culture plate, and the cells transfected as described above. When cells reached 90% confluence 72 hours later, a wound was created in the center of the cell monolayers by gentle removal of the attached cells with a sterile plastic pipette tip. The debris was removed by washing with serum free medium. The cells which migrated into the wounded area or protruded from the border of the wound were then visualized and photographed using JuLI Br (NanoEnTek).
Statistical analysis
IBM SPSS version 25.0 (IBM Corp., Armonk, NY, USA) was used for analysis. The relationship between MIF expression and clinicopathological characteristics was examined using Pearson's chi‐square test. The prognostic impact of MIF expression was assessed by the Cox proportional hazard regression analysis, and survival was estimated using the Kaplan‐Meier graph with the log‐rank test. The average differences of MIF mRNA and protein between control and MIF knockdown group was evaluated using a two‐tailed t‐test. A P‐value of less than 0.05 was regarded as significant.
Results
Relationship between MIF expression and clinicopathological characteristics
MIF revealed mainly cytoplasmic expression with occasional nuclear expression. The relationship between MIF expression and clinicopathological characteristics are shown in Table 2. The percentage of MIF‐positive tumor cells was significantly associated with lymph node metastasis (P = 0.004), and a high percentage of MIF‐positive tumor cells was more frequent in present lymph node metastasis than in absent lymph node metastasis. Patient age, sex, smoking history, surgical methods, histologic differentiation, tumor stage, distant metastasis and TNM stage were not significantly correlated with the percentage of MIF‐positive tumor cells. However, a high percentage of MIF‐positive tumor cells revealed an increasing tendency in the high tumor stage and TNM stage than in the low stage.
Table 2.
Relationship between macrophage migration inhibitory factor expression and clinicopathological characteristics
| Macrophage migration inhibitory factor expression | ||||||
|---|---|---|---|---|---|---|
| Intensity of staining of tumor cells | Percentage of positive tumor cells | |||||
| Characteristics | Low | High | P‐value | Low | High | P‐value |
| Age (years) | 0.579 | 0.990 | ||||
| <65 | 24 (75.0) | 8 (25.0) | 26 (81.2) | 6 (18.8) | ||
| ≥65 | 41 (69.5) | 18 (30.5) | 48 (81.4) | 11 (18.6) | ||
| Sex | 0.853 | 0.508 | ||||
| Male | 63 (71.6) | 25 (28.4) | 72 (81.8) | 16 (18.2) | ||
| Female | 2 (66.7) | 1 (33.3) | 2 (66.7) | 1 (33.3) | ||
| Smoking | 0.819 | 0.663 | ||||
| Non‐smoker | 16 (69.6) | 7 (30.4) | 18 (78.3) | 5 (21.7) | ||
| Smoker | 49 (72.1) | 19 (27.9) | 56 (82.4) | 12 (17.6) | ||
| Surgery | 0.269 | 0.208 | ||||
| Lobectomy | 51 (68.9) | 23 (31.1) | 62 (83.8) | 12 (16.2) | ||
| Others† | 14 (82.4) | 3 (17.6) | 12 (70.6) | 5 (29.4) | ||
| Histologic differentiation | 1.000 | 0.556 | ||||
| WD and MD | 50 (71.4) | 20 (28.6) | 56 (80.0) | 14 (20.0) | ||
| PD | 15 (71.4) | 6 (28.6) | 18 (85.7) | 3 (14.3) | ||
| Tumor stage | 0.547 | 0.355 | ||||
| T1, T2 | 49 (73.1) | 18 (26.9) | 56 (83.6) | 11 (16.4) | ||
| T3, T4 | 16 (66.7) | 8 (33.3) | 18 (75.0) | 6 (25.0) | ||
| Lymph node metastasis | 0.542 | 0.004 | ||||
| Absent | 38 (69.1) | 17 (30.9) | 50 (90.9) | 5 (9.1) | ||
| Present | 27 (75.0) | 9 (25.0) | 24 (66.7) | 12 (33.3) | ||
| Distant metastasis | 0.112 | 0.630 | ||||
| Absent | 65 (72.2) | 25 (27.8) | 73 (81.1) | 17 (18.9) | ||
| Present | 0 (0.0) | 1 (100.0) | 1 (100.0) | 0 (0.0) | ||
| TNM stage | 0.284 | 0.385 | ||||
| I, II | 56 (73.7) | 20 (26.3) | 63 (82.9) | 13 (17.1) | ||
| III, IV | 9 (60.0) | 6 (40.0) | 11 (73.3) | 4 (26.7) | ||
Values are presented as number (%).
Specimens of five patients were not informative due to loss of the specimen.
Others include bilobectomy or sleeve lobectomy and pneumonectomy.
MD, moderately differentiated; PD, poorly differentiated; TNM, tumor‐node‐metastasis; WD, well differentiated.
The intensity of staining of tumor cells for MIF was not significantly associated with any clinicopathological characteristics. However, high intensity for MIF showed an increasing trend in the high tumor stage and TNM stage than in the low stage.
MIF expression and survival analysis
According to the Kaplan‐Meier analysis, SCC patients with a high percentage of MIF‐positive tumor cells were significantly lower DFS (P = 0.001) and DSS (P = 0.014) than those with a low percentage (Fig 2a,b). Univariate analysis showed that several variables are significantly associated with DFS and DSS, including histologic differentiation (P = 0.010 and P = 0.019, respectively) TNM stage (P = 0.012 and P = 0.045, respectively) and percentage of MIF‐positive tumor cells (P = 0.002 and P = 0.017, respectively). Moreover, multivariate analysis identified that a high percentage of MIF‐positive tumor cells was a poor prognostic indicator of DFS (hazard ratio [HR], 3.125; 95% confidence interval [CI], 1.628–5.998; P = 0.001) and DSS (HR, 2.303; 95% CI, 1.172–4.525; P = 0.016) (Table 3). In addition, survival analysis revealed that the intensity of staining of tumor cells for MIF had no significant prognostic values in DFS and DSS.
Figure 2.
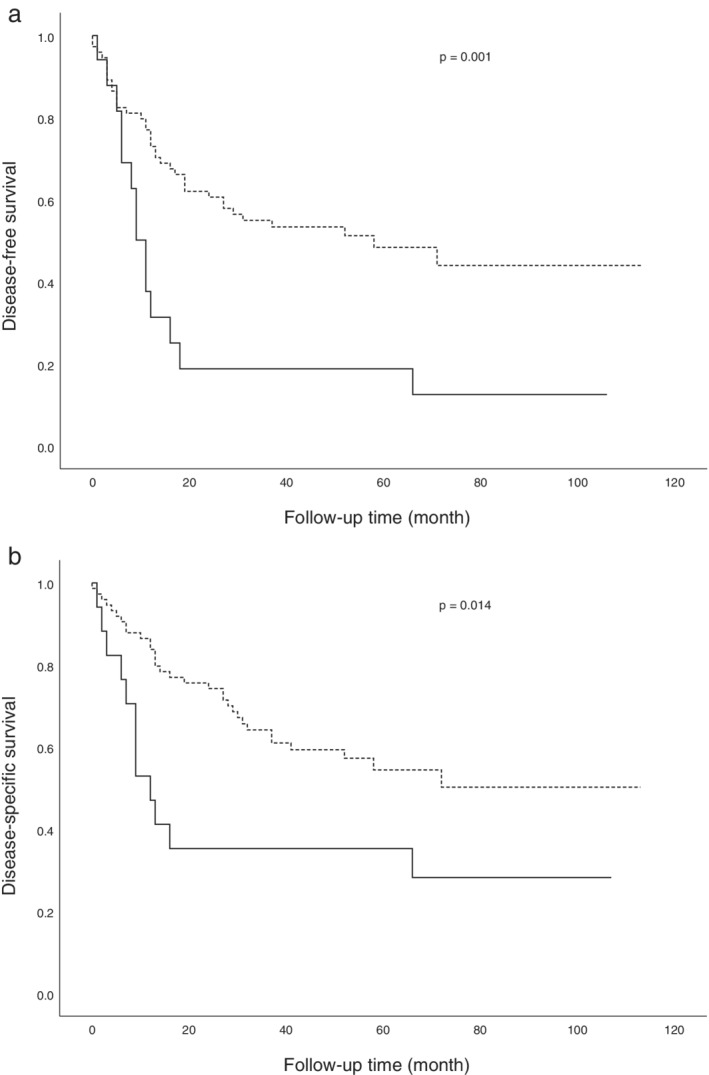
Kaplan‐Meier survival curves based on MIF expression in patients with squamous cell carcinoma of the lung. The high‐expression group reveals a significantly lower (a) disease‐free survival and (b) disease‐specific survival compared to the low‐expression group. MIF expression ( ) ≤80% and (
 ) >80%.
Table 3.
Cox proportional hazards model of disease‐free and disease‐specific survival for patients with squamous cell carcinoma of the lung
| Univariate analysis | Multivariate analysis | |||||||
|---|---|---|---|---|---|---|---|---|
| DFS | DSS | DFS | DSS | |||||
| Variables | HR (95% CI) | P‐value | HR (95% CI) | P‐value | HR (95% CI) | P‐value | HR (95% CI) | P‐value |
| Age (years) (<65 vs. ≥65) | 1.402 (0.784–2.506) |
0.255 | 1.170 (0.635–2.157) |
0.614 | ||||
| Sex (male vs. female) | 0.824 (0.200–3.391) |
0.789 | 0.398 (0.055–2.895) |
0.363 | ||||
| Smoking (non‐smoker vs. smoker) |
0.644 (0.356–1.164) |
0.145 | 0.671 (0.355–1.266) |
0.218 | ||||
| Surgery (lobectomy vs. others†) | 1.562 (0.814–2.998) |
0.180 | 1.479 (0.730–2.996) |
0.278 | ||||
| Histologic differentiation (WD and MD vs. PD) | 2.142 (1.201–3.821) |
0.010 | 2.089 (1.130–3.861) | 0.019 | 2.413 (1.309–4.450) | 0.005 | 2.109 (1.122–3.962) | 0.020 |
| TNM stage (I,II vs. III,IV) | 2.325 (1.208–4.476) |
0.012 | 2.060 (1.016–4.176) |
0.045 | 1.907 (0.983–3.699) |
0.056 | 1.690 (0.830–3.441) |
0.148 |
| Percentage of MIF‐positive tumor cells (low vs. high) | 2.661 (1.422–4.978) |
0.002 | 2.249 (1.153–4.389) |
0.017 | 3.125 (1.628–5.998) |
0.001 | 2.303 (1.172–4.525) |
0.016 |
Others include bilobectomy or sleeve lobectomy and pneumonectomy.
CI, confidence interval; DFS, disease‐free survival; DSS, disease‐specific survival; HR, hazard ratio; MIF, macrophage migration inhibitory factor; MD, moderately differentiated; PD, poorly differentiated; TNM, tumor‐node‐metastasis, WD, well differentiated.
Knockdown of MIF and wound healing assay
MIF mRNA and protein expression were examined in five lung SCC cell lines, HCC‐95, HCC‐1588, SNU‐1300, SW‐900 and SK‐MES‐1. As shown in Figure 3, MIF mRNA and protein were detected in all five cell lines, although at low protein densities in several cell lines. HCC‐1588 cells were selected for knockdown of MIF, which showed higher expression of MIF mRNA and protein compared with HCC‐95, SNU‐1300, SW‐900 and SK‐MES‐1.
Figure 3.
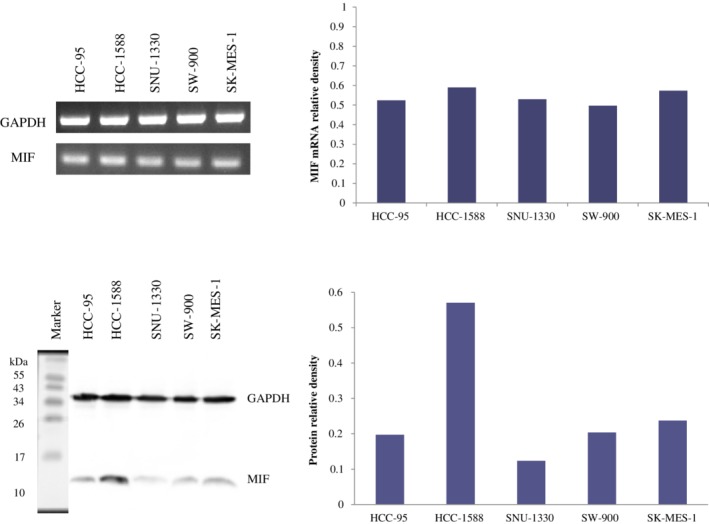
MIF mRNA and protein expression in five lung squamous cell carcinoma cell lines. MIF mRNA and protein were detected in all cell lines with higher expression in HCC‐1588 compared with those of others.
To investigate the role of MIF in HCC‐1588 cell migration, we transfected the cells with siRNA. The expression level of MIF mRNA and protein were effectively knocked down at 72 hours after transfection, as compared with those of control group (P < 0.05, respectively) (Fig 4). We then performed wound healing assay. Knockdown of MIF decreased the wound filling ability of HCC‐1588 cells, as compared with those of control group in which cell migration into the wound area was much faster, suggesting that MIF was involved in the migration of cancer cells (Fig 5).
Figure 4.
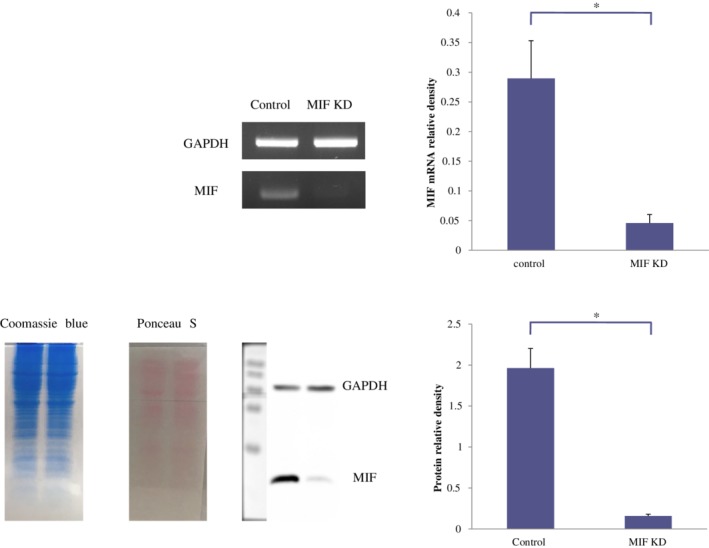
MIF mRNA and protein expression on MIF status in HCC‐1588 cells. MIF mRNA and protein level were substantially reduced after transfection with small interfering RNA, compared with those of control (*P < 0.05). Data represent at least three independent experiments with similar results. KD, knockdown.
Figure 5.
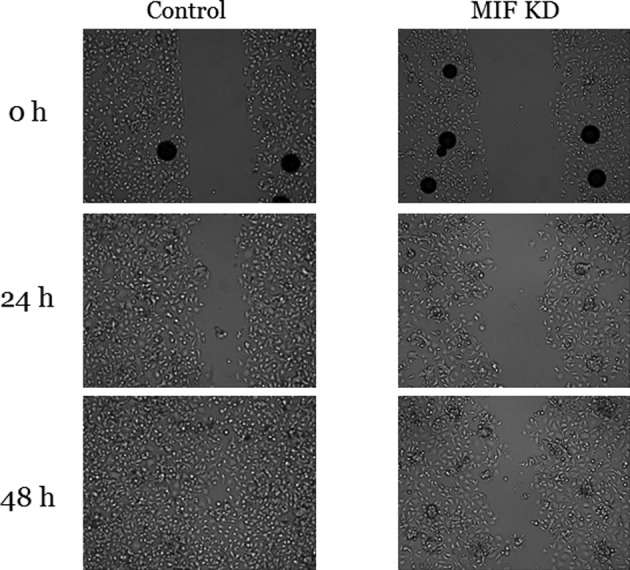
Wound healing assay on MIF status in HCC‐1588 cells. The cells with knockdown of MIF showed much slower migration into the wound area than control cells. Data represent at least two independent experiments with similar results. KD, knockdown.
Discussion
In this study, we showed that a high percentage of MIF‐positive tumor cells could be an independent factor for poor survival in patients with SCC of the lung.
In previous reports, Tomiyasu et al.16 assessed the expression of MIF mRNA of NSCLC tissue and revealed that a high expression of MIF mRNA was significantly associated with an unfavorable prognosis in SCC patients. Liu et al.17 evaluated MIF expression using immunohistochemistry and showed that the prognosis was poor in patients with a high expression of MIF compared to those with a low expression in NSCLC using the Kaplan‐Meier analysis, but they were unable to elucidate MIF expression as a prognostic marker with multivariate analysis.
In addition, Kamimura et al.18 showed that negative nuclear expression of MIF was related to a poor prognosis in adenocarcinoma of the lung.
We demonstrated that knockdown of MIF reduced cell migration of lung SCC cells by wound healing assay. Similarly, Rendon et al.19 reported that knockdown of MIF resulted in a substantial decrease in migratory potential of lung adenocarcinoma cells. Another study showed that knockdown of MIF dampened cell proliferation by enhancing apoptosis in lung cancer cell.20 Goto et al.11 reported that MIF expression was inversely correlated with miR‐451 expression, and MIF expression and phosphorylated Akt expression after transfection of miR‐451‐mimic was suppressed, as were cell proliferation and migration in NSCLC cell lines. Moreover, they found that SCC and high‐grade tumor showed a lower expression of miR‐451 than adenocarcinoma and low‐grade tumor in NSCLC.11 In this regard, we presume that MIF was upregulated in some SCC cases of the present study associated with miR‐451.
In addition, we also evaluated the association between MIF expression of tumor infiltrating immune cells and clinicopathological characteristics. However, the intensity of staining of immune cells and the proportion of positive immune cells for MIF did not provide any significant correlation with clinicopathological characteristics (data not shown).
There were some limitations in our study. We evaluated only small tumor areas for immunohistochemistry and did not validate all the whole tumor sections, which could cause a lack of representativeness. We did not elucidate any difference in expression or activation of MIF‐related molecules, such as Akt and Erk, depending on MIF status and were unable to examine PCR in all cases, which might not be enough to sufficiently explain the function of MIF. However, the present study includes valuable data on MIF in SCC of the lung. An organized study with sufficient cell biological experiments to determine the function of MIF will be required in the future.
Recent studies have shown that MIF possesses protumor characteristics via many cellular signaling pathways, as well as downregulation of tumor suppressor gene, p53 and procancer effect by prohibiting natural killer cells and cytotoxic T cell function.21 In addition, White et al.22 revealed that MIF stimulates macrophages to secrete angiogenic chemokines in lung cancer cells. However, conflicting results also report that MIF stimulates macrophages to enhance cytotoxicity by in vitro cytokine production.16 Overall, the functions and influences of MIF in tumorigenesis are thought to be complex, and further large‐scale studies are required to more fully elucidate these results.
In summary, we demonstrated that the high percentage of MIF‐positive tumor cells is related to lymph node metastasis and poor survival of patients with SCC of the lung, and knockdown of MIF is related with slow migration of SCC cells. To our knowledge, this is the first report to identify that MIF is associated with tumor progression in SCC of the lung, including wound healing assay with knockdown of MIF.
Disclosure
No authors report any conflict of interest.
Acknowledgments
No financial support for the research, authorship, and/or publication of this article was received by the authors.
References
- 1. Wang J, Ma Y, Zhu ZH, Situ DR, Hu Y, Rong TH. Expression and prognostic relevance of tumor carcinoembryonic antigen in stage IB non‐small cell lung cancer. J Thorac Dis 2012; 4 (5): 490–6. [DOI] [PMC free article] [PubMed] [Google Scholar]
- 2. Heist RS, Sequist LV, Engelman JA. Genetic changes in squamous cell lung cancer: A review. J Thorac Oncol 2012; 7 (5): 924–33. [DOI] [PMC free article] [PubMed] [Google Scholar]
- 3. Li L, Sun Y, Feng M, Wang L, Liu J. Clinical significance of blood‐based miRNAs as biomarkers of non‐small cell lung cancer. Oncol Lett 2018; 15 (6): 8915–25. [DOI] [PMC free article] [PubMed] [Google Scholar]
- 4. Molina JR, Yang P, Cassivi SD, Schild SE, Adjei AA. Non‐small cell lung cancer: Epidemiology, risk factors, treatment, and survivorship. Mayo Clin Proc 2008; 83 (5): 584–94. [DOI] [PMC free article] [PubMed] [Google Scholar]
- 5. Chatterjee SK, Zetter BR. Cancer biomarkers: Knowing the present and predicting the future. Future Oncol 2005; 1 (1): 37–50. [DOI] [PubMed] [Google Scholar]
- 6. Takahashi N, Nishihira J, Sato Y et al Involvement of macrophage migration inhibitory factor (MIF) in the mechanism of tumor cell growth. Mol Med 1998; 4 (11): 707–14. [PMC free article] [PubMed] [Google Scholar]
- 7. Ren Y, Tsui H, Poon RT et al Macrophage migration inhibitory factor: Roles in regulating tumor cell migration and expression of angiogenic factors in hepatocellular carcinoma. Int J Cancer 2003; 107 (1): 22–9. [DOI] [PubMed] [Google Scholar]
- 8. Lue H, Kleemann R, Calandra T, Roger T, Bernhagen J. Macrophage migration inhibitory factor (MIF): Mechanisms of action and role in disease. Microbes Infect 2002; 4 (4): 449–60. [DOI] [PubMed] [Google Scholar]
- 9. del Vecchio MT, Tripodi SA, Arcuri F et al Macrophage migration inhibitory factor in prostatic adenocarcinoma: Correlation with tumor grading and combination endocrine treatment‐related changes. Prostate 2000; 45 (1): 51–7. [DOI] [PubMed] [Google Scholar]
- 10. Shimizu T, Abe R, Nakamura H, Ohkawara A, Suzuki M, Nishihira J. High expression of macrophage migration inhibitory factor in human melanoma cells and its role in tumor cell growth and angiogenesis. Biochem Biophys Res Commun 1999; 264 (3): 751–8. [DOI] [PubMed] [Google Scholar]
- 11. Goto A, Tanaka M, Yoshida M e a. The low expression of miR‐451 predicts a worse prognosis in non‐small cell lung cancer cases. PLOS One 2017; 12 (7): e0181270. [DOI] [PMC free article] [PubMed] [Google Scholar]
- 12. He LJ, Xie D, Hu PJ et al Macrophage migration inhibitory factor as a potential prognostic factor in gastric cancer. World J Gastroenterol 2015; 21 (34): 9916–26. [DOI] [PMC free article] [PubMed] [Google Scholar]
- 13. Subbannayya T, Leal‐Rojas P, Barbhuiya MA e a. Macrophage migration inhibitory factor‐a therapeutic target in gallbladder cancer. BMC Cancer 2015; 15 (1): 843. [DOI] [PMC free article] [PubMed] [Google Scholar]
- 14. Kindt N, Journe F, Laurent G, Saussez S. Involvement of macrophage migration inhibitory factor in cancer and novel therapeutic targets. Oncol Lett 2016; 12 (4): 2247–53. [DOI] [PMC free article] [PubMed] [Google Scholar]
- 15. Song DH, Ko GH, Lee JH et al Prognostic role of myoferlin expression in patients with clear cell renal cell carcinoma. Oncotarget 2017; 8 (51): 89033. [DOI] [PMC free article] [PubMed] [Google Scholar]
- 16. Tomiyasu M, Yoshino I, Suemitsu R, Okamoto T, Sugimachi K. Quantification of macrophage migration inhibitory factor mRNA expression in non‐small cell lung cancer tissues and its clinical significance. Clin Cancer Res 2002; 8 (12): 3755–60. [PubMed] [Google Scholar]
- 17. Liu Q, Yang H, Zhang SF. Expression and significance of MIF and CD147 in non‐small cell lung cancer. Sichuan Da Xue Xue Bao Yi Xue Ban 2010; 41 (1): 85–90. [PubMed] [Google Scholar]
- 18. Kamimura A, Kamachi M, Nishihira J et al Intracellular distribution of macrophage migration inhibitory factor predicts the prognosis of patients with adenocarcinoma of the lung. Cancer 2000; 89 (2): 334–41. [PubMed] [Google Scholar]
- 19. Rendon BE, Roger T, Teneng I e a. Regulation of human lung adenocarcinoma cell migration and invasion by macrophage migration inhibitory factor. J Biol Chem 2007; 282 (41): 29910–8. [DOI] [PubMed] [Google Scholar]
- 20. Guo Y, Hou J, Luo Y, Wang D. Functional disruption of macrophage migration inhibitory factor (MIF) suppresses proliferation of human H460 lung cancer cells by caspase‐dependent apoptosis. Cancer Cell Int 2013; 13 (1): 28. [DOI] [PMC free article] [PubMed] [Google Scholar]
- 21. O'Reilly C, Doroudian M, Mawhinney L, Donnelly SC. Targeting MIF in cancer: Therapeutic strategies, current developments, and future opportunities. Med Res Rev 2016; 36 (3): 440–60. [DOI] [PubMed] [Google Scholar]
- 22. White ES, Strom SR, Wys NL, Arenberg DA. Non‐small cell lung cancer cells induce monocytes to increase expression of angiogenic activity. J Immunol 2001; 166 (12): 7549–55. [DOI] [PubMed] [Google Scholar]


