

Abstract
Background
Circulating tumor DNA (ctDNA) is a biomarker for the selection of target agents in various malignancies. In this study, we examined the effect of ctDNA presence on the response to EGFR‐tyrosine kinase inhibitor (TKI) and on the prognosis in lung adenocarcinoma.
Methods
ctDNA of EGFR‐TKI sensitizing mutations (mEGFR), L858R substitution and Exon 19 deletion (E19d) mutation, was evaluated using droplet digital PCR (ddPCR) in 81 patients with lung adenocarcinoma which harbored mEGFR in the corresponding tumor tissues.
Results
The study recruited lung cancer patients at various stages, and the sensitivity, specificity, and area under the curve (AUC) of mEGFR ctDNA detection by ddPCR were 40.0%, 88.5%, and 0.68, respectively. It showed higher sensitivity (75.0% vs. 10.0%) and AUC (0.83 vs. 0.49) in the advanced stages of lung adenocarcinoma compared with the early stages and the number of metastases and the fractional abundance of mEGFR ctDNA showed a strong correlation (σ = 0.516; P < 0.001, Spearman correlation test). There was a significantly shorter progression‐free survival and duration of disease control by EGFR‐TKIs in the ctDNA‐positive group than the negative group (14.0 vs. 41.0 months, P = 0.02 and 12.0 vs. 23.0 months, P = 0.02, log‐rank test, respectively). There was a trend for overall survival time to be shorter in patients with mEGFR ctDNA than for patients without mEGFR ctDNA (35.6 vs. 67.1 months, P = 0.06, log‐rank test).
Conclusions
These data showed that mEGFR ctDNA detection using ddPCR is useful in the advanced stages and its presence predicted distant metastasis and poor clinical outcome in lung adenocarcinoma.
Keywords: ctDNA, ddPCR, lung adenocarcinoma, mEGFR
Introduction
In 2018, approximately two million people were diagnosed with lung cancer globally, accounting for 11.6% of the total cancer incidence and the death toll from this devastating disease was 1.76 million, accounting for 18.4% of cancer‐related deaths, remaining the most common cause of cancer‐related deaths to date.1 A total of 85% of lung cancers are non‐small cell lung cancer (NSCLC). More than 50% of NSCLC patients present with distant metastasis at the time of diagnosis, which cannot be cured by surgical resection alone.2
Drug‐sensitizing mutations in the tyrosine kinase domain of the epidermal growth factor receptor (mEGFRs) occur frequently in lung adenocarcinomas of women, never smokers, and Asians. In Korea, mEGFRs are found in 40% of lung adenocarcinomas.3 Large‐scale phase III clinical trials have been performed in patients with mEGFR‐positive lung adenocarcinoma and showed a higher response rate and prolonged progression‐free survival (PFS) in the group treated with EGFR tyrosine kinase inhibitors (TKIs) compared to those treated with cytotoxic chemotherapy. When EGFR mutations were present in the tissues, the therapeutic response to EGFR‐TKIs was more than 70%.4, 5, 6, 7, 8 As a result, EGFR‐TKIs are widely used as the standard treatment option for mEGFR‐positive lung adenocarcinoma.
When a small amount of specimen is collected, it may be inadequate to use for genetic testing, including testing for EGFR mutations. In this case, liquid biopsies can be used for adjunctive diagnostic testing. The detection of circulating tumor DNA (ctDNA) is used for the selection of the most suitable diagnostic option. Currently, Cobas amplification refractory mutation system (ARMS, Cobas EGFR Mutation Test v2), next‐generation sequencing (NGS)‐based methods, peptide nucleic acid (PNA)‐mediated PCR, and droplet digital PCR (ddPCR) methods can be used to detect ctDNA in liquid biopsies from NSCLC patients. Of these methods, Cobas II and PNA‐mediated PCR are approved in the Republic of Korea.9
Recently, ddPCR, which is one of the most sensitive methods, has been used to detect EGFR mutant ctDNA in NSCLC patients.10, 11, 12, 13 However, there are limited studies on the interpretation of ddPCR results, the cutoff values, and the clinical implication of these values. Therefore, the aim of this study was to determine the cutoff values and the clinical implications of ddPCR parameters measured in plasma samples.
Methods
Patients
We analyzed the results of patients as follows: (i) Had a pathologically confirmed lung adenocarcinoma; (ii) EGFR mutation status was confirmed in the tumor tissue; (iii) Computed tomography had been used to evaluate the primary lesion size; (iv) No previous therapy had been experienced before blood sampling; and (v) The patient agreed to provide blood samples. Both EGFR L858R substitution and exon 19 deletion (E19d) mutation tests were performed by ddPCR on collected blood samples.
All patients provided their written informed consent. This study was performed in accordance with the amended Declaration of Helsinki, following approval of the study by an independent hospital institutional review board (approval No. 3‐2016‐0225 and 3‐2017‐0321).
Plasma collection and DNA extraction
In eligible patients, plasma was collected using a Streck tube (Dow Biomedica, Seoul, Korea). The collected blood was centrifuged at 1000 × g for 10 minutes within the same working day and the supernatant was separated and stored at −80°C until DNA extraction. ctDNA was extracted from the plasma using a QIAamp circulating nucleic acid kit (Qiagen, Hilden, Germany), according to the manufacturer's instructions.
ddPCR
ddPCR was performed according to the manufacturer's manual (Bio‐Rad Laboratories, Inc., Hercules, CA, USA). Mutation sites were detected using probes for EGFR L858R (BR186dHsaCP2000021; Bio‐Rad) and Exon19del (BR12002392, Bio‐Rad). ddPCR was performed by first forming droplets with a QX100 Droplet Generator (Bio‐Rad). PCR amplification was then performed within each droplet using a thermal cycler (Bio‐Rad). Following PCR, droplets were streamed in single file on a QX200 Droplet Reader (Bio‐Rad), which counts the fluorescent‐positive and fluorescent‐negative droplets to calculate the target DNA concentration. Data were processed using QuantaSoft software (Bio‐Rad). The threshold values of the ddPCR results were determined using QuantaSoft software and then manually validated. ddPCR results passed quality control when the number of droplets was more than 9000 and the wild‐type gene sequence was present in more than 100 copies/mL. Only data that passed initial quality control were used for analysis.
ddPCR test results yielded three parameters: concentration, mutant/wild‐type ratio, and fractional abundance. Area under the curve (AUC) values were calculated to determine which of the three parameters were most consistent with that from tumor tissue. For E19d results, the AUC values were 0.67 for the concentration, the mutant/wild type ratio, and fractional abundance. The AUC values for the L858R results were 0.66 for the concentration, the mutant/wild‐type ratio, and fractional abundance. There were no significant differences in these values and the commonly used fractional abundance parameter was used for further analysis. Results were defined as positive when the fractional abundance was greater than 0.1%.
Statistical analysis
Categorical and continuous parameters were evaluated using a Chi‐square test or an independent sample t‐test, respectively. The Spearman correlation test was used to test relationships between two variables. Survival curves were generated using the Kaplan‐Meier method. P‐values less than 0.05 were considered significant. Statistical analyses were performed using SPSS version 23.0 for Windows (SPSS, Chicago, IL, USA) or R Statistical Package (Institute for Statistics and Mathematics, Vienna, Austria, ver 3.5.3, www.R-project.org).
Results
Clinical characteristics of study population
To confirm the robustness of ddPCR testing parameters and determine the appropriate cutoff value, 81 patients who had been diagnosed with lung adenocarcinoma and underwent tissue EGFR mutation testing were recruited. The baseline characteristics of the patients are presented in Table 1. The mean age of the patients was 64.0 ± 1.1 years; there were 43 (53.1%) males, and 52 (64.2%) patients had no smoking history. The stage distribution in patients was as follows: stage I in 25 (30.9%), stage II in six (7.4%), stage III in 14 (17.3%), and stage IV in 36 (44.4%) patients. A total of 31 (38.3%) patients showed the wild‐type EGFR genotype, 20 (24.7%) the L858R, and 24 (29.6%) the E19d mutant.
Table 1.
Baseline characteristics of lung adenocarcinoma patients (n = 81)
| Variables | Total (No.) | % |
|---|---|---|
| Mean age, years | 64.0 ± 1.1 | |
| Sex | ||
| Male | 43 | 53.1 |
| Female | 38 | 46.9 |
| Smoking history | ||
| Never smoker | 52 | 64.2 |
| Ex‐smoker | 22 | 27.2 |
| Current smoker | 7 | 8.6 |
| T stage | ||
| Primary tumor size, cm | 3.67 ± 2.57 | |
| T1 | 24 | 29.6 |
| T2 | 23 | 28.4 |
| T3 | 9 | 11.1 |
| T4 | 25 | 30.9 |
| N stage | ||
| N0 | 39 | 48.1 |
| N1 | 1 | 1.2 |
| N2 | 19 | 23.5 |
| N3 | 22 | 27.2 |
| M stage | ||
| Metastatic sites | 0.73 ± 1.03 | |
| M0 | 47 | 58.0 |
| M1 | 34 | 42.0 |
| Stage | ||
| I | 25 | 30.9 |
| II | 6 | 7.4 |
| III | 14 | 17.3 |
| IV | 36 | 44.4 |
| EGFR mutation | ||
| Wild | 31 | 38.3 |
| L858R | 20 | 24.7 |
| E19del | 24 | 29.6 |
| Others | 6 | 7.4 |
The receiver operating characteristic (ROC) curve analysis was then performed to evaluate the representativeness of plasma ctDNA on tumor tissue mutation status and AUC values were calculated. In this cohort comprised of heterogeneous stages, the AUC of plasma ddPCR analysis was 0.67 (95% CI, 0.56–0.77) for E19d and 0.66 (95% CI, 0.53–0.79) for L858R. Plasma ddPCR analysis showed high specificity for the detection of E19d (91.2%) and L858R (96.7%). The sensitivity of the plasma ddPCR method was modest for E19d (41.7%) and L858R (40.0%) (Figure S1a,d). The diagnostic applicability of the plasma ddPCR method for mEGFR detection was analyzed without discriminating between E19d and L858R (Fig 1a). As a result, the AUC was 0.68 (95% CI, 0.58–0.77), the sensitivity was 40.0%, and the specificity was 88.5% for all stages.
Figure 1.

ROC analysis of plasma ddPCR assay of NSCLC tissue samples. (a) Overall stage, (b) Early stage (I–IIIA), and (c) Advanced stage (IIIB–IV).
ctDNA showed higher correspondence in advanced lung adenocarcinoma
We further analyzed the data according to the stage, with early stage defined as stages I–IIIA and advanced stage as stages IIIB–IV. In patients with early stage disease, the AUC of the plasma ddPCR analysis was 0.46 (95% CI, 0.41–0.51) for E19d (Figure S1b) and 0.51 (95% CI, 0.38–0.64) for L858R (Figure S1e). The sensitivity was 0.0% for E19d and 11.1% for L858R and the specificity was 92.3% for E19d and 100.0% for L858R. When the detection rates of L858R and E19d mutants were analyzed together in early‐stage patients, the AUC was 0.49 (95% CI, 0.37–0.61), the sensitivity was 10.0%, and the specificity was 100.0% (Fig 1b). In the advanced stage patients, the AUC of the plasma ddPCR analysis was 0.84 (95% CI, 0.71–0.98) for E19d (Figure S1c) and 0.79 (95% CI, 0.62–0.96) for L858R (Figure S1f). The sensitivity was 76.9% for E19d and 63.6% for L858R and the specificity was 90.3% for E19d and 97.0% for L858R. When the detection rates of L858R and E19d mutants were analyzed together in the advanced‐stage patients, the AUC was 0.83 (95% CI, 0.71–0.94), the sensitivity was 75.0%, and the specificity was 85.0% (Fig 1c). Taken together, the agreement between the plasma ddPCR results and that of the tissue biopsy genotype increased in advanced stage, suggesting the mEGFR detection by ddPCR is only applicable in the advanced stage.
Relationship of number of distant metastatic sites to presence of mEGFR ctDNA
To investigate the clinical factors associated with the presence of mEGFR ctDNA in the blood, a correlation analysis was performed between the clinical parameters and the fractional abundance from ddPCR analysis. First, the relationship between TNM stage and plasma ctDNA fractional abundance was analyzed (Table 2). As the TNM stage increased, the proportion of ctDNA EGFR mutation tended to increase. There was no significant difference in the fractional abundance value of mEGFR ctDNA with the progression of T stage and N stage (Figure S2). Regarding the M stage, there was a significant difference in the fractional abundance value in those with and without distant metastasis (0.45 ± 0.24% in M0 and 8.71 ± 3.14% in M1, P < 0.001). In addition, the correlation between the number of metastatic sites and plasma ctDNA fractional abundance was analyzed, and there was a strong correlation (σ = 0.516, P < 0.001, Spearman correlation test, Fig 2d). The most common metastatic sites in stage IV patients were bone (44.4%, 16/36) and the brain (33.3%, 12/36). There was also a significant difference in the fractional abundance values in patients with or without bone metastasis (Fig 2b) and brain metastasis (Fig 2c). Therefore, the detection of plasma ctDNA is useful as a surrogate marker for predicting distant metastasis.
Table 2.
The relationship between the parameters related to the TNM staging and plasma ctDNA fraction abundance
| N (%) 81(100) | Fraction abundance (%) | P‐value | ctDNA EGFR mutation (%) | ||
|---|---|---|---|---|---|
| T stage | 0.001* | 0.01*** | |||
| T1 | 24 (29.6) | 0.55 ± 0.52 | 3/24 (12.5) | ||
| T2 | 23 (28.4) | 2.63 ± 1.80 | 6/23 (26.1) | ||
| T3 | 9 (11.1) | 0.11 ± 0.11 | 1/9 (11.1) | ||
| T4 | 25 (30.9) | 3.76 ± 1.58 | 13/25(52.0) | ||
| N stage | 0.004* | 0.013*** | |||
| N0 | 39 (48.1) | 0.52 ± 0.47 | 5/39 (12.8) | ||
| N1 | 1 (1.2) | NA | 0/1 (0) | ||
| N2 | 19 (23.5) | 2.82 ± 1.84 | 8/19 (42.1) | ||
| N3 | 22 (27.2) | 4.32 ± 1.95 | 10/22 (45.5) | ||
| M stage | <0.001** | <0.001*** | |||
| M0 | 47 (58.0) | 0.69 ± 0.47 | 6/47 (12.8) | ||
| M1 | 34 (42.0) | 4.01 ± 1.57 | 17/34 (50.0) | ||
| Stage | <0.001** | 0.001*** | |||
| I | 25 (30.9) | 0.15 ± 0.01 | 2/25 (8) | ||
| II | 6 (7.4) | 0.02 ± 0.02 | 0/6 (0) | ||
| III | 14 (17.3) | 0.96 ± 0.89 | 3/14 (21.4) | ||
| IV | 36 (44.4) | 4.29 ± 1.54 | 18/36 (50.0) | ||
| Brain metastasis | <0.001** | ||||
| No | 69 (85.2) | 1.41 ± 0.60 | |||
| Yes | 12 (14.8) | 5.98 ± 3.44 | |||
| Bone metastasis | |||||
| No | 65 (80.2) | 0.45 ± 0.24 | <0.001** | ||
| Yes | 16 (19.8) | 8.71 ± 3.14 |
Kruskal‐Wallis test.
Mann‐Whitney U test.
Chi‐square test.
Figure 2.

Correlation between ddPCR fractional abundance for EGFR mutations and clinical parameters: (a) M stage, (b) Brain metastasis, (c) Bone metastasis, and (d) the number of metastatic sites.
Presence of mEGFR ctDNA predicts a poor clinical outcome in lung adenocarcinoma
The prognostic significance of plasma ctDNA detection was analyzed in 81 lung adenocarcinoma patients. Of the 81 patients, 52 (64.2%) were mEGFR ctDNA negative and 29 (35.8%) were positive. The PFS and overall survival (OS) of the patients were analyzed divided to mEGFR ctDNA positive group and mEGFR ctDNA negative group (Fig 3). The median PFS of lung adenocarcinoma patients was 22.0 months (95% CI, 15.8~28.2 months). According to Kaplan‐Meier survival curves, the ctDNA positive group had significantly shorter PFS than the ctDNA negative group (14.0 vs. 41.0 months, P = 0.02, log‐rank test, Fig 3a). The mean OS was 58.3 ± 3.7 months (95% CI, 51.0–65.5 months). Although statistical significance was not reached, the OS of the ctDNA positive group was shorter than that of the ctDNA negative group (35.6 ± 3.20 vs. 67.1 ± 1.88 months, P = 0.06, log‐rank test, Fig 3b). A subgroup analysis was performed in 27 patients who had been diagnosed with mEGFR‐positive lung adenocarcinoma and received EGFR‐TKI treatment. Among the 26 patients, five (19.2%) were plasma ctDNA negative and 21 (80.8%) were plasma ctDNA positive. PFS after the initiation of EGFR‐TKI treatment was analyzed in these two groups. The median PFS time of patients taking EGFR‐TKIs was 13.0 months (95% CI: 8.86–17.1 months). The duration of disease control by EGFR‐TKIs was 11 months shorter in the plasma ctDNA positive group than the ctDNA negative group (12.0 vs. 23.0 months, P = 0.02, log‐rank test, Fig 3c). In conclusion, the presence of mEGFR ctDNA was associated with poor survival in lung adenocarcinoma patients and poor treatment response to EGFR‐TKI treatment.
Figure 3.
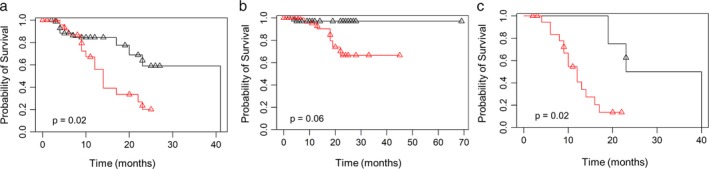
Survival analysis according to the presence of EGFR mutations in ctDNA. (a) PFS, (b) OS in lung adenocarcinoma (n = 81) and (c) PFS in lung adenocarcinoma patients treated with EGFR‐TKIs (n = 27). ( ) ctDNA negative, (
 ) ctDNA positive, (
 ) Censored ctDNA negative, and (
 ) Censored ctDNA positive.
Discussion
In this study, we demonstrated the high sensitivity and specificity of plasma ctDNA detection in NSCLC patients. The plasma ddPCR assay used in this study was similar to, or improved, compared with other ctDNA genotyping assays.14, 15, 16, 17, 18, 19 Previous studies have investigated the detection of plasma ctDNA only in patients with advanced NSCLC. In contrast, this study compared plasma ctDNA detection rates in early and advanced stages of NSCLC. These results showed that the plasma ddPCR assay was only useful in the advanced stage because it had relatively low diagnostic yields in the early stage. This study demonstrated the usefulness of a ddPCR‐based plasma genotyping assay was dependent on the cancer stage.
Previous studies have reported correlations between plasma ctDNA and factors associated with TNM staging. Lee et al. reported that plasma ctDNA is not correlated with primary tumor size, but is significantly correlated with the number of metastatic sites.16 Couraud et al. demonstrated that plasma ctDNA concentration was significantly associated with both cancer stage and the number of metastatic sites.17 Jia et al. showed that higher ctDNA quantities are correlated with bone metastasis.20 Similarly, this study showed that the detection of plasma ctDNA is significantly correlated with distant metastasis, especially in bone and brain metastasis.
In this study, five patients were EGFR mutation positive in plasma but negative in tissue samples. All false‐positive plasma samples resulted with L858R mutation and fractional abundance was 0.03, 0.12, 0.13, 0.13 and 0.16, respectively. Although the possibility of experimental artifacts could not be totally excluded, these inconsistencies in the EGFR mutation status between tissue and blood samples may be due to the heterogeneity of the tumor.21 Oxnard et al. revealed the presence of resistance point mutation T790M mutation in 78% of the 18 discordant cases (plasma positive/tissue negative).22 This study also showed that patients who were positive for T790M in plasma had the same treatment outcomes with third‐generation TKIs (eg. osimertinib) as patients where the mutation was evident in tissue samples. Therefore, even if there is wild‐type in tissue samples, close monitoring of prognosis is necessary if the patient's blood sample is mEGFR positive. In our data, five cases of false‐positive cases were reported: two in stage I, one in stage II, and two in stage IV. One patient with stage IV cancer was lost to follow‐up five months after diagnosis. Four patients were diagnosed three months before data collection, and are still under follow‐up without recurrence or death. Additional follow‐up is required to determine whether this difference (wild‐type in tissue and mEGFR in blood) is associated with prognosis of lung cancer.
This analysis also reported that 22 patients showed EGFR‐mutation in tissue but not in the paired plasma sample. Of the false‐negative cases, three received EGFR‐TKIs and had median PFS of 19 months. There was a longer duration of disease control by EGFR‐TKIs in the false‐negative group than the overall EGFR‐TKI treated group (19.0 vs. 13.0 months). This is probably due to the low mutation burden, which is likely to result in a low concentration of ctDNA released into the plasma and not detected in it. To determine whether these discordant results between tissue and blood sample affect the prognosis of NSCLC, additional data and analysis are required.
Recent reports suggested that presence of mEGFR ctDNA is associated with longer PFS and OS in advanced NSCLC patients treated with EGFR‐TKIs.23, 24 In this study, poor PFS and a trend toward shorter OS times were observed in lung adenocarcinoma patients with plasma mEGFR ctDNAs. In addition, this analysis also showed that EGFR mutations in ctDNA were associated with shorter duration of disease control in advanced lung adenocarcinoma patients treated with EGFR‐TKIs. Similar to our results, Mok et al. and Lee et al. found that EGFR mutations in ctDNA were correlated with poor PFS and OS in NSCLC patients treated with EGFR‐TKIs, suggesting that presence of plasma mEGFR ctDNA predicts a poor clinical outcome.14, 25
In conclusion, plasma‐based EGFR mutation analysis using ddPCR is a highly sensitive and specific test, especially in patients with advanced NSCLC. In addition, the detection of ctDNA with mutant EGFR is a biomarker for predicting distant metastasis and poor response to EGFR‐TKIs.
Disclosure
The authors declare that they have no competing interests.
Supporting information
Figure S1 ROC analysis of plasma ddPCR assay of lung adenocarcinoma tissue samples. (a) Overall stage, (b) Early stage (I–IIIA), and (c) Advanced stage (IIIB–IV) for E19d. (d) Overall stage, (e) Early stage (I–IIIA), and (f) Advanced stage (IIIB–IV) for L858R.
Figure S2 Fractional abundance values from plasma ddPCR assay, according to (a) T stage and (b) N stage.
Acknowledgments
This work was supported by the National Research Foundation of Korea (grant number NRF‐2017R1A2B4009017).
References
- 1. Bray F, Ferlay J, Soerjomataram I, Siegel RL, Torre LA, Jemal A. Global cancer statistics 2018: GLOBOCAN estimates of incidence and mortality worldwide for 36 cancers in 185 countries. CA Cancer J Clin 2018; 68 (6): 394–424. [DOI] [PubMed] [Google Scholar]
- 2. Greenlee RT, Murray T, Bolden S, Wingo PA. Cancer statistics, 2000. CA Cancer J Clin 2000; 50 (1): 7–33. [DOI] [PubMed] [Google Scholar]
- 3. Chang YS, Choi CM, Lee JC. Mechanisms of epidermal growth factor receptor tyrosine kinase inhibitor resistance and strategies to overcome resistance in lung adenocarcinoma. Tuberc Respir Dis (Seoul) 2016; 79 (4): 248–56. [DOI] [PMC free article] [PubMed] [Google Scholar]
- 4. Fukuoka M, Wu YL, Thongprasert S et al Biomarker analyses and final overall survival results from a phase III, randomized, open‐label, first‐line study of gefitinib versus carboplatin/paclitaxel in clinically selected patients with advanced non‐small‐cell lung cancer in Asia (IPASS). J Clin Oncol 2011; 29 (21): 2866–74. [DOI] [PubMed] [Google Scholar]
- 5. Han JY, Park K, Kim SW et al First‐SIGNAL: First‐line single‐agent iressa versus gemcitabine and cisplatin trial in never‐smokers with adenocarcinoma of the lung. J Clin Oncol 2012; 30 (10): 1122–8. [DOI] [PubMed] [Google Scholar]
- 6. Mok TS, Wu YL, Thongprasert S et al Gefitinib or carboplatin‐paclitaxel in pulmonary adenocarcinoma. N Engl J Med 2009; 361 (10): 947–57. [DOI] [PubMed] [Google Scholar]
- 7. Wu YL, Zhou C, Hu CP et al Afatinib versus cisplatin plus gemcitabine for first‐line treatment of Asian patients with advanced non‐small‐cell lung cancer harbouring EGFR mutations (LUX‐Lung 6): An open‐label, randomised phase 3 trial. Lancet Oncol 2014; 15 (2): 213–22. [DOI] [PubMed] [Google Scholar]
- 8. Zhou C, Wu YL, Chen G et al Erlotinib versus chemotherapy as first‐line treatment for patients with advanced EGFR mutation‐positive non‐small‐cell lung cancer (OPTIMAL, CTONG‐0802): A multicentre, open‐label, randomised, phase 3 study. Lancet Oncol 2011; 12 (8): 735–42. [DOI] [PubMed] [Google Scholar]
- 9. Xu T, Kang X, You X et al Cross‐platform comparison of four leading technologies for detecting EGFR mutations in circulating tumor DNA from non‐small cell lung carcinoma patient plasma. Theranostics 2017; 7 (6): 1437. [DOI] [PMC free article] [PubMed] [Google Scholar]
- 10. Oxnard GR, Paweletz CP, Kuang Y et al Noninvasive detection of response and resistance in EGFR‐mutant lung cancer using quantitative next‐generation genotyping of cell‐free plasma DNA. Clin Cancer Res 2014; 20 (6): 1698–705. [DOI] [PMC free article] [PubMed] [Google Scholar]
- 11. Thress KS, Paweletz CP, Felip E et al Acquired EGFR C797S mutation mediates resistance to AZD9291 in non‐small cell lung cancer harboring EGFR T790M. Nat Med 2015; 21 (6): 560–2. [DOI] [PMC free article] [PubMed] [Google Scholar]
- 12. Sacher AG, Paweletz C, Dahlberg SE et al Prospective validation of rapid plasma genotyping for the detection of EGFR and KRAS mutations in advanced lung Cancer. JAMA Oncol 2016; 2 (8): 1014–22. [DOI] [PMC free article] [PubMed] [Google Scholar]
- 13. Wang W, Song Z, Zhang Y. A comparison of ddPCR and ARMS for detecting EGFR T790M status in ctDNA from advanced NSCLC patients with acquired EGFR‐TKI resistance. Cancer Med 2017; 6 (1): 154–62. [DOI] [PMC free article] [PubMed] [Google Scholar]
- 14. Mok T, Wu YL, Lee JS et al Detection and dynamic changes of EGFR mutations from circulating tumor DNA as a predictor of survival outcomes in NSCLC patients treated with first‐line intercalated Erlotinib and chemotherapy. Clin Cancer Res 2015; 21 (14): 3196–203. [DOI] [PubMed] [Google Scholar]
- 15. Karachaliou N, Mayo‐de las casas C, Queralt C et al Association of EGFR L858R mutation in circulating free DNA with survival in the EURTAC trial. JAMA Oncol 2015; 1 (2): 149–57. [DOI] [PubMed] [Google Scholar]
- 16. Lee YJ, Yoon KA, Han JY et al Circulating cell‐free DNA in plasma of never smokers with advanced lung adenocarcinoma receiving gefitinib or standard chemotherapy as first‐line therapy. Clin Cancer Res 2011; 17 (15): 5179–87. [DOI] [PubMed] [Google Scholar]
- 17. Couraud S, Vaca‐Paniagua F, Villar S et al Noninvasive diagnosis of actionable mutations by deep sequencing of circulating free DNA in lung cancer from never‐smokers: A proof‐of‐concept study from BioCAST/IFCT‐1002. Clin Cancer Res 2014; 20 (17): 4613–24. [DOI] [PubMed] [Google Scholar]
- 18. Reck M, Hagiwara K, Han B et al ctDNA determination of EGFR mutation status in European and Japanese patients with advanced NSCLC: The ASSESS study. J Thorac Oncol 2016; 11 (10): 1682–9. [DOI] [PubMed] [Google Scholar]
- 19. Zhu G, Ye X, Dong Z et al Highly sensitive droplet digital PCR method for detection of EGFR‐activating mutations in plasma cell‐free DNA from patients with advanced non‐small cell lung Cancer. J Mol Diagn 2015; 17 (3): 265–72. [DOI] [PubMed] [Google Scholar]
- 20. Jia J, Huang B, Zhuang Z, Chen S. Circulating tumor DNA as prognostic markers for late stage NSCLC with bone metastasis. Int J Biol Markers 2018; 33 (2): 222–30. [DOI] [PubMed] [Google Scholar]
- 21. An SJ, Chen ZH, Su J et al Identification of enriched driver gene alterations in subgroups of non‐small cell lung cancer patients based on histology and smoking status. PLOS One 2012; 7 (6): e40109. [DOI] [PMC free article] [PubMed] [Google Scholar]
- 22. Oxnard GR, Thress KS, Alden RS et al Association between plasma genotyping and outcomes of treatment with Osimertinib (AZD9291) in advanced non‐small‐cell lung Cancer. J Clin Oncol 2016; 34 (28): 3375–82. [DOI] [PMC free article] [PubMed] [Google Scholar]
- 23. Fan G, Zhang K, Ding J, Li J. Prognostic value of EGFR and KRAS in circulating tumor DNA in patients with advanced non‐small cell lung cancer: A systematic review and meta‐analysis. Oncotarget 2017; 8 (20): 33922–32. [DOI] [PMC free article] [PubMed] [Google Scholar]
- 24. Mao C, Yuan JQ, Yang ZY et al Blood as a substitute for tumor tissue in detecting EGFR mutations for guiding EGFR TKIs treatment of nonsmall cell lung Cancer: A systematic review and meta‐analysis. Medicine 2015; 94 (21): e775. [DOI] [PMC free article] [PubMed] [Google Scholar]
- 25. Lee JY, Qing X, Xiumin W et al Longitudinal monitoring of EGFR mutations in plasma predicts outcomes of NSCLC patients treated with EGFR TKIs: Korean lung Cancer consortium (KLCC‐12‐02). Oncotarget 2016; 7 (6): 6984–93. [DOI] [PMC free article] [PubMed] [Google Scholar]
Associated Data
This section collects any data citations, data availability statements, or supplementary materials included in this article.
Supplementary Materials
Figure S1 ROC analysis of plasma ddPCR assay of lung adenocarcinoma tissue samples. (a) Overall stage, (b) Early stage (I–IIIA), and (c) Advanced stage (IIIB–IV) for E19d. (d) Overall stage, (e) Early stage (I–IIIA), and (f) Advanced stage (IIIB–IV) for L858R.
Figure S2 Fractional abundance values from plasma ddPCR assay, according to (a) T stage and (b) N stage.