

Abstract
Purpose
To determine the developmental competence of fast-cleaving D3 embryos.
Methods
Retrospective study including 4028 embryos from 513 PGT-A cycles performed between July 2014 and June 2017. Embryos were cultured in time-lapse incubators and biopsied at blastocyst stage. Embryos were classified in groups according to the number of cells on D3 (from 2-cell to ≥13 -cell and compacted). A generalized linear mixed model adjusted for confounding factors was performed to assess the chance to give rise to an euploid blastocyst in each group compared with the chance of 8-cell embryos. Implantation and live birth rates were also analyzed.
Results
The statistical analysis showed that embryos with 9 to 11 cells had a slightly lower euploid blastocyst rate than 8-cell embryos (OR (95% CI) 0.77 (0.61–0.96)) while embryos with more than 11 cells were found to be just as likely to give rise to an euploid blastocyst as the 8-cell embryos (OR (95% CI) 1.20 (0.92–1.56)). Conversely, slow-cleaving embryos had a significantly lower euploid blastocyst rate than 8-cell embryos (OR (95% CI) 0.31 (0.24–0.39)). Moreover, euploid blastocysts derived from fast-cleaving embryos and from 8-cell embryos exhibit similar live birth rates. No significant differences were found in the chance to give rise a live birth between 8-cell and 9- to 11-cell embryos (OR (95% CI) 1.23 (0.70–2.15)) and > 11-cell embryos (OR (95% CI) 1.09 (0.57–2.09)).
Conclusions
Embryos with more than 11 cells exhibit similar developmental competence to 8-cell embryos. Their poor prognosis should be reconsidered.
Electronic supplementary material
The online version of this article (10.1007/s10815-019-01574-y) contains supplementary material, which is available to authorized users.
Keywords: Fast-cleaving embryos, Cell number, Blastocyst rate, Euploidy rate, Implantation rate, Live birth rate
Introduction
Part of the success of assisted reproductive technologies (ART) lies in a good embryo selection. There are different embryo selection strategies, but the assessment of embryo cell number and morphology at certain checkpoints has been the most widely used method to evaluate embryo quality and to select embryos for transfer.
The cell number has been described as one of the most predictive parameters for blastocyst formation, implantation, and live birth rates [1]. It has been reported by scientific societies that embryos with 8 cells on day 3 (D3) have the best developmental potential while embryos with a fewer or higher number of cells have a poorer prognosis. In this context, the ESHRE-Alpha consensus [2] stated that embryos that cleave slower or faster than the optimal rate (8 cells at 68 ± 1 h post-insemination (hpi)) have a reduced implantation potential. Likewise, according to ASEBIR criteria [3], fast-cleaving embryos on D3 (> 8 cells at 68 ± 1 hpi) are included in categories with a lower implantation potential compared with 8-cell embryos, the category with the highest implantation potential. Similarly, the Society for Assisted Reproductive Technology Clinic Outcome Reporting System (SART CORS) [4] reported a positive association between the live birth rate and the increasing cell number up to 8 and a reduced rate in embryos with more than 8 cells.
However, there are several publications whose findings totally differed. As early as in the 2000s, these authors already observed that fast-cleaving embryos on D3 were just as likely to develop to the blastocyst stage as 8-cell embryos and much higher than slow-cleaving embryos [5–7]. More recently, another author [8] also reported increased blastocyst formation, implantation, and live birth rates with increased cell number.
When establishing correlations between embryo development and ploidy status, the few studies available show that fast-cleaving embryos have a higher percentage of chromosomal abnormalities when compared with 8-cell embryos [9, 10]. Similarly, Kroener recommended to prioritize for transfer embryos with 6–9 cells over embryos with > 9 cells [11].
Despite the remarkable changes in embryo culture systems in the last decade, little research has been accomplished to verify whether the current guidelines of scientific societies that recommend to select 8-cell embryos rather than fast-cleaving embryos still remain valid.
Consequently, in the absence of recent updates, the purpose of the study is to review these guidelines and update the prognosis of fast-cleaving D3 embryos by determining their developmental competence, their potential to give rise to euploid blastocysts, and to implant and give rise to live births.
Material and methods
Study population and design
All patients included in the study underwent intracytoplasmic sperm injection (ICSI) treatment with their own gametes and Preimplantation Genetic Testing for Aneuploidy (PGT-A) with trophectoderm biopsy and aCGH analysis at a university-affiliated private fertility clinic from July 2014 to June 2017. Only cycles with fresh oocytes and ejaculated sperm samples were included. The indications for PGT-A were advanced maternal age, repeated implantation failure, severe male factor, recurrent miscarriages, chromosomal translocations, and previous pregnancies affected of chromosomal abnormalities. The study was conducted after approval from the institutional review board (IRB).
This is a retrospective study of 4028 embryos that were classified in 11 groups based on the number of cells on D3 (from 2-cell to ≥13 -cell and compacted).
Ovarian stimulation, insemination, and culture protocols
Patients underwent ovarian stimulation with the use of recombinant and/or urinary gonadotropins (rFSH or hMG) in a long GnRH agonist or a flexible GnRH antagonist protocol as previously described [12].
Ovulation was triggered either with recombinant hCG (r-hCG) (Ovitrelle®, Merck Serono, Madrid, Spain) or with GnRH agonist (triptorelin acetate, Decapeptyl®, Ipsen Pharma SA, Barcelona, Spain) when the diameter of the leading follicle(s) was > 18 mm and ultrasound-guided oocyte retrieval was carried out 36 h after trigger.
Retrieved oocytes were immediately placed in fertilization culture medium (Global Fertilization®, LifeGlobal®) and cultured in a conventional incubator at 37 °C and 6% CO2. Cumulus-oocyte complexes were denuded 2 h post-retrieval and then, at least 4 h post-retrieval, the matured MII oocytes were microinjected. Following ICSI, embryos were cultured in single-step medium (Global®, LifeGlobal®) and incubated in time-lapse-monitored incubators (EmbryoScope®; Geri®) where culture conditions were set at 37 °C, 6% CO2, and 5% O2.
Embryo and morphology assessment
Embryos were assessed for cell number and other morphological features based on ASEBIR’s scoring system [3] at 68 ± 1 hpi, the standardized and recommended time post-insemination for D3 [2].
In the present study, the 8-cell embryo group has been defined as the reference group since it is considered to be the optimal embryo developmental rate for D3 [1]. Embryos that have less than 8 cells are named “slow-cleaving embryos” while embryos with more than 8 cells, “fast-cleaving embryos”.
Regarding blastocyst stage morphology, the ASEBIR scoring system is similar to Gardner grading [13], based on the degree of blastocoel expansion and trophectoderm and inner cell mass morphology.
Blastocyst biopsy and genetic analysis
After laser-zona opening on D3, embryos were biopsied at the blastocyst stage on day 5, day 6, or day 7 using laser technology as previously described [14]. A blastocyst suitable for biopsy has a well-defined inner cell mass and a hatching trophectoderm with multiple cells (it should be at least a grade C blastocyst in the ASEBIR scoring system) [3]. Three to eight trophectoderm cells were removed and the biopsied blastocysts were vitrified using the media and protocols regularly used in our center [15].
Biopsied trophectoderm cells were washed in droplets of phosphate-buffered saline (PBS) with 0.1% polyvinyl alcohol (PVA) and were deposited in PCR tubes with 1.5 μl of PBS in sterile conditions. Samples were kept frozen at − 80 °C until processing for analysis. Whole-genome amplification was performed using the commercial kit SurePlex® DNA Amplification (Illumina®, USA). Amplified DNA samples were processed for aCGH analysis using the kit 24Sure® Microarray Pack (Illumina®, USA) following the manufacturer’s instructions. For the scanning of arrays, an Innopsys 70 scanner was used and images obtained were interpreted by the software Bluefuse® (Illumina®, USA). Blastocysts were classified as euploid, aneuploid, or undiagnosed (if DNA sample did not amplify or results were inconclusive).
Outcomes
The primary outcome was the blastocyst rate defined as the proportion of D3 embryos that achieved the blastocyst stage and were biopsied out of the total number of D3 embryos. The secondary outcome was the euploid blastocyst rate defined as the proportion of blastocyst diagnosed as euploid out of the total number of D3 embryos. Tertiary outcomes were implantation and live birth rates.
Statistics
Continuous variables were described with mean and standard deviation (SD) while categorical variables were described with number (n) and percentage (%). A Chi-square test was used when comparing categorical variables. A logistic regression was used to find differences statistically significant in categorical variables which had more than two categories (implantation rate and live birth rate). A mixed model adjusted for confounding factors, maternal age, paternal age, seminal quality, and embryo multinucleation as fixed effects and patient as random effect (which was used to model the random variation and the covariance between different embryos obtained from the same individual) was performed to assess the probability to achieve the blastocyst stage and the chance to give rise to euploid embryos. Each group (from 2-cell to > 12-cell and compacted) was compared with 8-cell embryos as the reference group. Because the OR for 9-cell, 10-cell, and 11-cell embryos fell below 1.0 and the small sample size in these groups, embryo groups with similar OR were combined in order to increase the power of the analysis. Thus, the embryos were stratified in four groups: slow-cleaving embryos; 8-cell embryos; fast-cleaving embryos from 9-cell to 11-cell embryos; and fast-cleaving embryos with more than 11 cells. Statistical analyses were performed with IBM© SPSS© Statistics v 22 and SAS Institute Inc. 2014. Base SAS® 9.4 Procedures Guide. Cary NC: SAS Institute Inc. For all comparisons, a statistical significance was set at p value of < 0.05.
Results
Overall characteristics
A total of 4028 embryos from 513 PGT-A cycles from 381 patients were retrospectively analyzed. The mean women’ age was 39.24 ± 3.54 years (range 24–46) and the mean number of cycles per patient was 1.35 (range 1–4). The overall biological characteristics and clinical outcomes are summarized in Supplemental Table 1.
On day 3 of culture, the 4028 embryos were stratified in 11 groups based on the number of cells (from 2-cell to > 12-cell and compacted group). Embryo distribution among the groups is included in Supplemental Table 2. Overall, 30.2% (1216/4028) are slow-cleaving embryos, 33.7% (1358/4028) had 8 cells, and 36.1% (1454/4028) are fast-cleaving embryos. Some of the groups (2-cell and 3-cell embryos; 4-cell and 5-cell embryos) were pooled because the blastocyst formation rates were comparable.
Blastocyst formation
In the present study, 52.9% (2129/4028) of embryos reached the blastocyst stage and were biopsied. No blastocysts were obtained from 2-cell or 3-cell embryos on D3. The blastocyst rate for each embryo group is shown in Fig. 1.
Fig. 1.
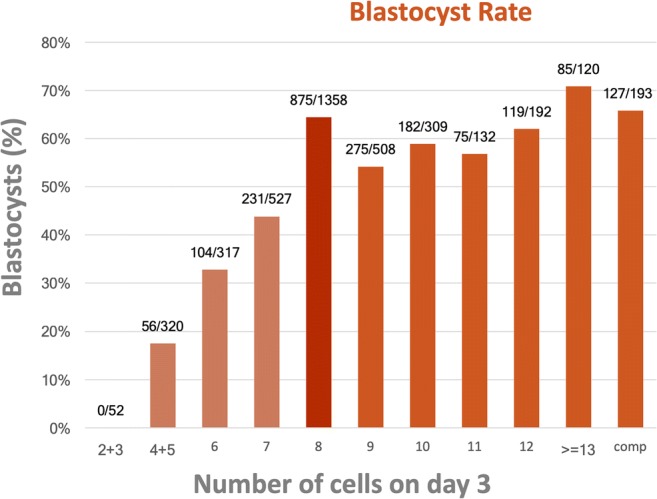
Blastocyst rate according to the number of cells on day 3
When the mixed model was performed, all slow-cleaving embryo groups showed a significantly lower blastocyst rate compared with the reference group, with the fewer the cells on D3, the lower the blastocyst rate. On the other hand, all groups of fast-cleaving D3 embryos, except the 9-cell group, were found to be just as likely to give rise to a blastocyst as the 8-cell embryos. The adjusted odds ratio (OR) with the 95% confidence interval (CI) for every analyzed group are shown in Table 1.
Table 1.
Mixed effects logistic regression model for blastocyst formation adjusted for confounding factors*
| Adjusted OR | 95% CI | |
|---|---|---|
| Cell number | ||
| 4–5 | 0.12 | [0.08; 0.16] |
| 6 | 0.26 | [0.19; 0.34] |
| 7 | 0.43 | [0.35; 0.54] |
| 8 | 1 | – |
| 9 | 0.69 | [0.55; 0.86] |
| 10 | 0.80 | [0.61; 1.00] |
| 11 | 0.74 | [0.50; 1.09] |
| 12 | 0.93 | [0.66; 1.30] |
| > = 13 | 1.36 | [0.88; 2.09] |
| Compacted | 1.14 | [0.81; 1.61] |
| <8-cell | 0.25 | [0.21;0.30] |
| 8 | 1 | – |
| 9–10–11-cell | 0.73 | [0.61; 0.87] |
| > 11-cell | 1.12 | [0.89; 1.42] |
*Confounding factors: female age, paternal age, seminal quality, embryo multinucleation, and patient
OR, odds ratio; CI, confidence interval
After combining groups, it was found that the 9-cell to 11-cell embryos had a significantly lower blastocyst rate than 8-cell embryos (OR (95% CI) 0.73 (0.61–0.87)). In contrast, the embryos with more than 11 cells were as likely to give rise to a blastocyst than the 8-cell embryo group. Data are shown in Table 1.
When considering the day at which the blastocyst stage was reached, fast-cleaving D3 embryos reached the stage at a similar rate and day than 8-cell embryos and sooner than slow-cleaving D3 embryos. Thus, 7.1% of the slow-cleaving embryos, 28.9% of the 8-cell embryos, 27.8% of the 9-cell to 11-cell embryos, and 43.2% of > 11-cell embryos reach the blastocyst stage on day 5 while the rate for day 6 was 18.2% for the slow-cleaving embryos, 31.1% for 8-cell embryos, 26.0% for 9-cell to 11-cell embryos, and 20.0% for > 11-cell embryos. The fewer the cells on D3, the more delayed blastocyst formation (p < 0.001) Supplemental Table 3.
With respect to blastocyst quality, a total of 1656 blastocysts were graded for inner cell mass (ICM) and trophectoderm (TE) score. It was observed that blastocysts derived from slow-cleaving embryos had a higher percentage of grade C ICM (39.3%) and grade C TE (55.1%) when compared with other groups Supplemental Table 4.
Chromosomal constitution
Of the 2129 biopsied blastocysts, a conclusive diagnosis was obtained from 95.4% (2031/2129) of them and 33.5% (713/2129) was diagnosed as euploid. When considering all D3 embryos, the percentage of embryos that reached the blastocyst stage and were categorized as euploid was 17.7% (713/4018). The euploid blastocyst rate for each embryo group is shown in Fig. 2.
Fig. 2.
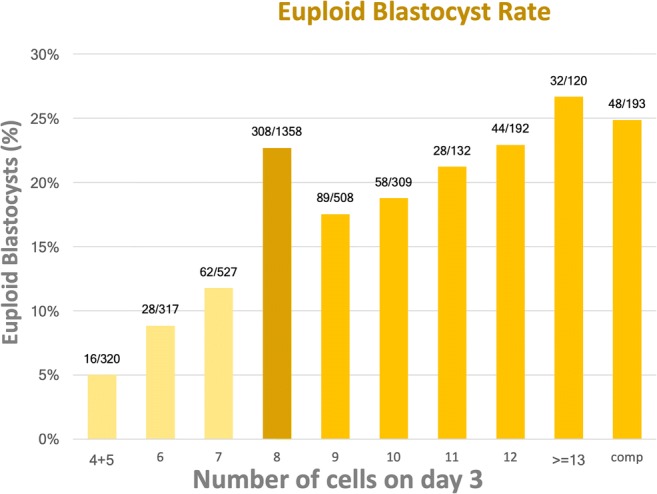
Euploid blastocyst rate according to the number of cells on day 3
The analysis of the mixed model showed that the probability of all fast-cleaving D3 embryo groups to give rise to an euploid blastocyst was not significantly different from the chance of 8-cell embryos. In the opposite situation, all slow-cleaving D3 embryo groups had a significantly reduced likelihood of becoming euploid blastocysts compared with 8-cell D3 embryos. The results were valid for every analyzed fast-cleaving day 3 group Table 2. After combining groups, it was observed that the 9-cell to 11-cell embryos had a significantly lower euploid blastocyst rate than 8-cell embryos (OR (95% CI) 0.77 (0.61–0.96)). The results are shown in Table 2.
Table 2.
Mixed effects logistic regression model for blastocyst euploidy adjusted for confounding factors*
| Adjusted OR | 95% CI | |
|---|---|---|
| Cell number | ||
| 4–5 | 0.18 | [0.10; 0.31] |
| 6 | 0.29 | [0.18; 0.44] |
| 7 | 0.44 | [0.32; 0.60] |
| 8 | 1 | – |
| 9 | 0.76 | [0.57; 1.01] |
| 10 | 0.72 | [0.51; 1.01] |
| 11 | 0.95 | [0.60; 1.51] |
| 12 | 1.11 | [0.75; 1.63] |
| > = 13 | 1.35 | [0.85; 2.15] |
| Compacted | 1.19 | [0.81; 1.76] |
| < 8-cell | 0.31 | [0.24; 0.39] |
| 8 | 1 | – |
| 9–10–11-cell | 0.77 | [0.61; 0.96] |
| > 11-cell | 1.20 | [0.92; 1.56] |
*Confounding factors: female age, paternal age, seminal quality, embryo multinucleation, and patient
OR, odds ratio; CI, confidence interval
Implantation and live birth rates
A further analysis was conducted to identify the competence of euploid blastocysts to implant and to give rise to a live birth. Two hundred ninety-seven euploid blastocysts were transferred in single-embryo transfer (SET). Data from each embryo group is shown in Table 3.
Table 3.
Implantation and live birth rates according to the number of cells on day 3
| Cell number | Blastocysts transferred | Implantation rate | Live birth rate |
|---|---|---|---|
| 4–5 | 6 | 16.7% (1) | 16.7% (1) |
| 6 | 10 | 30.0% (3) | 20.0% (2) |
| 7 | 19 | 52.6% (10) | 36.8% (7) |
| 8 | 133 | 58.6% (78) | 51.9% (69) |
| 9 | 46 | 67.4% (31) | 63.0% (29) |
| 10 | 22 | 59.1% (13) | 36.4% (8) |
| 11 | 11 | 72.7% (8) | 72.7% (8) |
| 12 | 23 | 73.9% (17) | 65.2% (15) |
| > = 13 | 12 | 83.3% (10) | 58.3% (7) |
| Compacted | 15 | 47.7% (7) | 33.3% (5) |
| Total | 297 | 59.9% (178) | 50.8% (151) |
The overall implantation rate (IR) was 59.9% (178/297) being 40.0% (14/35) for slow-cleaving embryos, 58.6% (78/133) for 8-cell embryos, 65.8% (52/79) for 9-cell to 11-cell embryos, and 68.0% (34/50) for embryos with more than 11 cells with a correlation found between the cleavage rate and implantation (p = 0.039). When performing the univariate analysis, no significant differences between 8-cell embryos and all other embryo groups were found: slow-cleaving embryos (OR (95% CI) 0.47 (0.22–1.01)); 9–11-cell embryos (OR (95% CI) 1.36 (0.76–2.42)); > 11-cell embryos (OR (95% CI) 1.50 (0.75–2.98)).
One hundred fifty-one healthy children were born meaning an overall live birth rate (LBR) of 50.8% (151/297). Blastocysts derived from slow-cleaving embryos resulted in a LBR of 28.6% (10/35), 51.9% (69/133) for those derived from 8-cell embryos, 57.0% (45/79) from 9-cell to 11-cell embryos, and 54.0% (27/50) from embryos with more than 11 cells, with a correlation found between the cleavage rate and live birth (p = 0.039). When the univariate analysis was performed, no significant differences were found between 8-cell and 9- to 11-cell embryos (OR (95% CI) 1.23 (0.70–2.15)) and > 11-cell embryos (OR (95% CI) 1.09 (0.57–2.09)). Slow-cleaving embryos had a decreased likelihood to give rise to a live birth (OR (95% CI) 0.37 (0.17–0.83)).
Discussion
Our findings are in line with the general consensus about the reduced developmental potential of slow-cleaving embryos whereas the developmental competence of fast-cleaving embryos remains a controversial issue.
To our knowledge, this is the largest study about the developmental competence of D3 embryos analyzing every developmental stage from blastocyst formation to live births as the endpoint.
Both in terms of blastocyst formation and ploidy, the current study distinguishes two groups of fast-cleaving embryos that differ in developmental capacity. The embryos with 9 to 11 cells with a reduced developmental potential compared with 8-cell embryos but threefold higher than the slow-cleaving embryos and the embryos with more than 11 cells, with similar competence to 8-cell embryos.
Regarding the blastocyst formation, our results concerning embryos with more than 11 cells are supported by previous studies that reported no differences between fast-cleaving and 8-cell embryos [5–7, 16]. The insight from morphokinetics can contribute to the explanation for the reduced blastocyst rate for 9-cell to 11-cell embryos. Kong et al. [8] studied the relationship between division behavior, cell number, and developmental potential of cleavage-stage human embryos by time-lapse imaging. The authors found that 9-cell to 10-cell and > 10-cell embryos exhibited an increased incidence of direct cleavage (45.8% and 33.3%, respectively) compared with 7- and 8-cell embryos (11.1%). They also found that the developmental competence of D3 embryos increased with the cell number after excluding embryos with abnormal division. Hence, a higher incidence of direct cleavage could lead to a lower blastocyst rate in embryos from 9 to 11 cells. Another interpretation can be related to the synchrony of cell cycles [17, 18]. Specifically, regarding the fourth cell cycle, if cells divided synchronously, it would be more likely to find embryos with more than 11 cells. Therefore, the lack of synchrony in these embryos could be the cause of a decreased competence.
The current study demonstrates that the ploidy of > 11-cell embryos is comparable with that of 8-cell embryos. This finding is in disagreement with most of the previous publications on the relationship between chromosomal status and the number of cells on D3 [9–11] that reported a higher incidence of chromosomal abnormalities in fast-cleaving embryos. It has to be stated that there are important methodological differences between some of these papers and our work. First, previous studies performed the genetic analysis at the cleavage stage while embryos from our study were biopsied at the blastocyst stage. Secondly, the genetic testing of the embryos in some articles [9, 10] was analyzed by FISH while aCGH is the technique used in the present work. Thirdly, a limited number of fast-cleaving embryos were studied in those previous studies compared with the large number included in our research. And finally, it has to be noted that the endpoint of these publications was the aneuploidy rate and data about implantation or live births were not reported.
Our work also reveals that when a euploid blastocyst derived from a fast-cleaving embryo is transferred, it exhibits similar IR and LBR to the one derived from an 8-cell embryo, both being superior to the results obtained with a euploid blastocyst derived from a slow-cleaving embryo. No data have been found in the literature that, by transferring euploid blastocysts arising from fast-cleaving embryos, confirm or contradict our results.
There are some publications [19, 20] that have reported a lower implantation potential for fast-cleaving embryos and those were the ones used as a reference to establish the ESHRE-Alpha consensus. Today, these studies, published in the 1990s, show a number of remarkable limitations. The results were based on transfers on D2 and a reduced number of fast-cleaving embryos analyzed (146 and 47, respectively). Moreover, the embryos were grown in the media and culture conditions available 20 years ago that nowadays might be considered suboptimal. Finally, no statistical analysis adjusted by confounding factors such as female age was performed. As mentioned before, at about the same time but with different culture conditions, pioneers of extended culture reported that fast-cleaving embryos were as competent as 8-cell embryos [5, 6].
Data from morphokinetic studies support the hypothesis of our work that the developmental potential of fast-cleaving embryos is not compromised. One of the latest published morphokinetic algorithms [21] considers 8 cells at 66 hpi as a criterion in the decision tree. As a result of its application, they found that embryos with less than 8 cells at 66 hpi had a lower implantation potential than embryos with 8 or more cells. Another study, published by our group [22], reported that embryos with t8 < 61.7 hpi yielded a higher implantation rate than embryos reaching 8 cells later.
Changes in culture systems during the last decade have contributed favorably to embryo development to the blastocyst stage that, otherwise, in suboptimal conditions, would not have been achieved, changes such as the composition of the culture media from simple salt solution to complex media [23], greater stability of the incubation systems [24] or the reduction in oxygen tension [25, 26]. Embryo culture in time-lapse-monitored incubators deliver continuous information on the embryo development and morphokinetics while providing an uninterrupted and stable culture. Lowering oxygen concentration from 20 to 5% has been demonstrated beneficial for embryo development as published by several studies. Kirkegaard et al. [26], using time-lapse monitoring, found a significant reduction in development at the 8-cell and blastocyst stages along with a delay in completion of the third cell cycle under 20% O2. Previously, Kovacic and Vlaisavljević [25] had reported better embryo morphology and a higher blastulation rate under 5% O2. In fact, the later authors published that, at lower oxygen concentration, a higher mean proportion of fast-cleaving embryos (7 or more cells in their criterion) was observed on D3.
It is in these improved laboratory conditions in which our study has been performed. All embryos included in the present study have been cultured to the blastocyst stage in time-lapse-monitored incubators which provide homogenous, controlled, and stable culture conditions. An accurate assessment of the cell number was performed due to the advantages offered by time-lapse technologies in contrast to daily checking. Standardized methodology (ICSI, PGT-A, aCGH, blastocyst stage biopsy) is applied in all the cycles as well. Furthermore, and most importantly, this is the largest sample reported so far. Comparing with previously mentioned studies, the number of embryos analyzed enhances the reliability of the outcomes of fast-cleaving embryos. It is noteworthy that despite the retrospective nature of the study, the selection of the biopsied or transferred blastocysts was not based on the number of cells on D3 but on the ploidy and the morphological status.
Our results can be used in clinical practice in the IVF laboratories to improve embryo selection on D3 and to update the embryo prognosis. It is important to highlight that our data indicate a different ranking of developmental potential from current recommendations. Based on our results, the ranking order for transfer on D3 should be in the first place, 8-cell or > 11-cell embryos; in the second one, 9-cell to 11-cell embryos; and lastly, slow-cleaving embryos. As an example, setting aside the presence of severe morphological abnormalities, a 9-cell embryo must be selected for transfer over a 7-cell embryo.
Data from our study regarding the developmental potential of fast-cleaving embryos can be used to update the recommendations published by scientific societies (ESHRE-Alpha and ASEBIR).
Electronic supplementary material
(DOCX 63.2 kb)
(DOCX 12.9 kb)
(DOCX 53.5 kb)
(DOCX 27.1 kb)
Acknowledgements
This work was performed under the auspices of “Càtedra d’Investigació en Obstetricia i Ginecologia” of Department of Obstetrics, Gynaecology and Reproductive Medicine; Hospital Universitari Dexeus, Universitat Autònoma de Barcelona.
Author’s contribution
M.C.P. and B.C. designed the study, interpreted the data, and wrote the manuscript. M.P., M.B., and A.V. edited and reviewed the manuscript. S.G. conducted the statistical analysis. I.G-F, B.C., and P.B. reviewed the manuscript. All authors approved the final version of the manuscript.
Compliance with ethical standards
Conflict of interest
The authors declare that they have no conflict of interest.
Footnotes
Publisher’s note
Springer Nature remains neutral with regard to jurisdictional claims in published maps and institutional affiliations.
References
- 1.Racowsky C, Jackson KV, Cekleniak NA, Fox JH, Hornstein MD, Ginsburg ES. The number of eight-cell embryos is a key determinant for selecting day 3 or day 5 transfer. Fertil Steril. 2000;73:558–564. doi: 10.1016/S0015-0282(99)00565-8. [DOI] [PubMed] [Google Scholar]
- 2.Alpha Scientists in Reproductive Medicine and ESHRE Special Interest Group of Embryology The Istanbul consensus workshop on embryo assessment: proceedings of an expert meeting. Hum Reprod. 2011;26:1270–1283. doi: 10.1093/humrep/der037. [DOI] [PubMed] [Google Scholar]
- 3.Cuevas Saiz I, Pons Gatell MC, Cuadros Vargas M, Delgado Mendive A, Rives Enedáguila N, Moragas Solanes M, et al. The embryology interest group: updating ASEBIR’s morphological scoring system for early embryos, morulae and blastocysts. Med Reprod Embriol Clín. 2018;5:42–54. [Google Scholar]
- 4.Racowsky C, Stern JE, Gibbons WE, Behr B, Pomeroy KO, Biggers JD. National collection of embryo morphology data into Society for Assisted Reproductive Technology Clinic Outcomes Reporting System: associations among day 3 cell number, fragmentation and blastomere asymmetry, and live birth rate. Fertil Steril. 2011;95:1985–1989. doi: 10.1016/j.fertnstert.2011.02.009. [DOI] [PubMed] [Google Scholar]
- 5.Shapiro BS, Harris DC, Richter KS. Predictive value of 72-hour blastomere cell number on blastocyst development and success of subsequent transfer based on the degree of blastocyst development. Fertil Steril. 2000;73:582–586. doi: 10.1016/S0015-0282(99)00586-5. [DOI] [PubMed] [Google Scholar]
- 6.Langley MT, Marek DM, Gardner DK, Doody KM, Doody KJ. Extended embryo culture in human assisted reproduction treatments. Hum Reprod. 2001;16:902–908. doi: 10.1093/humrep/16.5.902. [DOI] [PubMed] [Google Scholar]
- 7.Luna M, Copperman AB, Duke M, Ezcurra D, Sandler B, Barritt J. Human blastocyst morphological quality is significantly improved in embryos classified as fast on day 3 (>or=10 cells), bringing into question current embryological dogma. Fertil Steril. 2008;89:358–363. doi: 10.1016/j.fertnstert.2007.03.030. [DOI] [PubMed] [Google Scholar]
- 8.Kong X, Yang S, Gong F, Lu C, Zhang S, Lu G, Lin G. The relationship between cell number, division behavior and developmental potential of cleavage stage human embryos: a time-lapse study. PLoS One. 2016;11:e0153697. doi: 10.1371/journal.pone.0153697. [DOI] [PMC free article] [PubMed] [Google Scholar]
- 9.Magli MC, Gianaroli L, Ferraretti AP, Lappi M, Ruberti A, Farfalli V. Embryo morphology and development are dependent on the chromosomal complement. Fertil Steril. 2007;87:534–541. doi: 10.1016/j.fertnstert.2006.07.1512. [DOI] [PubMed] [Google Scholar]
- 10.Finn A, Scott L, O’Leary T, Davies D, Hill J. Sequential embryo scoring as a predictor of aneuploidy in poor-prognosis patients. Reprod BioMed Online. 2010;21:381–390. doi: 10.1016/j.rbmo.2010.05.004. [DOI] [PubMed] [Google Scholar]
- 11.Kroener LL, Ambartsumyan G, Pisarska MD, Briton-Jones C, Surrey M, Hill D. Increased blastomere number in cleavage-stage embryos is associated with higher aneuploidy. Fertil Steril. 2015;103:694–698. doi: 10.1016/j.fertnstert.2014.12.090. [DOI] [PubMed] [Google Scholar]
- 12.Barri PN, Martinez F, Coroleu B, Tur R. The role of GnRH antagonists in assisted reproduction. Reprod BioMed Online. 2002;5(Suppl 1):14–19. doi: 10.1016/S1472-6483(11)60212-5. [DOI] [PubMed] [Google Scholar]
- 13.Gardner DK, Schoolcraft WB. In vitro culture of human blastocyst. Jansen R Mortimer Eds Reprod certain Infertil genet 1999. Carnforth: Parthenon Press; 1999. p. 378–388.
- 14.Veiga A, Sandalinas M, Benkhalifa M, Boada M, Carrera M, Santaló J, Barri PN, Ménézo Y. Laser blastocyst biopsy for preimplantation diagnosis in the human. Zygote. 1997;5:351–354. doi: 10.1017/S0967199400003920. [DOI] [PubMed] [Google Scholar]
- 15.Kuwayama M, Vajta G, Ieda S, Kato O. Comparison of open and closed methods for vitrification of human embryos and the elimination of potential contamination. Reprod BioMed Online. 2005;11:608–614. doi: 10.1016/S1472-6483(10)61169-8. [DOI] [PubMed] [Google Scholar]
- 16.MacKenna A, Crosby J, Zegers-Hochschild F. Embryo early cleavage, number of blastomeres and morphology at day three as factors to predict blastocyst development. JBRA Assist Reprod. 2013;17:158–161. doi: 10.5935/1518-0557.20130053. [DOI] [Google Scholar]
- 17.Meseguer M, Herrero J, Tejera A, Hilligsøe KM, Ramsing NB, Remohí J. The use of morphokinetics as a predictor of embryo implantation. Hum Reprod. 2011;26:2658–2671. doi: 10.1093/humrep/der256. [DOI] [PubMed] [Google Scholar]
- 18.Motato Y, de los Santos MJ, Escriba MJ, Ruiz BA, Remohí J, Meseguer M. Morphokinetic analysis and embryonic prediction for blastocyst formation through an integrated time-lapse system. Fertil Steril. 2016;105:376–384.e9. doi: 10.1016/j.fertnstert.2015.11.001. [DOI] [PubMed] [Google Scholar]
- 19.Giorgetti C, Terriou P, Auquier P, Hans E, Spach JL, Salzmann J, Roulier R. Embryo score to predict implantation after in-vitro fertilization: based on 957 single embryo transfers. Hum Reprod. 1995;10:2427–2431. doi: 10.1093/oxfordjournals.humrep.a136312. [DOI] [PubMed] [Google Scholar]
- 20.Ziebe S, Petersen K, Lindenberg S, Andersen AG, Gabrielsen A, Andersen AN. Embryo morphology or cleavage stage: how to select the best embryos for transfer after in-vitro fertilization. Hum Reprod. 1997;12:1545–1549. doi: 10.1093/humrep/12.7.1545. [DOI] [PubMed] [Google Scholar]
- 21.Petersen BM, Boel M, Montag M, Gardner DK. Development of a generally applicable morphokinetic algorithm capable of predicting the implantation potential of embryos transferred on day 3. Hum Reprod Oxf Engl. 2016;31:2231–2244. doi: 10.1093/humrep/dew188. [DOI] [PMC free article] [PubMed] [Google Scholar]
- 22.Carrasco B, Arroyo G, Gil Y, Gómez MJ, Rodríguez I, Barri PN, Veiga A, Boada M. Selecting embryos with the highest implantation potential using data mining and decision tree based on classical embryo morphology and morphokinetics. J Assist Reprod Genet. 2017;34:983–990. doi: 10.1007/s10815-017-0955-x. [DOI] [PMC free article] [PubMed] [Google Scholar]
- 23.Sunde A, Brison D, Dumoulin J, Harper J, Lundin K, Magli MC, van den Abbeel E, Veiga A. Time to take human embryo culture seriously. Hum Reprod. 2016;31:2174–2182. doi: 10.1093/humrep/dew157. [DOI] [PubMed] [Google Scholar]
- 24.Rubio I, Galán A, Larreategui Z, Ayerdi F, Bellver J, Herrero J, Meseguer M. Clinical validation of embryo culture and selection by morphokinetic analysis: a randomized, controlled trial of the EmbryoScope. Fertil Steril. 2014;102:1287–1294.e5. doi: 10.1016/j.fertnstert.2014.07.738. [DOI] [PubMed] [Google Scholar]
- 25.Kovacic B, Vlaisavljević V. Influence of atmospheric versus reduced oxygen concentration on development of human blastocysts in vitro: a prospective study on sibling oocytes. Reprod BioMed Online. 2008;17:229–236. doi: 10.1016/S1472-6483(10)60199-X. [DOI] [PubMed] [Google Scholar]
- 26.Kirkegaard K, Hindkjaer JJ, Ingerslev HJ. Effect of oxygen concentration on human embryo development evaluated by time-lapse monitoring. Fertil Steril. 2013;99:738–744.e4. doi: 10.1016/j.fertnstert.2012.11.028. [DOI] [PubMed] [Google Scholar]
Associated Data
This section collects any data citations, data availability statements, or supplementary materials included in this article.
Supplementary Materials
(DOCX 63.2 kb)
(DOCX 12.9 kb)
(DOCX 53.5 kb)
(DOCX 27.1 kb)