Abstract
Monoclonal antibodies (mAbs) represent an important platform for the development of biotherapeutic products. Most mAbs are produced in mammalian cells, but several mAbs are made in Escherichia coli, including therapeutic fragments. The NISTmAb is a well-characterized reference material made widely available to facilitate the development of both originator biologics and biosimilars. Here, when expressing NISTmAb from codon-optimized constructs in E. coli (eNISTmAb), a truncated variant of its heavy chain was observed. N-terminal protein sequencing and mutagenesis analyses indicated that the truncation resulted from an internal translation initiation from a GTG codon (encoding Val) within eNISTmAb. Using computational and biochemical approaches, we demonstrate that this translation initiates from a weak Shine–Dalgarno sequence and is facilitated by a putative ribosomal protein S1-binding site. We also observed similar internal initiation in the mAb adalimumab (the amino acid sequence of the drug Humira) when expressed in E. coli. Of note, these internal initiation regions were likely an unintended result of the codon optimization for E. coli expression, and the amino acid pattern from which it is derived was identified as a Pro-Ser-X-X-X-Val motif. We discuss the implications of our findings for E. coli protein expression and codon optimization and outline possible strategies for reducing the likelihood of internal translation initiation and truncated product formation.
Keywords: translation initiation, translation regulation, Escherichia coli (E. coli), monoclonal antibody, protein expression, recombinant protein expression, codon optimization, GTG codon, mAb, NISTmAb, Shine-Dalgarno sequence
Introduction
Monoclonal antibodies (mAbs) represent the largest platform for the development of biotherapeutic products and are often expressed in mammalian cells to enable glycosylation and other post-translational modifications, which play an important role in mAb function. However, some mAbs are made in Escherichia coli (1–8), including therapeutic fragments (9, 10).
In 2016, the National Institute of Standards and Technology (NIST)2 released a reference IgG1κ antibody, Reference Material 8671, generated against respiratory syncytial virus, and colloquially referred to as the NISTmAb. The NISTmAb is expressed in mammalian cells and is widely available to facilitate the development of both originator biologics and biosimilars (11). The NISTmAb was also used as a model system for the development of mAb expression in E. coli, particularly for isotopic labeling (12).
SHuffle, a genetically engineered E. coli strain, aids in disulfide bond formation in the otherwise reductive environment of the cytoplasm (13). When the NISTmAb was expressed in SHuffle cells (12) it was observed that in addition to the full-length heavy and light chains forming the desired product, termed “eNISTmAb,” a copurifying truncated product derived from the heavy chain was also formed. Further studies indicated that the truncated product results from internal translation initiation (hereafter referred to as “internal initiation”) and not protease cleavage during E. coli expression (12).
In E. coli, ATG (AUG in RNA) is the predominant translation initiation (“start”) codon and initiates ∼83% of open reading frames (ORFs) in the E. coli genome. Less frequently, other initiation codons are also used, including GTG (GUG) (14%) and TTG (UUG) (3%) (14). Although GTG and TTG encode valine and leucine, respectively, they can also function as start codons because they are capable of binding the anticodon of initiator tRNAfMet. Using N-terminal Edman sequencing and site-directed mutagenesis it was shown that the internal initiation site within the heavy chain of the eNISTmAb arises from a GTG codon (encoding Val214 in the full-length protein) (12).
Canonical translation initiation complexes in E. coli form through the binding of a 30S ribosomal subunit to a ribosome-binding site on the mRNA ∼6–8 bases upstream of the start codon (15, 16). This interaction is base pair (bp)-specific and identified in the mRNA and 16S rRNA as the Shine–Dalgarno (SD) sequence (AGGAGG) and the anti-SD sequence, respectively (17). Not all bacterial genes, however, contain SD sequences or 5′-untranslated regions (5′-UTRs), and these genes employ other mechanisms of translation initiation (18–21).
In the present study, the nucleotides of the DNA sequences surrounding the GTG internal initiation site from the eNISTmAb were systematically narrowed to produce a shortened mRNA that supports efficient internal translation initiation activity in the widely used E. coli BL21(DE3) strain. Detailed examination of the minimal sequence revealed the presence of a weak SD sequence. The sequence required for internal initiation was characterized using site-directed mutagenesis, computational mRNA 2D structure prediction, and antisense oligonucleotide translation inhibition. These findings were then extended to an additional E. coli–produced mAb, adalimumab, which contains the same amino acid sequence as the drug Humira. The implications of these results for E. coli heterologous protein expression and codon optimization are discussed.
Results
Determining the regulatory region responsible for the internal initiation
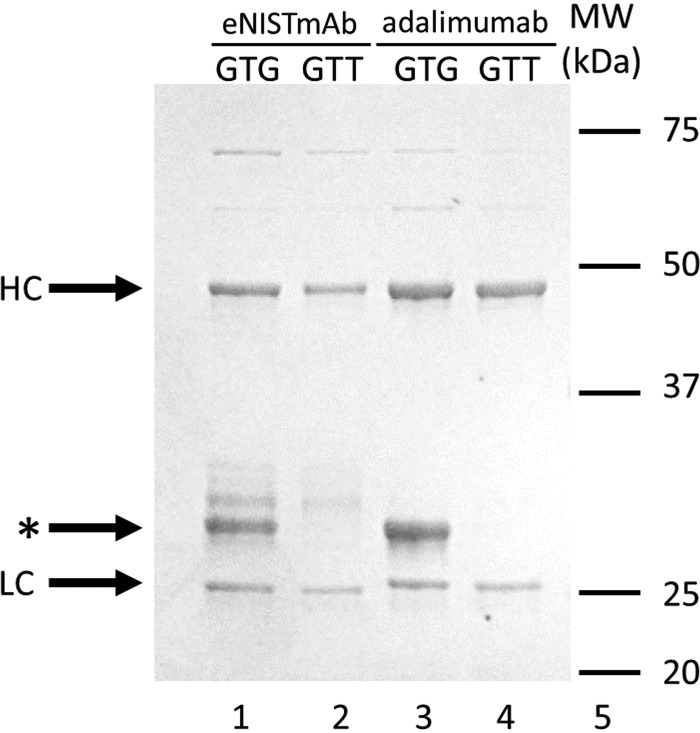
When the NISTmAb was expressed in SHuffle cells (eNISTmAb), a truncated product from the heavy chain was observed (Fig. 1, lane 1, marked by an asterisk) (12). Using N-terminal Edman sequencing it was found that the N terminus of the truncated product starts at residue Val214 of the eNISTmAb heavy chain, where Val is replaced with an initiator Met (Fig. S1A). When the putative internal initiation codon GTG (Val) was mutated to GTT (Val), no truncated product could be observed (Fig. 1, lane 2) (12). Furthermore, expression of adalimumab in SHuffle E. coli yielded a similar truncated product (Fig. 1, lane 3, marked by an asterisk). N-terminal Edman sequencing of this truncated product revealed that the truncation starts at residue Val215 of the adalimumab heavy chain with the N terminus being an initiator Met (Fig. S1B). Additionally, as with the eNISTmAb, when the GTG codon was mutated to GTT no truncated heavy chain was observed (Fig. 1, lane 4).
Figure 1.
SDS-PAGE analysis of mAbs expressed in E. coli. The eNISTmAb (lanes 1 and 2) and adalimumab (lanes 3 and 4) were expressed in E. coli SHuffle cells and purified on a Protein A column. Lanes 1 and 3, GTG as the codon encoding Val; lanes 2 and 4, GTT as the codon encoding Val. The heavy (HC) and light (LC) chains are marked as well as the truncated product (*). The additional bands above the truncated products in lanes 1 and 2 are degradation products.
Aligning the amino acid and DNA sequences surrounding the GTG internal initiation site in the construct encoding adalimumab heavy chain to the corresponding eNISTmAb sequences revealed that the protein sequences encoded by the full-length regions are 98% identical (58 of 59 residues); however, the DNA sequences are less conserved, with only 78% identity (Fig. S2). The low DNA sequence identity between the constructs likely resulted from differences in the codon-optimization algorithms employed by the two gene synthesis companies that synthesized the ORFs by “back-translation” from the desired amino acid sequences.
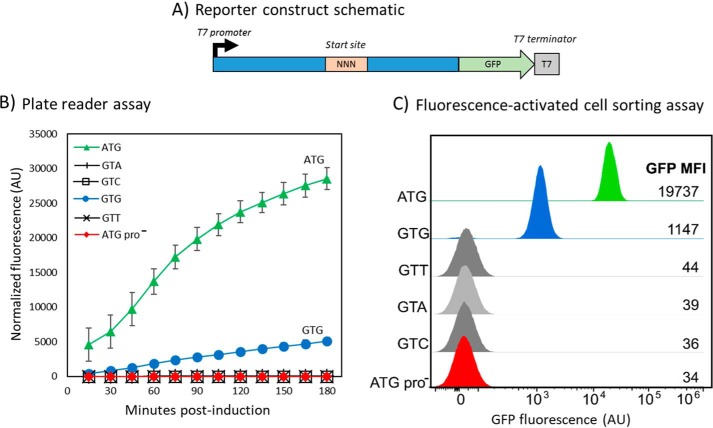
To identify the common mRNA sequence required for the internal initiation, the region upstream (85 nucleotides) and downstream (92 nucleotides) of the GTG codon in eNISTmAb was constructed in-frame with a green fluorescent protein (GFP) reporter under the control of a T7 promoter and cloned into the pET-21a expression vector (Fig. S3). The construct was designed to ensure that only translation initiating from the GTG internal initiation site would result in GFP fluorescence when assayed (Figs. 2 and 3). The reporter construct with GTG as the initiation codon resulted in appreciable fluorescence, whereas substituting GTG for any of the other three codons encoding Val (GTA, GTC, and GTT) abolished fluorescence (Fig. 3A). This observation was expected as the latter three codons are not known to serve as translation start sites. These results also demonstrate that no other in-frame initiation sites within the construct produce a fluorescent product. As an additional positive control, the universal initiation codon ATG was substituted for GTG. This construct resulted in a very strong fluorescence/optical density at 600 nm (OD600) value of ∼6-fold greater than the clone containing GTG.
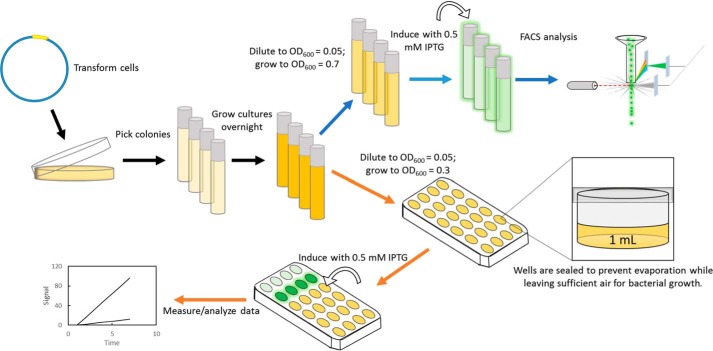
Figure 2.
Schematic of the GFP assays. Cells were prepared identically between the FACS and plate reader assays (black arrows) except where indicated: blue arrows for the FACS assay and orange arrows for the plate reader assay.
Figure 3.
GFP analysis of the internal initiation region. A, a schematic representation of the GFP reporter construct of the eNISTmAb. “NNN” designates the location of the different codons tested. The regions in blue are the flanking regions of the putative internal initiation site, and that in green is the sequence encoding GFP. The T7 promoter and terminator regions are also shown. B, the results of the plate reader assay for the different codons used as initiation sites. A construct in which the promoter was removed (ATG pro−) is also shown. Fluorescence values are normalized to optical density of the cultures and corrected as described under “Experimental procedures”. The results and standard deviation (error bars) from four independent experiments are shown. Note that error bars are within the data markers in some instances, and trend lines are shown only for clarity. AU, arbitrary units. C, FACS analysis of the internal initiation site. GFP intensity histograms for each of the start-codon constructs of the eNISTmAb tested. A construct in which the promoter was removed (ATG pro−) is also shown. MFIs are reported for the GFP-positive populations. The intensity axis is shown in biexponential scaling. AU, arbitrary units.
To test the possibility that a cryptic promoter leads to transcription of a truncated heavy chain mRNA with the GTG codon as the first functional start codon, a construct lacking the T7 promoter and containing the ATG initiation codon was generated, denoted as “ATG pro−” in Fig. 3. No fluorescence was observed with this construct transformed in E. coli BL21(DE3) (Fig. 3A), and similar results were observed with SHuffle cells (data not shown). Taken together with Fig. 1 data, these results strongly suggest that the expression of the truncated heavy chain is generated by an internal initiation site.
An orthogonal analysis of GFP expression from the NNN constructs was conducted via flow cytometry (Fig. 3B). Unlike bulk measurements of steady-state levels of GFP measured in a spectrophotometer, flow cytometry measures relative GFP expression at the single-cell level and reveals the population distribution of GFP expression that, in a minimally heterogeneous culture, should reflect the relative GFP expression measured in bulk. As expected, GFP median fluorescence intensity (MFI) of the ATG population (19,737) was more than an order of magnitude greater than that of the GTG population (1,147), and other NNN constructs showed per-cell GFP MFIs comparable with both the ATG pro− construct and untransformed E. coli BL21(DE3).
Homing in on the sequence required for internal initiation
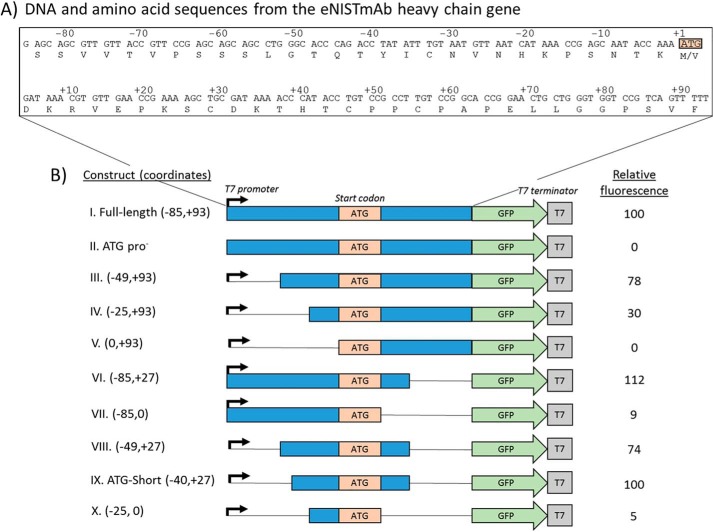
The “full-length” (−85, +93) ATG reporter construct provided a stronger signal than the GTG construct (Fig. 3); therefore, it was used as a template to generate deletion constructs with narrowed portions of the sequence flanking the start codon and to compare relative translation efficiencies (Fig. 4B, construct I). A construct lacking the promoter, ATG pro−, showed no fluorescence and was used as a negative control (Fig. 4B, construct II). The deletion mutant constructs were analyzed in E. coli BL21(DE3) using the plate reader assay, and the results are summarized in Fig. 4. Deleting the entire region upstream of the ATG abolished GFP fluorescence (Fig. 4B, construct V), whereas deleting the entire region downstream of the ATG decreased GFP intensity to roughly 9% of the full-length construct (Fig. 4B, construct VII). This indicated that only the upstream nucleotides are required for translation initiation, whereas the downstream nucleotides contribute to the efficiency of translation initiation. Subsequent deletions to identify a minimal region that retains the full-length construct's GFP expression resulted in a narrowed region of −40 to +27 (with respect to the first position of the start codon, Fig. 4B, construct IX), termed “ATG-Short.”
Figure 4.
Narrowing the regulatory region required for internal initiation. A, DNA sequence of the region flanking the internal initiation site from the gene encoding for the eNISTmAb. The ATG start codon is boxed in orange, where the “A” in the first position is defined as the “+1” coordinate. B, a schematic representation of the constructs made. Fluorescence from the original full-length construct was measured in every experiment, assigned a relative fluorescence value of 100, and used to normalize all fluorescence values onto a common intensity scale.
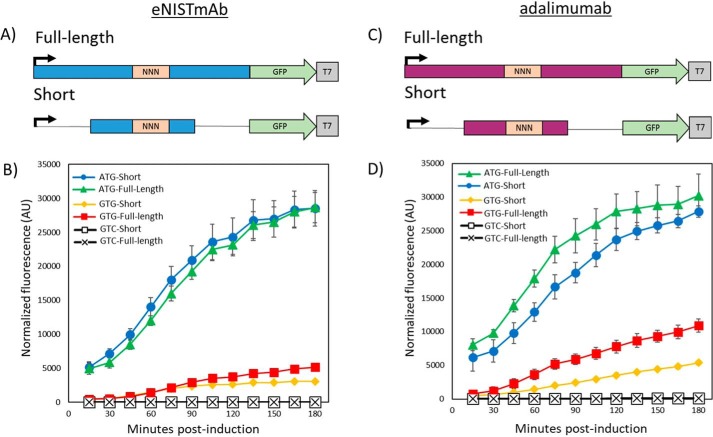
A variant of the ATG-Short construct was generated substituting GTG as the start codon to determine its ability to support translation relative to its GTG full-length parent construct. As shown in Fig. 5, A and B, both the ATG and GTG full-length variants support expression of the GFP and therefore internal initiation. However, both “short” constructs exhibited slightly lower GFP expression, which may be attributed to lessened efficiency of translation compared with the full-length constructs. No fluorescence could be observed when substituting GTC for ATG (Fig. 5, A and B). These results show that the ATG-Short and GTG-Short constructs (−40 to +27) support internal initiation from both ATG and GTG codons as demonstrated for the full-length constructs (Fig. 5). As discussed above, expressing adalimumab in E. coli yields a similar truncated heavy chain product where Val215 is replaced by an initiator Met in the truncated product. Constructs of the corresponding “ATG-full-length” (−85, +93) and ATG-Short (−40, +27) regions from the adalimumab heavy-chain ORF exhibited the same behavior as observed for eNISTmAb; however, the adalimumab constructs showed a larger difference in normalized fluorescence/OD600 between the full-length and short constructs initiating with ATG or GTG (Fig. 5D).
Figure 5.
Analysis of the shortened region flanking the internal initiation site. A, schematic representation of the starting full-length (−85, +93) and short (−40, +27) reporter constructs that retained prototypic activity in the eNISTmAb. NNN designates the start codon. B, plate reader analysis of the various start codons' full-length and short constructs from the eNISTmAb. The results and standard deviation (error bars) from four independent experiments are shown. Fluorescence values are normalized to optical density of the cultures and corrected as described under “Experimental procedures.” AU, arbitrary units. C, schematic representation of the starting full-length (−85, +93) and short (−40, +27) reporter constructs in adalimumab. NNN designates the start codon. D, plate reader analysis of the various start codons' full-length and short constructs from adalimumab. The results and standard deviation (error bars) from four independent experiments are shown. Fluorescence values are normalized to optical density of the cultures and corrected as described under “Experimental procedures.” AU, arbitrary units.
Considering GFP mRNA secondary structure effects on translation efficiency
The deletion analyses identified a short region flanking the internal initiation codon that retained ∼100% activity of the full-length construct. However, it was also found that deleting the entire downstream region did not completely abolish translation but rather reduced it by about 90% when the entire upstream region was included (Fig. 4B, construct VII) and by about 95% when a minimal upstream region was included (Fig. 4B, construct X). This decrease may be attributed to the presence of a hairpin loop secondary structure with a 6-bp stem adjacent to the initiation region formed from the GFP mRNA (Fig. S4, highlighted green sequence). Therefore, to achieve maximum fluorescence signal and report on translation initiation from the eNISTmAb without possible interference from GFP mRNA secondary structure, the ATG-Short construct was used for the remainder of the study (Fig. 4B, construct IX).
Mutating the putative translation initiation motifs in eNISTmAb
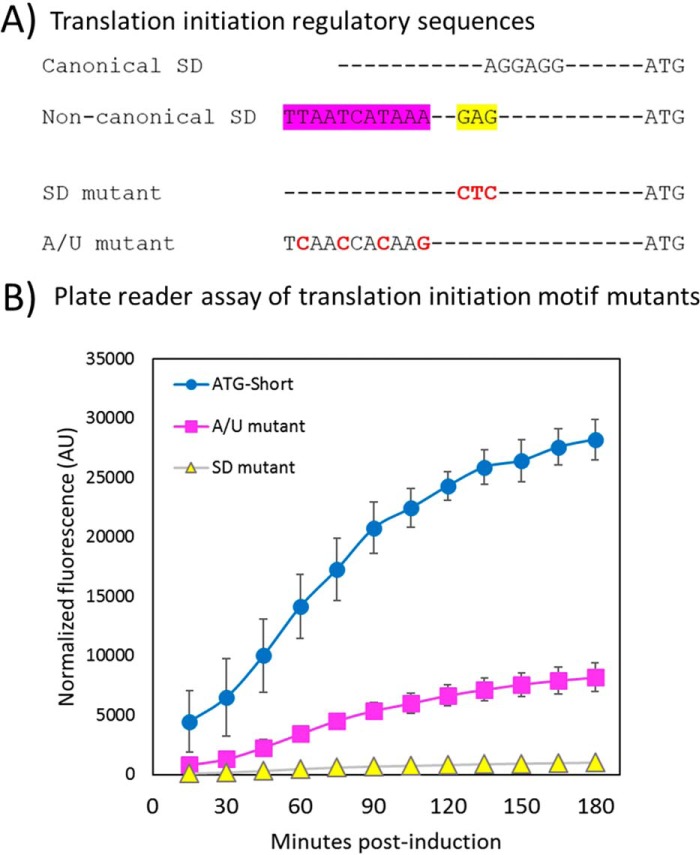
Examination of the region upstream of the internal initiation codon in eNISTmAb identified a sequence, GAG (Fig. 6A, highlighted yellow), located 10 bases upstream of the initiation codon that partially complements the 16S rRNA anti-SD. Further upstream of this putative weak SD, the mRNA contains an A/U-rich region (Fig. 6A, highlighted pink). This A/U-rich region could be involved in binding ribosomal protein S1. The S1 protein is known to contain a RNA-binding domain, have higher affinity for U- and A/U-rich tracts (22), and has been shown to support translation of E. coli transcripts with weak, too strong, or absent SD sequences (23, 24). To determine whether these two motifs (SD and A/U) are required for translation initiation, each was targeted for site-directed mutagenesis using the eNISTmAb ATG-Short construct (Figs. 4 and 5) as a template. The SD mutation changed the putative weak SD sequence, GAG, to its complement, CTC, which greatly diminished GFP expression with respect to the parent ATG-Short construct (Fig. 6B). The A/U mutation changed the A/U-rich tract TTAATCATAAA to TCAACCACAAG and substantially reduced GFP expression (Fig. 6B), although to a lesser extent than did the SD mutation.
Figure 6.
Mutational analysis of the putative translation initiation region. A, the canonical SD sequence AGGAGG is optimally 6–8 bases upstream of the start codon and is shown as the reference SD sequence. The weak SD sequence from the eNISTmAb contains a sequence resembling the canonical SD (highlighted yellow) and an A/U-rich region (shown as A/T highlighted in pink). Translation initiation motif mutations to the weak SD and the A/U-rich region are shown in red. These are respectively labeled as “SD mutant” and “A/U mutant.” B, mutations were made to the weak SD sequence and an A/U-rich sequence using the ATG-Short construct as a template (Fig. 4B, construct IX). Each mutant was assayed as described by the plate reader GFP assay under “Experimental procedures”. The results and standard deviation (error bars) from three independent experiments are shown. Fluorescence values are normalized to optical density of the cultures and corrected as described under “Experimental procedures.” AU, arbitrary units. Note that error bars are within the data markers in some instances.
Targeting the putative S1-binding site with an antisense oligonucleotide
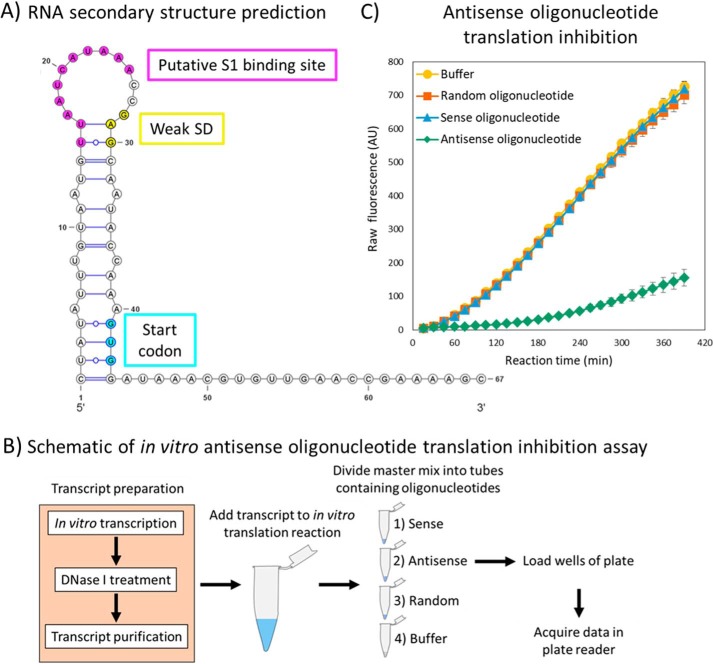
The A/U-rich region identified upstream of the weak SD sequence may participate in recruiting ribosomal protein S1 and was predicted to form a single-stranded RNA loop atop a low-energy helix including the SD and initiation codon (Figs. 7A and S4A). To complement the mutation analysis shown in Fig. 6, the region was targeted for in vitro translation inhibition with an antisense oligonucleotide as described in “Experimental procedures” and schematically shown in Fig. 7B. Two additional RNA oligonucleotides were tested alongside the antisense oligonucleotide to serve as controls, and fluorescence values over time were compared with a reaction containing no RNA oligonucleotide (Fig. 7C). The data suggest that the A/U-rich region in single-stranded form plays a role in translation initiation, as fluorescence is reduced about 20-fold upon complementation with the “antisense” oligo compared with “sense,” “random,” and no-oligo-control reactions. This observation gives credence to the implication that the A/U-rich region improves translation initiation and may need to be single-stranded for the recruitment of the ribosomal S1 protein.
Figure 7.
In vitro transcription/translation studies of the internal initiation region. A, 2D structural prediction of the (−40, +27) transcript (GFP region not shown). A putative ribosomal protein S1-binding site is colored in pink and was targeted with an antisense RNA oligonucleotide. The weak SD sequence is colored in yellow, and the start codon is colored in cyan. B, a schematic representation of the assay. See “Experimental procedures” for details. C, GFP fluorescence data and standard deviation (error bars) from three independent experiments are shown. The sequence of the sense oligonucleotide was 5′-AAUCAUAAACCG-3′, the sequence of the antisense oligonucleotide was 5′-CGGUUUAUGAUU-3′, and the sequence of the random oligonucleotide was 5′-GCAGAUCGUCAU-3′. Note that error bars are within the data markers in some instances. AU, arbitrary units.
Discussion
Monoclonal antibodies are the largest sector of the biopharmaceutical industry and growing in market share. Although most therapeutic antibodies are produced in mammalian cells, recent approaches for the expression of antibodies in E. coli have been reported. These methods were developed to produce proteins for both biophysical studies (12) and the production of therapeutic drugs (9, 10). Improvements to mAb expression systems will be required for the number of mAbs produced in E. coli to increase in the future.
In the present study, the SHuffle E. coli strain and codon-optimized constructs allowed for the heterologous expression of two humanized mAbs: the eNISTmAb, generated against respiratory syncytial virus, and adalimumab (the amino acid sequence of the drug Humira), generated against tumor necrosis factor-α. When these mAbs were expressed in E. coli SHuffle, a truncated variant of the heavy chain was observed in addition to the full-length heavy-chain product. This truncated product was the result of internal translation initiation. These results highlight a current limitation of the codon-optimization algorithms employed by two gene synthesis companies: avoidance of internal translation initiation sites.
Codon optimization is routinely performed on coding DNA sequences for heterologous expression to account for variation in codon usage and tRNA abundances across different organisms (24). Codon optimization can inadvertently generate ribosome-binding sites and translation start sites, resulting in the formation of truncated products. Importantly, this phenomenon was predicted to be more likely when a coding sequence of eukaryotic origin is used heterologously in E. coli (25). Previous studies demonstrated that mutation of start codons and SD sequences within a gene can effectively eliminate these internal initiation sites (25, 26). These studies suggest that the phenomenon is not specific to the genes encoding the heavy chains of mAbs, and it is likely that other observations of truncated products during the expression of heterologous genes in E. coli were incorrectly attributed to in vivo degradation or degradation during purification (for example, see Ref. 27).
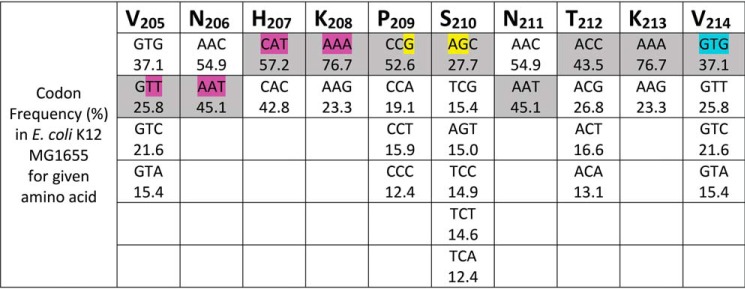
The data presented here illustrate that a GTG codon encoding Val within heavy-chain mAb genes serves as an internal translation initiation site, leading to truncated products. It is likely that this phenomenon is not unique to mAb heavy chains but may also occur in other proteins expressed in E. coli. It is clear that the presence of GTG is not sufficient for translation initiation, and moreover the RNA sequences and/or secondary structures play a role. The results of this study suggest that when mAb genes are designed for protein expression in E. coli, a GTG codon for the Val analogous to Val214 in the eNISTmAb (Val215 in adalimumab) should be avoided. Although GTG represents ∼37% of the Val codons in the E. coli ORFs, the other Val codons (GTA, GTC, and GTT) appear in significant abundance (see Fig. 8 for Val codon frequencies) and do not serve as initiation sites in E. coli (Fig. 3). It is also likely that choosing high-abundance E. coli codons to code for a similar protein sequence (i.e. PSXXX(V/M)) will result in the introduction of internal initiation sites (Fig. 8). The Pro-Ser motif may generate a weak SD sequence (CCG-AGC), and the codon for Val (GTG) may introduce a start codon. If a Met residue is required (encoded only by ATG), it is advised to recode the amino acids upstream as demonstrated in Fig. 6 to reduce the likelihood of internal initiation and truncated product formation.
Figure 8.
Summary of codon usage in the internal initiation region of the eNISTmAb. The amino acid residues (205–214) from the eNISTmAb internal initiation region are shown. The possible codons for each amino acid are provided in descending order according to their relative occurrence in E. coli K12 MG1655 RefSeq coding DNA sequences (NCBI:txid511145 analyzed using HIVE-CUTs (30)). The codons used for eNISTmAb expression are shaded; the translation initiation motifs resulting from these codons are highlighted in pink and yellow for the putative S1-binding site and weak SD sequence, respectively. The internal initiation codon (GTG) is shown in cyan.
Experimental procedures
Except where otherwise noted, chemicals were obtained from MilliporeSigma, and molecular biology and protein expression reagents were obtained from New England Biolabs (Ipswich, MA). Expression vectors pET-21a and pETDuet-1 are products of MilliporeSigma. DNA and RNA oligonucleotides were synthesized by Integrated DNA Technologies (Skokie, IL). Synthesis of codon-optimized ORFs and subcloning were performed by GeneArt (Thermo Fisher Scientific, Waltham, MA) except for the adalimumab heavy- and light-chain ORFs, which were synthesized and subcloned by Integrated DNA Technologies. Sanger sequencing was performed by GENEWIZ (South Plainfield, NJ).
mAb production in E. coli
E. coli SHuffle T7 express cells were transformed with a plasmid encoding both the light and heavy chains of eNISTmAb subcloned into pET-21a vector or adalimumab subcloned into pETDuet-1 vector. Single colonies were grown overnight at 30 °C in 10 ml of Luria Broth (LB) medium supplemented with 100 μg/ml ampicillin. The 10-ml cultures were used to inoculate 0.5-liter cultures, which were grown at 30 °C until reaching an OD600 of 0.4–0.5, at which point the incubation temperature was dropped to 16 °C. After 1 h of temperature equilibration, the cultures reached an OD600 of 0.6–0.7 and were induced with 50 μmol/liter isopropyl β-d-thiogalactopyranoside (IPTG). Induction was carried out at 16 °C for 24 h before cells were harvested by centrifugation at 3,500 × g for 30 min. A final wet cell weight of ∼1 g was obtained from each 0.5-liter culture. Cells were resuspended in 20 ml of phosphate-buffered saline (PBS; 137 mmol/liter NaCl, 2.68 mmol/liter KCl, 10.14 mmol/liter Na2PO4, 1.76 mmol/liter KH2PO4, pH 7.4) containing 5 mmol/liter EDTA and a tablet of protease inhibitor mixture (1× final concentration). Cells were lysed by sonication while keeping the temperature below 12 °C.
Following sonication, cellular debris was removed by centrifugation at 70,000 × g for 30 min. Approximately 250 μl of rProtein A resin (GE Healthcare) was equilibrated with PBS at 4 °C. The supernatants from the cell extracts were added to the columns and passed through the resins via gravity flow. Columns were washed three times each with 10 ml of PBS. The mAbs were eluted with 0.5 ml of 0.1 mol/liter sodium citrate, pH 3.0, and collected into tubes containing 0.1 ml of 1 mol/liter Tris-HCl, pH 9.0, to neutralize the pH of the elution buffer. Proteins were analyzed by electrophoresis through 12% SDS-polyacrylamide gels stained with Coomassie Brilliant Blue R-250.
Preparation of samples for N-terminal sequencing by Edman degradation
SDS-PAGE bands corresponding to the truncated heavy chains from eNISTmAb and adalimumab were transferred to a polyvinylidene difluoride membrane. After transfer, the membrane was stained for 30 s in 40% methanol, 1% acetic acid, and 0.1% Coomassie Brilliant Blue R-250 followed by destaining in 50% methanol until bands were visible. The membrane was washed with water, and the truncated heavy-chain bands were excised. The samples were sent to Alphalyse, Inc. (Palo Alto, CA) for N-terminal sequencing by Edman degradation.
GFP reporter plasmid construction
GFP reporter constructs were generated by cloning the region of DNA encompassing the internal initiation site (Fig. S3, blue) in-frame and upstream of a gene encoding monomeric superfolder GFP (Fig. S3, green). No other translation initiation sites were present in the cloned fragment. The constructs also included a T7 promoter sequence (Fig. S3, yellow) and a transcription termination signal (Fig. S3, gray). Five initial constructs were made, each with identical sequences differing only in the codon at the internal initiation site: ATG, GTA, GTC, GTG, or GTT. All constructs were synthesized and subcloned using the BglII and XhoI restriction endonuclease sites (Fig. S3, red) of pET-21a.
Site-directed mutagenesis
All deletions and mutations to the GFP reporter constructs were performed using the Q5 Site-Directed Mutagenesis kit with custom oligonucleotide primers (sequences available upon request) following the manufacturer's protocol. Deletions and mutations were confirmed by Sanger sequencing.
Quantification of GFP intensity using plate reader assay
Plate reader assays were performed as summarized in Fig. 2. Biological triplicates from separate single colonies of each GFP reporter construct in E. coli BL21(DE3) cells were grown overnight at 37 °C in 5 ml LB medium supplemented with 100 μg/ml ampicillin. Similarly, untransformed E. coli BL21(DE3) cells were grown in 5 ml LB medium for data normalization. The overnight cultures were diluted 20-fold with LB medium containing 100 μg/ml ampicillin, and 1 ml of each diluted culture was grown at 37 °C in the wells of a 24-well plate covered with a smooth, optically clear seal. Incubation, shaking, and monitoring of OD600 were performed using a multiwell plate reader (Synergy Neo2, BioTek, Winooski, VT). When cultures reached an OD600 of 0.3–0.4, the plate and seal were removed, and IPTG was added directly to the wells at a final concentration of 0.5 mmol/liter. Plates were resealed and returned to the instrument for data acquisition.
Absorbances at 600, 900, and 977 nm were measured every 15 min for a total of 180 min. GFP fluorescence intensity was also measured every 15 min for a total of 180 min using a filter set with an excitation wavelength of 485 ± 10 nm, an emission wavelength of 516 ± 10 nm, and a constant detector gain. Absorbances at 900 and 977 nm were measured at each time point to determine the culture path length for each well, whereas the absorbance at 600 nm was measured at each time point to normalize fluorescence intensity to the OD600 of the cultures as described previously (28) (see supporting experimental procedures for equations). To compare relative fluorescence values across GFP constructs (Fig. 4B), fluorescence from the original full-length construct was measured in every experiment, assigned a relative fluorescence value of 100, and used to normalize all fluorescence values onto a common intensity scale.
Quantification of GFP intensity via flow cytometry
Flow cytometry assays were performed as follows (Fig. 2). Preparation of samples was carried out as described for the plate reader assay protocol with the following modifications. When the cultures reached an OD600 of 0.6–0.8, GFP expression was induced with an IPTG concentration of 0.5 mmol/liter, and the cells were allowed to incubate with shaking at 37 °C for an additional 1 h. After this induction period, cultures were diluted 1000-fold with PBS to a final volume of 1 ml. The samples were thoroughly vortexed and analyzed by flow cytometry on an SH800S (Sony Biotechnology, San Jose, CA) fluorescence-activated cell sorter equipped with 488- and 638-nm excitation lasers. GFP fluorescence intensity (488-nm excitation) was measured using an emission filter with a wavelength of 525 ± 25 nm (on fluorescence 1 (FL1) channel). A forward scattering intensity threshold was set by separately measuring the intensity of 0.4–0.6-μm fluorescently dyed polystyrene beads (Spherotec, Lake Forest, IL), and 100,000 events above this threshold intensity were recorded for each sample.
Data analysis and figure preparation were performed using FlowJo software version 10.5.3 (FlowJo LLC, Ashland, OR). Single E. coli cells were distinguished by gating on plots of forward-scatter area versus side-scatter area and forward-scatter height versus forward-scatter area. GFP MFIs were determined from histograms of the single-cell population in the fluorescence 1 channel using GFP-negative (untransformed) E. coli BL21(DE3) cells to set GFP-negative and GFP-positive gates. The full gating strategy is provided in Fig. S5.
RNA structure prediction
2D RNA structure prediction was performed using the (−40, +27) and (−40, 0) regions of the eNISTmAb mRNA. The (−40, 0) prediction included 27 nucleotides from the GFP gene. Sequences were entered into the RNAfold Web Server (http://rna.tbi.univie.ac.at//cgi-bin/RNAWebSuite/RNAfold.cgi)3 as single-letter sequences. Default fold options were used, including the minimum free-energy structure and partition-function algorithms (29). Structures containing single bp stems were avoided. Temperature was set to 310.15 K. Secondary structure figures were prepared using the VARNA visualization tool (http://varna.lri.fr/index.php?lang=en&page=home&css=varna).3
RNA oligonucleotides
Three custom 12-mer RNA oligonucleotides were synthesized. The sequence of the sense oligonucleotide was 5′-AAUCAUAAACCG-3′, the sequence of the antisense oligonucleotide was 5′-CGGUUUAUGAUU-3′, and the sequence of the random oligonucleotide was 5′-GCAGAUCGUCAU-3′. The oligonucleotides were resuspended at a final concentration of 100 μmol/liter in 10 mmol/liter Tris-HCl (pH 8), then aliquoted, and stored at −20 °C until use. Sequence alignment confirmed that the antisense RNA only complements the sequence (−27, −17) relative to the internal initiation codon.
In vitro transcript preparation
The plasmid encoding the ATG-Short GFP construct from the eNISTmAb (Fig. 5) was used as a template for in vitro transcription. Transcription was performed using the HiScribe T7 Quick High Yield RNA Synthesis kit following the manufacturer's protocol. The reaction was carried out at 37 °C for 2 h. Following RNA synthesis, the reaction was treated with RNase-free DNase I to remove the plasmid template following the manufacturer's protocol prior to RNA purification. Transcripts were purified using the MEGAclear Transcription Clean-Up kit (Thermo Fisher Scientific) following the manufacturer's protocol. The concentrations of the purified transcripts were determined using a NanoDrop 2000c spectrophotometer (Thermo Fisher Scientific). Transcripts were used immediately or stored at −20 °C until use.
Antisense oligonucleotide translation inhibition
In vitro translation of the eNISTmAb (ATG-Short) transcripts was performed using a customized version of the PURExpress In Vitro Protein Synthesis kit lacking T7 RNA polymerase and is schematically shown in Fig. 7B. The final volume of each reaction was 15 μl and included 2.6 μmol/liter transcript, 26 μmol/liter RNA oligo, 20 units of murine RNase inhibitor, and other components of the PURExpress according to the manufacturer's protocol. A master mix was assembled on ice with all reaction components except RNA oligonucleotides. The PURExpress master mix was thoroughly mixed before dividing it between four tubes containing either the sense oligo, antisense oligo, random oligo, or only buffer. These secondary master mixes were kept on ice and thoroughly mixed before loading single 15-μl reactions into the wells of a 384-well plate. The plate was covered with a smooth, optically clear seal and placed into the plate reader for data acquisition. The plate was incubated at 25 °C, and GFP fluorescence intensity was measured every 15 min as described for the plate reader assay.
Author contributions
E. M. L., W. B. O., N. K., C. M., and C. B. data curation; E. M. L., W. B. O., N. K., C. M., M. B., C. B., R. G. B., and Z. K. formal analysis; E. M. L., N. K., C. M., and Z. K. investigation; E. M. L. writing-original draft; W. B. O. and Z. K. conceptualization; W. B. O., M. B., R. G. B., and Z. K. methodology; W. B. O., C. B., R. G. B., and Z. K. writing-review and editing; Z. K. funding acquisition; Z. K. supervision.
Supplementary Material
Acknowledgments
We thank Corinna Tuckey and Ying Zhou for preparation of the customized ΔT7 PURExpress kits. We thank Dr. Lori Kelman for comments on the manuscript.
The work was supported by DOC National Institutes of Standards and Technology (NIST) (to Z. K.). The authors declare that they have no conflicts of interest with the contents of this article. Certain commercial equipment, instruments, software, materials and suppliers are identified in this paper to foster understanding and scientific reproducibility. Such identification does not imply recommendation or endorsement by the National Institute of Standards and Technology, nor does it imply that the products identified are necessarily the best available for the purpose.
This article contains supporting experimental procedures and Figs. S1–S5.
Please note that the JBC is not responsible for the long-term archiving and maintenance of this site or any other third party hosted site.
- NIST
- National Institute of Standards and Technology
- IPTG
- isopropyl β-d-thiogalactopyranoside
- MFI
- median fluorescence intensity
- SD
- Shine–Dalgarno.
References
- 1. Mazor Y., Van Blarcom T., Iverson B. L., and Georgiou G. (2008) E-clonal antibodies: selection of full-length IgG antibodies using bacterial periplasmic display. Nat. Protoc. 3, 1766–1777 10.1038/nprot.2008.176 [DOI] [PubMed] [Google Scholar]
- 2. Mazor Y., Van Blarcom T., Mabry R., Iverson B. L., and Georgiou G. (2007) Isolation of engineered, full-length antibodies from libraries expressed in Escherichia coli. Nat. Biotechnol. 25, 563–565 10.1038/nbt1296 [DOI] [PubMed] [Google Scholar]
- 3. Makino T., Skretas G., Kang T.-H., and Georgiou G. (2011) Comprehensive engineering of Escherichia coli for enhanced expression of IgG antibodies. Metab. Eng. 13, 241–251 10.1016/j.ymben.2010.11.002 [DOI] [PMC free article] [PubMed] [Google Scholar]
- 4. Robinson M.-P., Ke N., Lobstein J., Peterson C., Szkodny A., Mansell T. J., Tuckey C., Riggs P. D., Colussi P. A., Noren C. J., Taron C. H., DeLisa M. P., and Berkmen M. (2015) Efficient expression of full-length antibodies in the cytoplasm of engineered bacteria. Nat. Commun. 6, 8072–8072 10.1038/ncomms9072 [DOI] [PMC free article] [PubMed] [Google Scholar]
- 5. Rouet R., Lowe D., Dudgeon K., Roome B., Schofield P., Langley D., Andrews J., Whitfeld P., Jermutus L., and Christ D. (2012) Expression of high-affinity human antibody fragments in bacteria. Nat. Protoc. 7, 364–373 10.1038/nprot.2011.448 [DOI] [PubMed] [Google Scholar]
- 6. Simmons L. C., Reilly D., Klimowski L., Raju T. S., Meng G., Sims P., Hong K., Shields R. L., Damico L. A., Rancatore P., and Yansura D. G. (2002) Expression of full-length immunoglobulins in Escherichia coli: rapid and efficient production of aglycosylated antibodies. J. Immunol. Methods 263, 133–147 10.1016/S0022-1759(02)00036-4 [DOI] [PubMed] [Google Scholar]
- 7. Zhou Y., Liu P., Gan Y., Sandoval W., Katakam A. K., Reichelt M., Rangell L., and Reilly D. (2016) Enhancing full-length antibody production by signal peptide engineering. Microb. Cell Fact. 15, 47 10.1186/s12934-016-0445-3 [DOI] [PMC free article] [PubMed] [Google Scholar]
- 8. Chan C. E., Lim A. P., Chan A. H., MacAry P. A., and Hanson B. J. (2010) Optimized expression of full-length IgG1 antibody in a common E. coli strain. PLoS One 5, e10261 10.1371/journal.pone.0010261 [DOI] [PMC free article] [PubMed] [Google Scholar]
- 9. Ferrara N., Damico L., Shams N., Lowman H., and Kim R. (2006) Development of ranibizumab, an anti-vascular endothelial growth factor antigen binding fragment, as therapy for neovascular age-related macular degeneration. Retina 26, 859–870 10.1097/01.iae.0000242842.14624.e7 [DOI] [PubMed] [Google Scholar]
- 10. Goel N., and Stephens S. (2010) Certolizumab pegol. MAbs 2, 137–147 10.4161/mabs.2.2.11271 [DOI] [PMC free article] [PubMed] [Google Scholar]
- 11. Schiel J. E., Turner A., Mouchahoir T., Yandrofski K., Telikepalli S., King J., DeRose P., Ripple D., and Phinney K. (2018) The NISTmAb Reference Material 8671 value assignment, homogeneity, and stability. Anal. Bioanal. Chem. 410, 2127–2139 10.1007/s00216-017-0800-1 [DOI] [PMC free article] [PubMed] [Google Scholar]
- 12. Reddy P. T., Brinson R. G., Hoopes J. T., McClung C., Ke N., Kashi L., Berkmen M., and Kelman Z. (2018) Platform development for expression and purification of stable isotope labeled monoclonal antibodies in Escherichia coli. mAbs 10, 992–1002 10.1080/19420862.2018.1496879 [DOI] [PMC free article] [PubMed] [Google Scholar]
- 13. Lobstein J., Emrich C. A., Jeans C., Faulkner M., Riggs P., and Berkmen M. (2012) SHuffle, a novel Escherichia coli protein expression strain capable of correctly folding disulfide bonded proteins in its cytoplasm. Microb. Cell Fact. 11, 56 10.1186/1475-2859-11-56 [DOI] [PMC free article] [PubMed] [Google Scholar]
- 14. Blattner F. R., Plunkett G. 3rd, Bloch C. A., Perna N. T., Burland V., Riley M., Collado-Vides J., Glasner J. D., Rode C. K., Mayhew G. F., Gregor J., Davis N. W., Kirkpatrick H. A., Goeden M. A., Rose D. J., et al. (1997) The complete genome sequence of Escherichia coli K-12. Science 277, 1453–1462 10.1126/science.277.5331.1453 [DOI] [PubMed] [Google Scholar]
- 15. Laursen B. S., Sørensen H. P., Mortensen K. K., and Sperling-Petersen H. U. (2005) Initiation of protein synthesis in bacteria. Microbiol. Mol. Biol. Rev. 69, 101–123 10.1128/MMBR.69.1.101-123.2005 [DOI] [PMC free article] [PubMed] [Google Scholar]
- 16. Chen H., Bjerknes M., Kumar R., and Jay E. (1994) Determination of the optimal aligned spacing between the Shine-Dalgarno sequence and the translation initiation codon of Escherichia coli mRNAs. Nucleic Acids Res. 22, 4953–4957 10.1093/nar/22.23.4953 [DOI] [PMC free article] [PubMed] [Google Scholar]
- 17. Shine J., and Dalgarno L. (1974) The 3′-terminal sequence of Escherichia coli 16S ribosomal RNA: complementarity to nonsense triplets and ribosome binding sites. Proc. Natl. Acad. Sci. U.S.A. 71, 1342–1346 10.1073/pnas.71.4.1342 [DOI] [PMC free article] [PubMed] [Google Scholar]
- 18. Babitzke P., and O'Connor M. (2017) Noncanonical translation initiation comes of age. J. Bacteriol. 199, e00295–17 10.1128/JB.00295-17 [DOI] [PMC free article] [PubMed] [Google Scholar]
- 19. Skorski P., Leroy P., Fayet O., Dreyfus M., and Hermann-Le Denmat S. (2006) The highly efficient translation initiation region from the Escherichia coli rpsA gene lacks a Shine-Dalgarno element. J. Bacteriol. 188, 6277–6285 10.1128/JB.00591-06 [DOI] [PMC free article] [PubMed] [Google Scholar]
- 20. Beck H. J., Fleming I. M., and Janssen G. R. (2016) 5′-Terminal AUGs in Escherichia coli mRNAs with Shine-Dalgarno sequences: identification and analysis of their roles in non-canonical translation initiation. PLoS One 11, e0160144 10.1371/journal.pone.0160144 [DOI] [PMC free article] [PubMed] [Google Scholar]
- 21. Cicek M., Mutlu O., Erdemir A., Ozkan E., Saricay Y., and Turgut-Balik D. (2013) Single mutation in Shine-Dalgarno-like sequence present in the amino terminal of lactate dehydrogenase of Plasmodium effects the production of an eukaryotic protein expressed in a prokaryotic system. Mol. Biotechnol. 54, 602–608 10.1007/s12033-012-9602-z [DOI] [PubMed] [Google Scholar]
- 22. Hajnsdorf E., and Boni I. V. (2012) Multiple activities of RNA-binding proteins S1 and Hfq. Biochimie 94, 1544–1553 10.1016/j.biochi.2012.02.010 [DOI] [PubMed] [Google Scholar]
- 23. Sørensen M. A., Fricke J., and Pedersen S. (1998) Ribosomal protein S1 is required for translation of most, if not all, natural mRNAs in Escherichia coli in vivo. J. Mol. Biol. 280, 561–569 10.1006/jmbi.1998.1909 [DOI] [PubMed] [Google Scholar]
- 24. Komarova A. V., Tchufistova L. S., Supina E. V., and Boni I. V. (2002) Protein S1 counteracts the inhibitory effect of the extended Shine-Dalgarno sequence on translation. RNA 8, 1137–1147 10.1017/S1355838202029990 [DOI] [PMC free article] [PubMed] [Google Scholar]
- 25. Whitaker W. R., Lee H., Arkin A. P., and Dueber J. E. (2015) Avoidance of truncated proteins from unintended ribosome binding sites within heterologous protein coding sequences. ACS Synth. Biol. 4, 249–257 10.1021/sb500003x [DOI] [PubMed] [Google Scholar]
- 26. Jennings M. J., Barrios A. F., and Tan S. (2016) Elimination of truncated recombinant protein expressed in Escherichia coli by removing cryptic translation initiation site. Protein Expr. Purif. 121, 17–21 10.1016/j.pep.2015.12.001 [DOI] [PMC free article] [PubMed] [Google Scholar]
- 27. Kelman Z., and Hurwitz J. (2000) A unique organization of the protein subunits of the DNA polymerase clamp loader in the archaeon Methanobacterium thermoautotrophicum ΔH. J. Biol. Chem. 275, 7327–7336 10.1074/jbc.275.10.7327 [DOI] [PubMed] [Google Scholar]
- 28. Lampinen J., Raitio M., Perälä A., Oranen H., and Harinen R. R. (2012) Microplate Based Pathlength Correction Method for Photometric DNA Quantification Assay, Thermo Fisher Application Note, Thermo Fisher Scientific, Vantaa, Finland [Google Scholar]
- 29. Lorenz R., Bernhart S. H., Höner Zu Siederdissen C., Tafer H., Flamm C., Stadler P. F., and Hofacker I. L. (2011) ViennaRNA Package 2.0. Algorithms Mol. Biol. 6, 26 10.1186/1748-7188-6-26 [DOI] [PMC free article] [PubMed] [Google Scholar]
- 30. Athey J., Alexaki A., Osipova E., Rostovtsev A., Santana-Quintero L. V., Katneni U., Simonyan V., and Kimchi-Sarfaty C. (2017) A new and updated resource for codon usage tables. BMC Bioinformatics 18, 391 10.1186/s12859-017-1793-7 [DOI] [PMC free article] [PubMed] [Google Scholar]
Associated Data
This section collects any data citations, data availability statements, or supplementary materials included in this article.


