

Abstract
In Alzheimer's disease, BACE1 protease initiates the amyloidogenic processing of amyloid precursor protein (APP) that eventually results in synthesis of β‐amyloid (Aβ) peptide. Aβ deposition in turn causes accumulation of BACE1 in plaque‐associated dystrophic neurites, thereby potentiating progressive Aβ deposition once initiated. Since systemic pharmacological BACE inhibition causes adverse effects in humans, it is important to identify strategies that specifically normalize overt BACE1 activity around plaques. The microtubule‐associated protein tau regulates axonal transport of proteins, and tau deletion rescues Aβ‐induced transport deficits in vitro. In the current study, long‐term in vivo two‐photon microscopy and immunohistochemistry were performed in tau‐deficient APPPS1 mice. Tau deletion reduced plaque‐associated axonal pathology and BACE1 accumulation without affecting physiological BACE1 expression distant from plaques. Thereby, tau deletion effectively decelerated formation of new plaques and reduced plaque compactness. The data revealed that tau reinforces Aβ deposition, presumably by contributing to accumulation of BACE1 in plaque‐associated dystrophies. Targeting tau‐dependent mechanisms could become a suitable strategy to specifically reduce overt BACE1 activity around plaques, thereby avoiding adverse effects of systemic BACE inhibition.
Keywords: axonal dystrophies, BACE1, tau deletion, two‐photon in vivo microscopy, β‐amyloid plaque
Subject Categories: Molecular Biology of Disease, Neuroscience
Long‐term in vivo imaging shows that depletion of the microtubule‐associated protein tau blocks progression, but not initiation of Aβ deposition in APPPS1 mice, by reducing local enrichment of the Aβ‐generating protease BACE1.
Introduction
Alzheimer's disease (AD) is characterized by the presence of intracellular neurofibrillary tangles composed of hyperphosphorylated tau and extracellular cerebral amyloid plaques composed of β‐amyloid (Aβ) peptide (Terry, 1994; Mandelkow & Mandelkow, 1998; Trojanowski & Lee, 2000). Aβ is produced by sequential proteolytic cleavage of the transmembrane amyloid precursor protein (APP) by beta‐site amyloid precursor protein cleaving enzyme 1 (BACE1) (Hussain et al, 1999; Sinha et al, 1999; Vassar et al, 1999; Yan et al, 1999) and γ‐secretase complex (Shoji et al, 1992; De Strooper, 2003; Wolfe & Kopan, 2004). In the AD brain, BACE1 accumulates in dystrophic axons around plaques (Zhao et al, 2007; Zhang et al, 2009; Deng et al, 2013; Kandalepas et al, 2013), which might be the reason for the twofold increased BACE1 levels in brains of AD mice and AD patients compared to healthy individuals (Fukumoto et al, 2002, 2004; Holsinger et al, 2002; Tyler et al, 2002; Yang et al, 2003; Li et al, 2004). This overt accumulation of BACE1 might pose a major obstacle for pharmacological intervention. Systemic BACE inhibition causes dose‐dependent adverse effects in mice and humans (Filser et al, 2015; Egan et al, 2018). Thus, an adequate BACE inhibitor dosage that sufficiently suppresses Aβ production at plaques might already cause excessive inhibition of physiological BACE1 and BACE2 function elsewhere in the body. New BACE inhibitors are becoming more selective for BACE1 over BACE2 (Neumann et al, 2018), which will likely reduce BACE2‐related adverse effects. However, numerous substrates of BACE1 have been identified, including 33 neuronal proteins (Kuhn et al, 2012). Thus, it is highly relevant to understand the underlying cascade that leads to overt BACE1 accumulation around plaques and to identify strategies that particularly reduce excessive BACE1 accumulation rather than reducing BACE1 activity systemically. The degradation of BACE1 occurs via the lysosomal pathways and therefore depends on retrograde axonal transport to the cell body (Tesco et al, 2007; Kang et al, 2010). Plaques cause microtubule disruption and mislocalization of microtubule motors, kinesin and dynein (Sadleir et al, 2016). Thereby, transport of vesicles is thought to be disrupted, leading to accumulation of vesicles and local swelling of axons. The microtubule‐associated protein tau (Goedert et al, 1988) mediates Aβ‐induced microtubule disassembly (King et al, 2006) and Aβ‐induced anterograde axonal trafficking deficits in vitro (Vossel et al, 2010, 2015). We therefore investigated how physiological tau expression contributes to BACE1 accumulation in plaque‐associated dystrophies.
Results
Tau deletion attenuates progression but not initiation of Aβ deposition
We investigated the impact of tau deletion on the kinetics of Aβ deposition in APPPS1 mice (Radde et al, 2006) crossed with tau‐deficient (Tau−/−) mice (Dawson et al, 2001) and VGLUT1Venus mice (Herzog et al, 2011). Chronic in vivo two‐photon imaging of Methoxy‐X04‐stained Aβ plaques was performed weekly in the somatosensory cortex from 3 to 6 months of age (Fig 1A). The density of individual plaques was similar between cohorts at 3 months, but was 24% lower in 6‐month‐old Tau−/−.APPPS1 compared to APPPS1 mice (Fig 1B). Congruently, the plaque formation rate was similar between cohorts in 3‐month‐old Tau−/−.APPPS1 mice. However, at 4 months of age, the rate of new plaque formation declined in Tau−/−.APPPS1 mice, resulting in an eightfold lower plaque formation rate between 5 and 6 months of age (Fig 1C). Plaques tended to form at a higher rate in female compared to male mice, and tau deletion had a lowering impact in both genders (Appendix Fig S1A). Increased Aβ deposition is likely caused by the presence of an estrogen response element in the Thy‐1 promoter driving expression of APP and PS1 in these transgenic mice (Sadleir et al, 2015). Since the number of females and males was counterbalanced between treatment cohorts, mice of both genders were pooled for subsequent experiments. In contrast to clearly alleviated plaque formation in Tau−/−.APPPS1 mice, the growth rates of plaques were similar between cohorts, with a slight but non‐significant reduction in Tau−/−.APPPS1 mice (Fig 1D). Unaltered plaque growth in combination with reduced plaque formation resulted in a similar density of large plaques, but particularly reduced density of small plaques (< 8 μm radius) in 6‐month‐old Tau−/−.APPPS1 mice (Fig 1E). The total brain volume covered by plaques increased over the imaging period at a rate of 0.46% ± 0.06% brain volume fraction covered by plaque per week in APPPS1 mice (linear regression, F‐test, P < 0.001). In Tau−/−.APPPS1 mice, the plaque burden was similar to APPPS1 mice initially, but tended to progress at an approximately 30% lower rate (Fig 1F). However, interaction between age and genotype narrowly failed to demonstrate statistical significance (P = 0.08). The low impact of tau deletion on the total plaque volume coverage resulted from the mild contribution of small newly formed plaques to the integrated volume of all plaques. Overall, our in vivo data indicated that tau deletion started to alleviate plaque formation after considerable Aβ deposition had already occurred, but did not reduce Aβ deposition in young 3‐month‐old APPPS1 mice. Therefore, we further investigated how tau deletion affected Aβ production before pronounced Aβ deposition in 2‐month‐old mice. At this age, cortical APP levels (Fig 1G, Appendix Fig S1B) and soluble Aβ40 as well as Aβ42 levels (Fig 1H and I) were similar between the cohorts. Furthermore, we did not observe differences in the Aβ40/42 ratio at that age (Fig 1J, Appendix Fig S1C).
Figure 1. Tau deletion decelerates Aβ deposition.

-
ATime series of representative 3D‐rendered plaques. Scale bar represents 30 μm.
-
BDensity of individual plaques per unit volume. Data presented as mean ± SEM; mixed‐design ANOVA interaction genotype × age F 1.3,17.4 = 5.25, P = 0.026, Greenhouse–Geisser correction.
-
CRate of newly formed plaques. Data presented as mean ± SEM; mixed‐design ANOVA interaction genotype × age F 1.8,23.4 = 8.12, P = 0.003, square root transformation was applied to reduce heteroscedasticity, Greenhouse–Geisser correction.
-
DKinetics of plaque growth rates. Data presented as mean ± SEM; mixed‐design ANOVA genotype F 1,13 = 2.06, P = 0.175.
-
EFrequency distribution of plaque radii at 6 months of age. Data presented as mean ± SEM; mixed‐design ANOVA interaction genotype × plaque size F 6,78 = 6.43, P < 0.001, square root transformation.
-
FTotal brain volume fraction occupied by plaques. Data presented as mean ± SEM; mixed‐design ANOVA interaction genotype × age F 2.5,32.5 = 2.56, P = 0.081, Greenhouse–Geisser correction.
-
GCortex samples on Western blots stained with APPY188‐specific antibody in 2‐month‐old mice. Hybridization of β‐actin was used as a control for equal loading. The graph indicates quantified APP levels presented as mean ± SEM; unpaired t‐test; n APPPS1 = 7, n Tau−/−.APPPS1 = 5 mice.
-
H–JDetermination of soluble Aβ levels via ELISA in the cortex of 2‐month‐old mice. (H) Aβ40 levels; unpaired t‐test. (I) Aβ42 levels; Mann–Whitney test. (J) Aβ40/Aβ42 ratio; Mann–Whitney test. Data presented as mean ± SEM; n APPPS1 = 10, n Tau−/−.APPPS1 = 8 mice.
Tau deletion suppresses satellite plaque formation
We further addressed how pre‐existing plaques might affect formation of new plaques in APPPS1 mice. At each imaging time point, the distance between newly formed plaques and the closest border of pre‐existing plaques was calculated in 3D (Fig 2A and B). In APPPS1 mice, plaques most frequently formed within 20 μm distance from the border of pre‐existing plaques (Fig 2C). In Tau−/−.APPPS1 mice, the plaque formation rate was lower everywhere, but the strongest reduction was detected within 20 μm distance of pre‐existing plaques. Tau deletion similarly tended to reduce plaque formation with regard to pre‐existing plaques in both genders (Appendix Fig S1D).
Figure 2. Tau deletion reduces plaque formation.
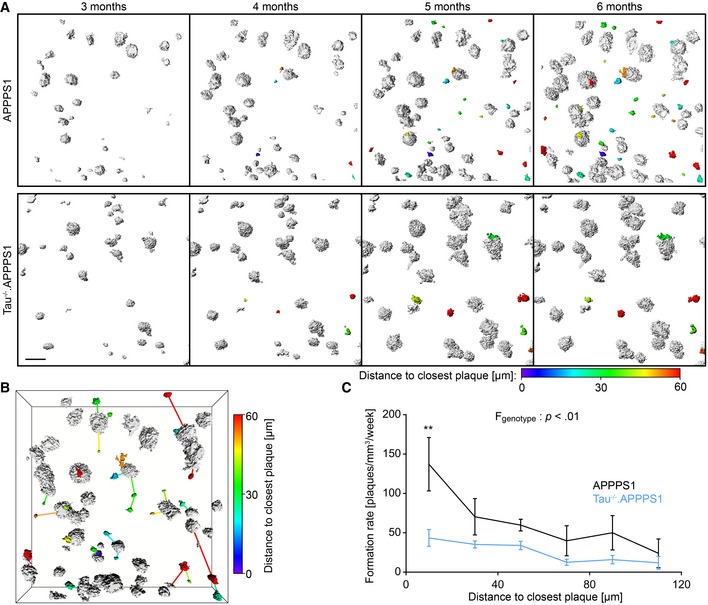
- Representative images of 3D‐rendered plaques from 3 to 6 months of age. White plaques were already present at the beginning, and colored plaques appeared during the imaging period. The color map indicates the distance of each newly formed plaque to the closest border of a pre‐existing plaque at the respective time point of formation. Since plaques are scattered in 3D over a depth of 200 μm, the inter‐plaque distance in these top‐view 2D representations occasionally seems smaller than inferred from the color code. Scale bar represents 50 μm.
- Perspective view of the plaque burden in the 6‐month‐old APPPPS1 mouse in (A). For each newly formed plaque, connecting lines point to the respective closest pre‐existing plaque.
- Mean rate of plaque formation during the imaging period at varying distances to already existing plaques. Data presented as mean ± SEM; mixed‐design ANOVA genotype F 1,13 = 10.33, P = 0.007, square root transformation was applied to reduce heteroscedasticity; Bonferroni's post hoc test; **P < 0.01; n APPPS1 = 5, n Tau−/−.APPPS1 = 10 mice; mean number of newly formed plaques analyzed per mouse = 19.
Source data are available online for this figure.
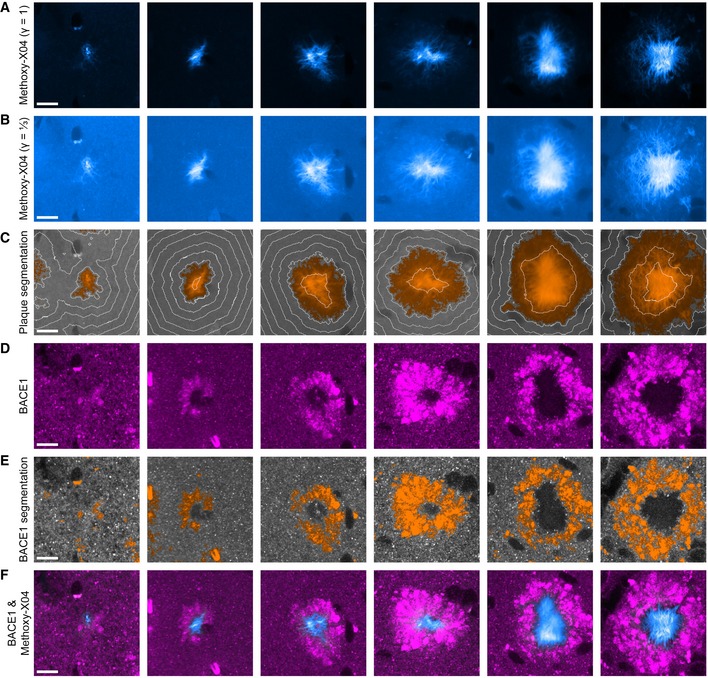
Tau deletion reduces accumulation of BACE1 in peri‐plaque dystrophies
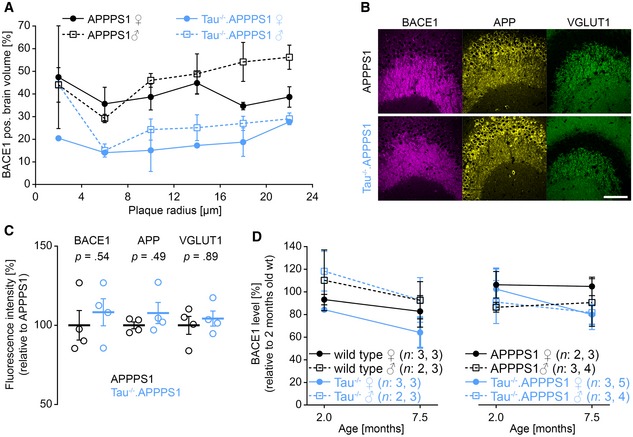
Increased satellite plaque formation might result from overt accumulation of APP and BACE1 and hence increased local Aβ production around plaques (Sadleir et al, 2016; Peters et al, 2018). We performed immunohistochemical analysis to assess the impact of tau deletion on accumulation of BACE1 in plaque‐associated dystrophies. In high‐resolution 3D data stacks, approximately 40 plaques per mouse were identified based on the Methoxy‐X04 fluorescence. Subsequently, the amount of BACE1‐positive dystrophies was quantified around individual plaques (Fig 3A–D). In APPPS1 mice, plaques consist of a dense core which is surrounded by a layer of less densely packed Aβ fibrils. BACE1‐positive dystrophies were predominantly confined to the peripheral less dense region of plaques and extended maximally a few micrometers from the outer plaque border into the surrounding brain tissue (Figs 3E and EV1). With increasing plaque size, the BACE1‐positive annulus around plaques not only increased in total volume, but also became more dense (Fig 3F). In 7.5‐month‐old Tau−/−.APPPS1 mice, the density of plaque‐associated BACE1‐positive dystrophies was reduced by half compared to APPPS1 mice (Fig 3G). BACE1 accumulation around plaques tended to be slightly higher in male compared to female mice, and tau deletion tended to have a lowering impact in both genders (Fig EV2A). We were interested whether tau deletion generally alters expression of BACE1 or might specifically affect enrichment of BACE1 in plaque‐associated dystrophies. Since BACE1 is particularly enriched in mossy fiber terminals (Kandalepas et al, 2013), a general plaque‐unrelated alteration of BACE1 expression should clearly manifest in the hippocampal stratum lucidum. However, the BACE1 immunofluorescence signal was similar between APPPS1 and Tau−/−.APPPS1 mice (Fig EV2B and C). Furthermore, Western blot analysis indicated that BACE1 levels were similar between wild‐type, Tau−/−, APPPS1, and Tau−/−.APPPS1 mice at 2 months of age (Fig 3H and I). Conversely, while BACE1 levels tended to increase with aging in APPPS1 mice, they tended to decrease in wild‐type, Tau−/− as well as Tau−/−.APPPS1 mice. However, interaction between age and genotype failed to demonstrate statistical significance (P = 0.75). In line with increased plaque deposition, female APPPS1 mice tended to have slightly higher BACE1 levels compared to male APPPS1 mice and tau deletion similarly tended to lower BACE1 levels in both genders (Fig EV2D). Overall, the data indicate that tau deletion alleviated plaque‐associated elevation of BACE1 levels without affecting physiological BACE1 expression in the absence of plaques.
Figure 3. Tau deletion reduces accumulation of BACE1 in peri‐plaque dystrophies.

-
A–DExemplary image analysis procedure. (A) Methoxy‐X04 micrograph with gamma correction set to one and a third to highlight the compact plaque core and the less dense surrounding, respectively. (B) Automatic segmentation of 3D Methoxy‐X04 intensity data stacks. Segmented plaque is subdivided into concentric 1‐μm‐thick layers that are labeled with alternating orange and yellow color. Beyond the outer plaque border, consecutive 1‐μm‐thick layers are colored in alternating light and dark gray. (C) BACE1 immunofluorescence micrograph superimposed with 5 μm spaced distance rings from the plaque border. (D) Segmentation of BACE1‐positive dystrophies. Scale bars represent 10 μm.
-
EBACE1 immunofluorescence micrographs around Methoxy‐X04‐stained plaques in 7.5‐month‐old mice. White lines indicate the plaque border. Scale bar represents 10 μm.
-
FFraction of BACE1‐positive brain volume at varying distances to the closest plaque border for plaques of different radii. Color‐coded bar along x‐axis indicates the corresponding layers in (B). Volume within plaques was assigned negative distance from plaque border. Data presented as mean; n APPPS1 = 6, n Tau−/−.APPPS1 = 5.
-
GMean fraction of BACE1‐positive brain volume within the outmost plaque layer (−1 to 0 μm) for plaques of different radii. Data presented as mean ± SEM; mixed‐design ANOVA genotype F 1,9 = 14.10, P = 0.005; n APPPS1 = 6, n Tau−/−.APPPS1 = 5; Bonferroni's post hoc test; *P < 0.05, **P < 0.01, ***P < 0.001; mean plaque number analyzed per mouse: 43.
-
HCortex samples on Western blots stained with BACE1‐specific antibody in 2‐ and 7.5‐month‐old mice. Hybridization of calnexin was used as a control for equal loading.
-
IWestern blot quantification of BACE1 levels in cortex homogenates. In order to compare samples across several gels, one brain sample was run on each gel as an internal standard. Data presented as mean ± SEM; two‐way ANOVA interaction genotype × age F 3,41 = 0.40, P = 0.754; n wt,2.0 = 5, n wt,7.5 = 6, n Tau−/−,2.0 = 5, n Tau−/−,7.5 = 6, n APPPS1,2.0 = 5, n APPPS1,7.5 = 7, n Tau−/−.APPPS1,2.0 = 6, n Tau−/−.APPPS1,7.5 = 9 mice.
Source data are available online for this figure.
Figure EV1. Segmentation of plaque‐associated BACE1‐positive dystrophies.
-
A, B(A) Methoxy‐X04 fluorescence micrographs of six plaques from 7.5‐month‐old APPPS1 mice and (B) the same plaques displayed with a gamma correction of ⅓. Due to the vast dynamic range of Aβ fibril density between the periphery and the core of compact plaques, uncontrasted Methoxy‐X04 fluorescence micrographs typically only outline the dense plaque core.
-
CSegmentations of the respective images in B with orange color indicating plaque positive regions. White lines indicate 5 μm spaced distance rings from the plaque border.
-
DBACE1 immunofluorescence micrographs.
-
ESegmentations of the respective images in (D) with orange color indicating BACE1‐positive structures.
-
FColocalization of Methoxy‐X04 fluorescence in cyan and BACE1 immunofluorescence in magenta.
Figure EV2. Effect of tau deletion on BACE1 expression.
-
AMean fraction of BACE1‐positive brain volume within the outmost plaque layer stratified according to plaque size, genotype, and gender. Data presented as mean ± SEM; n APPPS1 = 3/3 (♀/♂), n Tau−/−.APPPS1 = 2/3 (♀/♂) mice.
-
B, C(B) Fluorescence micrographs of BACE1, APP, and VGLUT1 in mossy fiber terminals of 7.5‐month‐old mice and (C) respective normalized expression levels in relation to APPPS1. Data presented as mean ± SEM; n APPPS1 = 2/2 (♀/♂), n Tau−/−.APPPS1 = 2/2 (♀/♂); Mann–Whitney test. Scale bar represents 100 μm.
-
DWestern blot quantification of cortical BACE1 levels stratified according to gender. Data presented as mean ± SEM; n wt,2.0 = 3/2 (♀/♂), n wt,7.5 = 3/3, n Tau−/−,2.0 = 3/2, n Tau−/−,7.5 = 3/3, n APPPS1,2.0 = 2/3, n APPPS1,7.5 = 3/4, n Tau−/−.APPPS1,2.0 = 3/3, n Tau−/−.APPPS1,7.5 = 5/4 mice.
Source data are available online for this figure.
Tau deletion alleviates plaque‐associated axonal damage
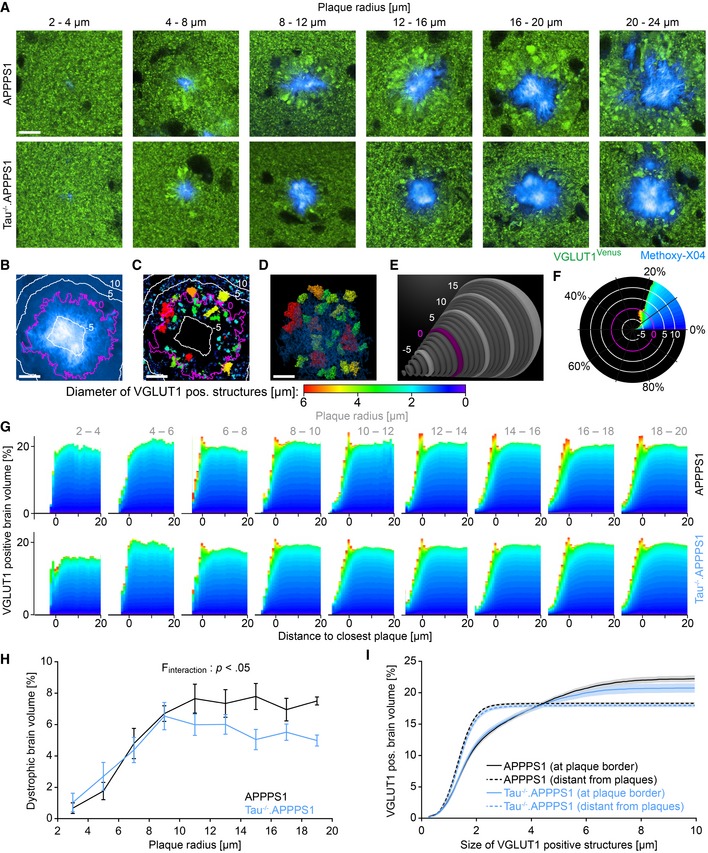
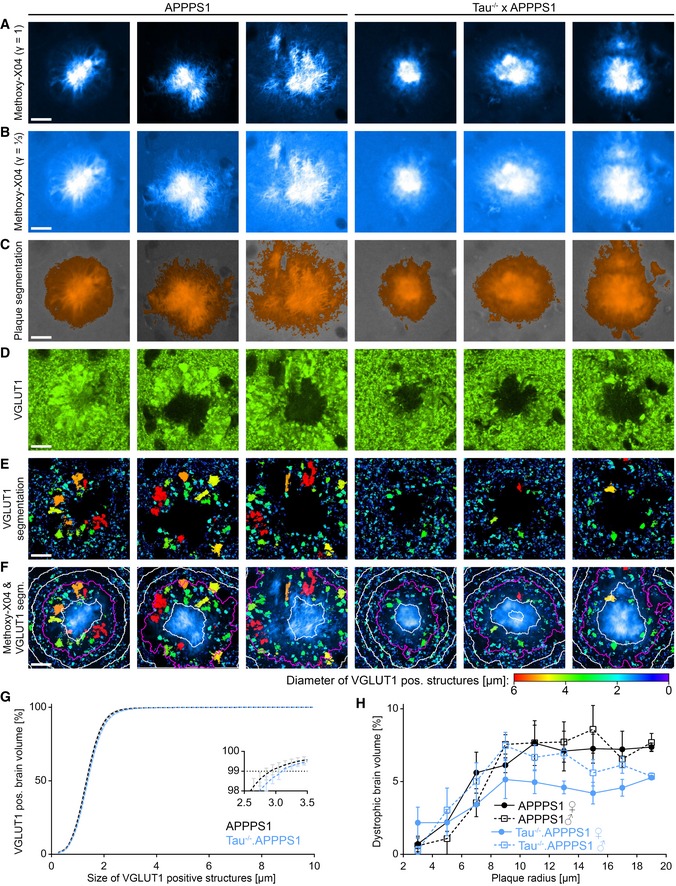
At plaques, BACE1 mainly concentrates in presynaptic dystrophic neurites (Zhao et al, 2007; Kandalepas et al, 2013). We therefore further investigated whether tau deletion specifically reduces enrichment of BACE1 or might alleviate plaque‐associated axonal pathology in general. VGLUT1Venus mice express the Vesicular GLUtamate Transporter 1, fused to the fluorescent protein Venus under the endogenous VGLUT1 promoter (Herzog et al, 2011). Thereby, glutamatergic presynaptic boutons were fluorescently labeled and appeared as small sphere‐like structures in APPPS1.VGLUT1Venus mice. Conversely, dystrophic axons were visible as large diameter varicosities (Fig 4A). Custom‐written MATLAB script was applied to quantify how the size and density of VGLUT1‐positive structures changes with distance to the plaque border (Figs 4B–F and EV3A–F). In high‐resolution 3D data stacks, approximately 100 individual plaques were identified per mouse based on the Methoxy‐X04 fluorescence (Fig 4B). The VGLUT1Venus fluorescence pattern was segmented into individual structures, and the size of each structure was calculated (Fig 4C and D). Subsequently, the composition of small and large VGLUT1‐positive structures was determined in consecutive layers around the plaque border in 3D (Fig 4E and F). In both cohorts, VGLUT1‐positive structures generally occupied approximately 20% of the brain volume. This fraction slightly increased close to the border of large plaques (> 6 μm radius) and abruptly declined toward the plaque core (Fig 4G). Presynaptic structures were classified as axonal dystrophies if their diameter exceeded 3 μm. This threshold seemed appropriate, since distant to plaques (> 20 μm from plaque borders) only 1% of VGLUT1‐positive brain tissue was occupied by larger VGLUT1‐positive structures (Fig EV3G). The amount of plaque‐associated axonal dystrophies was heterogeneous among individual plaques (Fig EV4) and was more pronounced around large plaques. Therefore, the data was stratified according to plaque size. Around small plaques of 2–10 μm radius, the fraction of brain volume occupied by axonal dystrophies was similar between cohorts. However, in Tau−/−.APPPS1 mice, large plaques above 10 μm radius were associated with less axonal dystrophies compared to similarly sized plaques of APPPS1 mice (Fig 4H). The tau‐dependent alleviation of plaque‐associated axonal pathology tended to be strongest among female mice (Fig EV3H). We addressed whether tau deletion particularly reduced axonal dystrophies or might in general reduce also the small VGLUT1‐positive boutons around large plaques. Therefore, among those plaques with a radius larger than 10 μm, the size distribution of VGLUT1‐positive structures was compared. While regularly sized structures (diameter below 3 μm) were present at equal densities, tau deletion particularly reduced the amount of swollen dystrophic axons (Fig 4I, solid lines). Since tau protein is critically involved in microtubule stability (Rapoport et al, 2002) and regulates transport of proteins and vesicles (Vossel et al, 2010), we investigated whether tau deficiency might independently of plaques evoke changes in the VGLUT1 expression pattern. However, distant to plaques (> 20 μm from plaque borders) the size distribution was similar between the cohorts (Fig 4I, dashed lines). Overall, the data indicate that tau deletion alleviated swelling of presynaptic structures around plaques, but did not affect the size of presynaptic structures distant to plaques.
Figure 4. Tau deletion alleviates plaque‐associated axonal damage.
-
AVGLUT1Venus fluorescence micrographs around Methoxy‐X04‐stained plaques in 7.5‐month‐old mice. Scale bar represents 10 μm.
-
B–FExemplary quantification procedure for the 16–20 μm sized plaque from the APPPS1 cohort shown in (A). (B) Methoxy‐X04 fluorescence micrograph with ⅓ gamma correction. Magenta colored line depicts the plaque border, and white lines indicate 5 μm spaced distance rings in‐ and outward from the plaque border. Volume within plaques was assigned negative distance from plaque border. (C) Segmentation of VGLUT1Venus fluorescence pattern into distinct structures within one Z‐layer. The color code indicates the diameter of individual VGLUT1‐positive structures. (D) Three‐dimensional representation of “dystrophic” VGLUT1‐positive structures with a diameter above 3 μm. (E) Within successive 1‐μm‐thick layers around the plaque border (magenta), the volume occupied by VGLUT1‐positive structures of different sizes was calculated, and (F) in each consecutive layer, the cumulative distribution was determined. Scale bars represent 10 μm.
-
GCumulative distribution of small and large VGLUT1‐positive structures at varying distance to the plaque border. Each graph indicates the mean size distribution among plaques of certain size in the two genotype cohorts. Data presented as mean; n APPPS1 = 5, n Tau−/−.APPPS1 = 5 mice.
-
HFraction of brain volume occupied by VGLUT1‐positive dystrophies within the outmost plaque layer (−1 to 0 μm). Data presented as mean ± SEM; mixed‐design ANOVA interaction genotype × plaque size F 8,64 = 2.46, P < 0.022, Huynh–Feldt correction; Bonferroni's post hoc test; n APPPS1 = 5, n Tau−/−.APPPS1 = 5 mice; mean plaque number analyzed per mouse: 105.
-
ISolid lines indicate cumulative fraction of brain volume occupied by differently sized VGLUT1‐positive structures at the border of 10–20 μm sized plaques. Dashed lines indicate cumulative fraction of VGLUT1‐positive structures in brain tissue more than 20 μm apart from plaques. Data presented as mean ± SEM; n APPPS1 = 5, n Tau−/−.APPPS1 = 5 mice.
Source data are available online for this figure.
Figure EV3. Segmentation of plaque‐associated VGLUT1‐positive dystrophies.
-
A, B(A) Methoxy‐X04 fluorescence micrographs of six plaques from 7.5‐month‐old mice and (B) the same plaques displayed with a gamma correction of ⅓.
-
CSegmentations of the respective images in (B) with orange color indicating plaque positive regions.
-
DVGLUT1Venus fluorescence micrographs.
-
ESegmentations of the respective images in (D). The color code indicates the diameter of individual VGLUT1‐positive structures.
-
FColocalization of Methoxy‐X04 fluorescence in cyan and VGLUT1 segmentations. Magenta colored line depicts the plaque border, and white lines indicate 5 μm spaced distance rings in‐ and outward from the plaque border.
-
GSize distribution of VGLUT1‐positive structures in the VGLUT1‐positive brain tissue more than 20 μm apart from plaques. The inset graph indicates the excerpt around the 99th percentile. Data presented as mean ± SEM; n APPPS1 = 5, n Tau−/−.APPPS1 = 5 mice.
-
HFraction of brain volume occupied by axonal dystrophies within the outmost plaque layer stratified according to gender. Data presented as mean ± SEM; n APPPS1 = 3/2 (♀/♂), n Tau−/−.APPPS1 = 2/3 (♀/♂) mice.
Figure EV4. Plaque‐associated axonal pathology is heterogeneous between individual plaques.
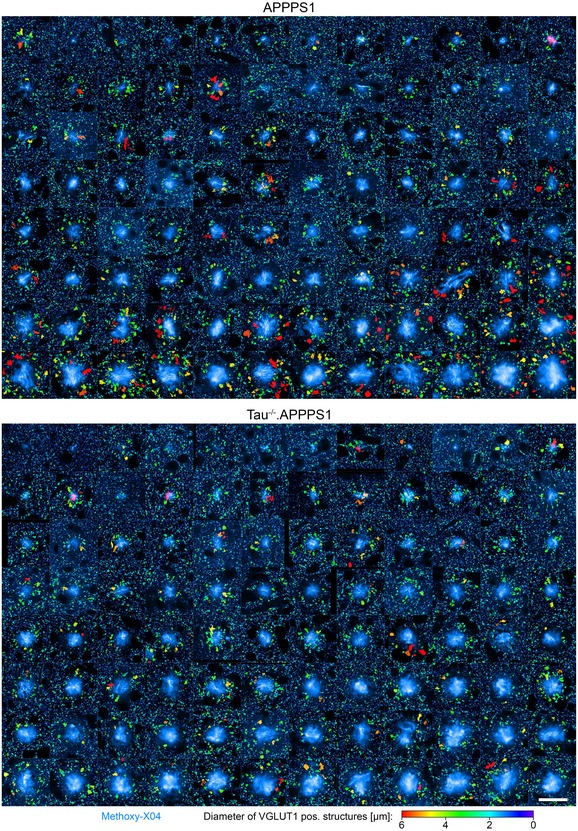
VGLUT1 fluorescence pattern around 96 plaques per cohort in 7.5‐month‐old mice. VGLUT1Venus fluorescence is color‐coded according to the size of individual structures, and Methoxy‐X04 fluorescence is shown in cyan. Scale bar represents 30 μm.
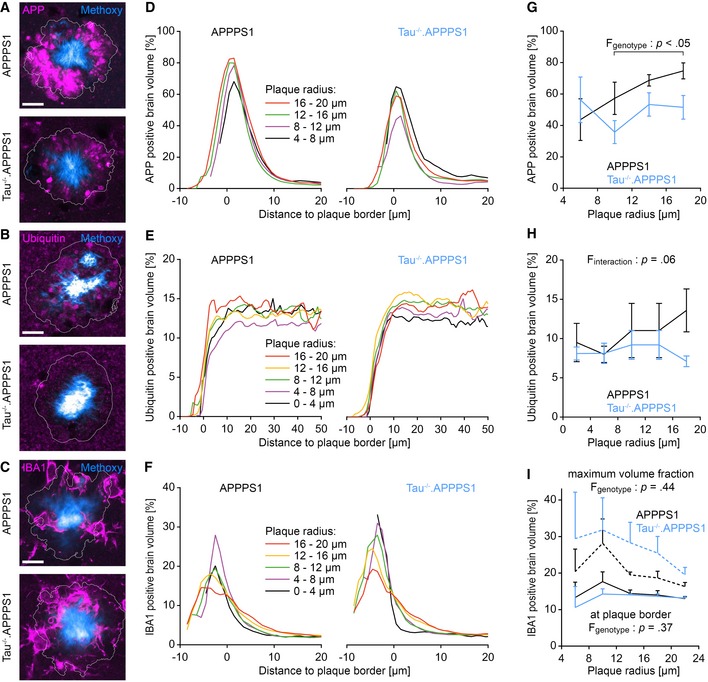
Tau deletion reduces accumulation of APP in peri‐plaque dystrophies
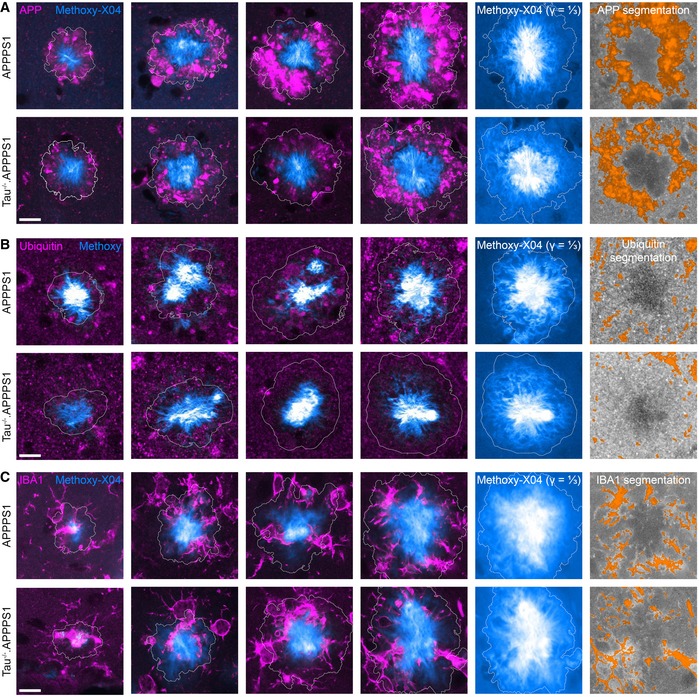
The previous analyses pointed to a role of tau in mediating Aβ‐induced axonal pathology. In a similar manner as for BACE1, immunohistochemical analysis was combined with automatic image segmentation to quantify the impact of tau deletion on the expression pattern of APP and ubiquitin in 7.5‐month‐old mice. Around large plaques (> 8 μm radius), the density of APP‐positive dystrophies was significantly reduced in Tau−/−.APPPS1 compared to APPPS1 mice (Figs 5A, D and G, and EV5A). Similarly, ubiquitin‐positive structures tended to be reduced particularly among large plaques as well (Figs 5B, E and H, and EV5B). However, interaction between age and genotype narrowly failed to demonstrate statistical significance (P = 0.06), potentially because ubiquitin‐positive soma close to plaques diluted the effect in dystrophic neurites. Since microglia have been attributed a role in plaque‐associated pathology and plaque compactness (Condello et al, 2015), we analyzed expression of the immune cell marker‐ionized calcium‐binding adaptor molecule 1 (IBA1) around plaques (Figs 5C, F and I, and EV5C). Toward the core of plaques, IBA1‐positive brain volume tended to be slightly denser in Tau−/−.APPPS1 compared to APPPS1 mice (Fig 5I, dashed lines). However, the genotype effect failed to demonstrate statistical significance (P = 0.44). At the plaque border and outside plaques, the density of IBA1‐positive brain volume was similar between the cohorts (Fig 5I, solid lines).
Figure 5. Tau deletion reduces accumulation of APP in peri‐plaque dystrophies.
-
A–CImmunofluorescence micrographs indicating the expression pattern of (A) APP (APPY188‐specific antibody), (B) ubiquitin, and (C) IBA1 around Methoxy‐X04‐stained plaques in 7.5‐month‐old mice. White lines indicate the plaque border as defined by Methoxy‐X04 fluorescence. Scale bar represents 10 μm.
-
D–FFraction of (D) APP, (E) ubiquitin, and (F) IBA1 immunopositive brain volume at varying distances to the closest plaque border for plaques of different radii. Data presented as mean.
-
GFraction of APP‐positive brain volume within the outmost plaque layer (−1 to 0 μm). Data presented as mean ± SEM; mixed‐design ANOVA genotype F 1,6 = 7.54, P = 0.033; Bonferroni's post hoc test; n APPPS1 = 4, n Tau−/−.APPPS1 = 4 mice; mean plaque number analyzed per mouse: 15.
-
HFraction of ubiquitin‐positive brain volume between 1 and 6 μm from plaque borders. Data presented as mean ± SEM; mixed‐design ANOVA interaction genotype × plaque radius F 2.2,19.5 = 3.28, P = 0.056, rank transformation was performed to reduce heteroscedasticity; n APPPS1 = 6, n Tau−/−.APPPS1 = 5 mice; mean plaque number analyzed per mouse: 50.
-
ISolid lines indicate the fraction of IBA1‐positive brain volume within the outmost plaque layer (−1 to 0 μm; mixed‐design ANOVA genotype F 1,6 = 0.93, P = 0.37). Dashed lines indicate the maximum IBA1‐positive volume fraction within plaques (mixed‐design ANOVA genotype F 1,6 = 0.69, P = 0.44). Data presented as mean ± SEM; n = 4 mice per cohort; mean plaque number analyzed per mouse: 30.
Source data are available online for this figure.
Figure EV5. Segmentation of APP, ubiquitin, and IBA1 fluorescence micrographs.
-
A–CImmunofluorescence micrographs indicating the expression pattern of (A) APP, (B) ubiquitin, and (C) IBA1 around Methoxy‐X04‐stained plaques in 7.5‐month‐old mice. Columns 1–4 display immuno‐ and Methoxy‐X04 fluorescence micrographs of different plaques. Column 5 shows the same plaque as in column 4 with ⅓ gamma correction of the Methoxy‐X04 channel. Column 6 shows the segmentation of immunofluorescence signal for the respective plaques in column 4. Scale bar represents 10 μm.
Tau deletion reduces plaque compactness
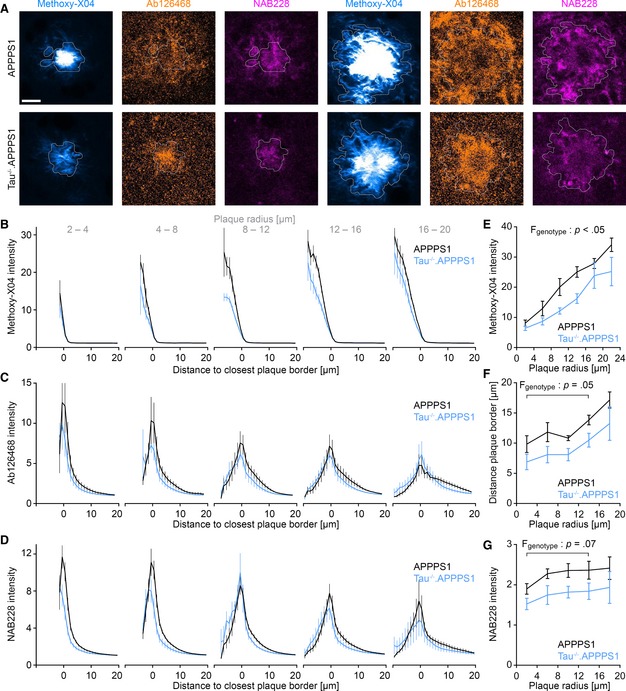
Reduced plaque‐associated BACE1 accumulation in Tau−/−.APPPS1 mice correlated well with reduced formation of satellite plaques, but only slightly affected plaque growth. We addressed the potential cause for this discrepancy. At lower Aβ production rates—as suspected around plaques in Tau−/−.APPPS1 mice—soluble Aβ molecules might already accrete to Aβ fibrils in the plaque periphery and not reach the plaque core. Thereby, plaques would grow, but might not become as compact. In 7.5‐month‐old mice, cortical brain sections were labeled with Methoxy‐X04 and two antibodies (Ab126468 and NAB228), specific for fibrillar Aβ (Fig 6A). The fluorescence intensity profile was quantified from outside toward the center of individual plaques (Fig 6B–D). The mean Methoxy‐X04 intensity continuously increased from the plaque border toward the center in both cohorts, and the intensity within the plaque core was stronger in large as compared to small plaques (Fig 6B and E). These data indicate that plaques gradually become more compact while they grow. The Methoxy‐X04 intensity was lower in small and large plaques of Tau−/−.APPPS1 compared to APPPS1 mice (Fig 6E, Appendix Fig S2A), indicating that plaques of similar total size were less compact in Tau−/−.APPPS1 mice. Interestingly, the fluorescence intensity profiles of NAB228‐ and Ab126468‐labeled Aβ markedly differed from the Methoxy‐X04 intensity profiles. The antibody‐labeled Aβ signal increased over background fluorescence already outside the Methoxy‐X04 defined plaque borders (Fig 6F, Appendix Fig S2B). Thus, plaques were surrounded by a 5‐ to 20‐μm‐thick layer of Methoxy‐X04‐negative Aβ fibrils. The layer thickness increased with plaque size and was reduced in Tau−/−.APPPS1 mice (P = 0.05 for Ab126468, P = 0.19 for NAB228; Fig 6F and Appendix Fig S2B). Furthermore, in this peripheral region outside Methoxy‐X04‐positive plaques, the Aβ immunolabeling intensity tended to be lower in Tau−/−.APPPS1 mice compared to APPPS1 mice (P = 0.0.07 for NAB228, P = 0.21 for Ab126468; Fig 6G, Appendix Fig S2C). In contrast to Methoxy‐X04, the immunolabeling signal steeply declined from the border toward the center of plaques, which likely results from the different molecular mass and thus distinct diffusion properties. While the small‐molecule Methoxy‐X04 penetrated all parts of plaques, the relatively large antibodies only accessed the less dense peripheral region of plaques. Thereby, counterintuitively, the maximum Aβ immunolabeling intensity decreased with increasing plaque size (Appendix Fig S2D), because antibodies had to traverse thicker layers of Aβ fibrils. Thus, within the core of plaques, antibody labeling might not reflect actual protein levels and should be evaluated with caution. Altogether, the Methoxy‐X04 and Aβ immunolabeling data indicate that plaques of similar size were less compact in Tau−/−.APPPS1 mice.
Figure 6. Tau deletion reduces plaque compactness.
-
ACortical brain sections of 7.5‐month‐old mice stained with Methoxy‐X04 and the fibrillar Aβ‐specific antibodies NAB228 and Ab126468. White lines depict the outer plaque border as defined by Methoxy‐X04 fluorescence. Scale bar represents 10 μm.
-
B–DGraphs indicate (B) Methoxy‐X04, (C) Ab126468, and (D) NAB228 intensity profiles from outside plaques toward the core of differently sized plaques. Volume within plaques was assigned negative distance from plaque border. Fluorescence was normalized to the mean background fluorescence distant to plaques (> 20 μm from plaque borders). Data presented as mean ± SEM; n APPPS1 = 6, n Tau−/−.APPPS1 = 5 mice; mean plaque number analyzed per mouse was 121 (Methoxy‐X04) and 81 (Ab126468, NAB228).
-
EMaximal Methoxy‐X04 intensity for plaques of varying size. Data presented as mean ± SEM; mixed‐design ANOVA genotype F 1,9 = 7.48, P < 0.023, square root transformation was applied to reduce heteroscedasticity; n APPPS1 = 6, n Tau−/−.APPPS1 = 5 mice; mean plaque number analyzed per mouse = 121.
-
FDistance from plaque border at which Ab126468 fluorescence signal exceeds 150% of mean background intensity. Data presented as mean ± SEM; mixed‐design ANOVA genotype F 1,9 = 4.91, P = 0.054; n APPPS1 = 6, n Tau−/−.APPPS1 = 5 mice; mean plaque number analyzed per mouse = 81.
-
GMean NAB228 intensity between 4 and 10 μm from plaque border. Data presented as mean ± SEM; mixed‐design ANOVA genotype F 1,9 = 4.24, P = 0.070, rank transformation was performed to reduce heteroscedasticity; n APPPS1 = 6, n Tau−/−.APPPS1 = 5 mice; mean plaque number analyzed per mouse = 81.
Source data are available online for this figure.
Discussion
While it is widely recognized that Aβ accumulation triggers tau aggregation (Götz et al, 2001; Lewis et al, 2001), it has remained controversial whether tau affects Aβ deposition vice versa. Our data indicate that tau deletion attenuated the progression but not the initiation of Aβ deposition in APPPS1 mice. Cortical BACE1, APP, and soluble Aβ levels were similar between the cohorts before pronounced plaque deposition in 2‐month‐old mice. Accordingly, at 3 months of age, the density and total brain volume coverage of plaques were similar between cohorts. Only with aging, the formation rate of new plaques strongly declined in Tau−/−.APPPS1 mice. Previous studies have reported that tau deletion affects Aβ deposition neither in APP23 mice (Ittner et al, 2010) nor in another transgenic model overexpressing APP with familial AD mutations (Roberson et al, 2007). In contrast, tau deletion reduced the Aβ load in 5xFAD mice (Leroy et al, 2012) and reduced the density of neuritic plaques despite increased Aβ levels in tg2576 mice (Dawson et al, 2010). While the previous studies were performed postmortem, we applied chronic in vivo two‐photon imaging to investigate the kinetics of Aβ deposition. Overall, our data indicate that the presence of tau not affects Aβ deposition during the onset stage, but considerably drives Aβ deposition once initial plaques have formed. This aging‐dependent effect of tau deletion on Aβ deposition might be an explanation for the controversial results in previous single time point studies.
We addressed the potential reason for the differential effect of tau deletion at different stages of Aβ deposition. Interestingly, our data indicate that tau deletion effectively prevented the formation of satellite plaques, which are known to frequently form close to pre‐existing plaques (McCarter et al, 2013; Peters et al, 2018). Satellite plaque formation might result from enrichment of BACE1 and APP (Zhao et al, 2007) and thus potentiated Aβ production (Sadleir et al, 2016) in plaque‐associated axonal dystrophies.
Therefore, we investigated how tau deletion affects BACE1 expression in APPPS1 mice. Interestingly, while tau deletion strongly reduced the amount of BACE1‐positive dystrophies around plaques, BACE1 expression distant to plaques was not affected. That is, in the target region of hippocampal mossy fibers that are known to express high levels of BACE1, we did not observe any difference between the cohorts. These results are consistent with observations that ablating or knocking down tau in neurons prevented Aβ‐induced axonal transport defects without affecting transport at baseline (Vossel et al, 2010, 2015). Congruent with our immunostaining experiments, Western blot analysis affirmed that cortical BACE1 levels were similar between APPPS1 and Tau−/−.APPPS1 mice before pronounced Aβ deposition had occurred. Only with aging, BACE1 levels tended to increase in APPPS1 mice, while they tended to decrease in wild‐type, Tau−/−, and Tau−/−.APPPS1 mice. Overall, these data support that tau deletion focally reduced overt BACE1 accumulation associated with plaque deposition but did not affect physiological BACE1 expression elsewhere in the brain. In comparison, a previous study reported that tau deletion did not affect plaque‐associated BACE1 accumulation even though BACE1 levels were overall reduced in the brains of tau‐ablated 5xFAD mice (Leroy et al, 2012).
Similar to BACE1, we observed that VGLUT1‐ and APP‐positive dystrophies were reduced and ubiquitin‐positive dystrophies tended to be reduced around plaques in Tau−/−.APPPS1 mice. VGLUT1 is a presynaptic protein, and BACE1 normally localizes to presynaptic terminals as well (Zhao et al, 2007). Around plaques, BACE1, APP, and ubiquitin particularly concentrate in presynaptic dystrophic neurites (Zhao et al, 2007; Kandalepas et al, 2013). Thus, our immunohistochemical analyses support that tau deletion not specifically reduces BACE1 accumulation, but seems to generally alleviate accumulation of proteins in the presynaptic/axonal neuritic compartment. Importantly, plaque‐associated axonal damage was not entirely prevented in Tau−/−.APPPS1 mice and thus other tau‐independent mechanisms likely contribute to this pathology.
Previous studies have reported that tau deletion not affects neuritic pathology around plaques in 5xFAD mice (Leroy et al, 2012), but strongly increases axonal degeneration in Tg2576 mice (Dawson et al, 2010). On the contrary, overexpressing wild‐type human tau in APP/PS1 mice enhanced plaque‐associated neuritic damage (Jackson et al, 2016), which would indicate a beneficial impact of tau reduction upon reversion. The conflicting observations on the role of tau in mediating plaque‐associated axonal pathology might be due to the different AD models or different ages that were investigated. Importantly, our quantitative image analysis in hundreds of plaques indicates that the degree of axonal damage considerably depended on the size of plaques and was heterogeneous even among plaques of similar size from the same brain region. Thus, for a proper estimate of plaque‐associated pathology, it is crucial to include a large number of plaques per mouse and to stratify the data according to plaque size.
The focal reduction of BACE1 and APP around plaques in Tau−/−.APPPS1 mice is in line with the kinetics of Aβ deposition that we observe in these mice. Based on our results, we would propose the following hypothetical model: In young mice, plaques initially form at similar rates because cortical BACE1 and APP levels and thus Aβ production are similar between the cohorts. With aging, plaques grow and start to locally elicit accumulation of BACE1 and APP, thereby further potentiating Aβ production and satellite plaque formation in their vicinity. Since tau deletion alleviates overt BACE1 accumulation around plaques, new plaque formation which requires a high critical Aβ concentration (Jarrett & Lansbury, 1993; Harper & Lansbury, 1997; Hellstrand et al, 2010; Burgold et al, 2014) is reduced. However, even at a lower concentration, Aβ continues to accrete to pre‐existing plaques in Tau−/−.APPPS1 mice. In fact, the reduced plaque compactness in Tau−/−.APPPS1 mice indicates that soluble Aβ is mostly absorbed already in the periphery of plaques and scarcely reaches the plaque core. Thereby, plaques would grow at a similar rate but become less compact in Tau−/−.APPPS1 mice.
Our data support that tau exacerbates Aβ deposition by mediating plaque‐associated axonal pathology, but the role of tau is likely manifold. An alternative explanation could involve tau‐dependent alteration of the microglial immune response around plaques. Our immunohistochemical analysis indicated that the amount of IBA1‐positive microglial volume was similar between the two cohorts around plaques. Only within the plaque core, the IBA1‐positive brain volume fraction tended to be higher in Tau−/−.APPPS1 mice. However, the genotype effect failed to demonstrate statistical significance and immunolabeling within the core could also be lowered due to reduced antibody penetration into the more compact plaques of APPPS1 mice. Thus, our data do not exclude that tau deficiency in microglia contributes to the results we observe, but they do not point to a major influence.
In line with previous findings that tau deletion alone not interferes with axonal transport (Vossel et al, 2015), we did not observe altered expression of VGLUT1, BACE1, and APP distant to plaques in Tau−/−.APPPS1 mice. Thus, the role of tau in mediating axonal damage and Aβ deposition seems to be linked to gain of function within the unique Aβ plaque environment. In a recent study, it was shown that tau initially aggregates in dystrophic neurites surrounding Aβ plaques (He et al, 2018). It is tempting to speculate that such initially formed tau species might locally compromise microtubules and thereby axonal transport of BACE1 and other proteins. This notion would be in line with in vitro studies reporting that Aβ species cause tau‐dependent microtubule disassembly (King et al, 2006). While tau deletion has been shown to alleviate Aβ‐induced anterograde transport deficits in vitro (Vossel et al, 2010), BACE1 is thought to accumulate due to deficient retrograde transport of BACE1 containing late endosomes (Gowrishankar et al, 2015). However, it remains unclear how pathological forms of tau affect axonal transport after prolonged Aβ exposure around plaques in the living adult brain. Vesicles might be able to enter, but not transit or exit dystrophic regions, due to microtubule disruption (Sadleir et al, 2016).
Overall, our data reinforce the notion that BACE1 accumulation in plaque‐associated dystrophies potentiates local Aβ production and thus emphasize plaque‐induced pathology as a relevant mediator that drives further pathological progression. Importantly, the results support the hypothesis that the connection between Aβ and tau is bidirectional rather than unidirectional. While Aβ is clearly required as an initial trigger, tau thereafter mutually reinforces Aβ deposition. Tau‐dependent enrichment of BACE1 in plaque‐associated dystrophies might emerge as the connecting link entailing this positive feedback loop. Thus, targeting tau‐dependent mechanisms might not only reduce tau‐induced neurotoxicity, but could interfere with this vicious pathogenic cycle. Importantly, tau deletion specifically alleviated overt accumulation of BACE1 associated with progressive Aβ deposition, without compromising physiological BACE1 expression distant to plaques. In comparison with systemic BACE inhibition with the known caveat of dose‐dependent adverse effects (Filser et al, 2015; Egan et al, 2018), such an approach might particularly reduce BACE1 at the sites where it occurs at increased levels.
Materials and Methods
Transgenic and mutant mice
The experiments with postmortem brain tissue were carried out in 2‐ and 7.5‐month‐old mice, and in vivo imaging data were obtained from 3 to 6 months of age. Heterozygous APPPS1 mice (Radde et al, 2006) were crossed with tau‐deficient (Tau−/−) mice (Dawson et al, 2001) and homozygous VGLUT1Venus knock‐in mice (Herzog et al, 2011). APPPS1 mice (B6.Cg‐Tg(Thy1‐APPSw,Thy1‐PSEN1*L166P)21Jckr) were obtained from Mathias Jucker and coexpress human APP with the Swedish mutation (KM670/671NL) and mutated PS1 (L166P) under the pan‐neuron‐specific Thy1 promoter. VGLUT1Venus mice were obtained from Nils Brose and express the Vesicular GLUtamate Transporter 1 (VGLUT1), fused to the fluorescent protein Venus under the endogenous VGLUT1 promoter. Tau knockout mice (B6.129X1‐Mapttm1Hnd/J) were obtained from the Jackson Laboratory and have disrupted tau genes on both alleles. Mice were group‐housed under pathogen‐free conditions until surgery, after which they were kept single‐housed. Similar numbers of male and female mice were used in the tau‐deficient and tau‐expressing cohort. The mice were generated in separate colonies from TauWT/WT × TauWT/WT and Tau−/− × Tau−/− parents. APPPS1 × VGLUT1Venus mice expressing endogenous murine tau served as control.
Study approval
All applicable international, national, and/or institutional guidelines for the care and use of animals were followed. All protocols and procedures involving animals were approved and conducted in accordance with the ethical standards of the Ludwig‐Maximilian University and the Government of Upper Bavaria (Az. 55.2‐1‐54‐2532‐62‐12 and 55.2‐1‐54‐2532‐214‐2016). This article does not contain any studies with human participants performed by any of the authors.
Statistics
For statistical analysis, GraphPad Prism 5 (GraphPad Software) and SPSS (IBM SPSS Statistics 25) were used. Inter‐group comparisons were performed using two‐tailed unpaired Student's t‐test or Mann–Whitney test. Mixed‐design ANOVA was performed to compare variables across groups in the longitudinal measurements and to assess changes between groups with respect to plaque size, distance to plaque border, or size of VGLUT1‐positive structures. Two‐way ANOVA was applied to compare cortical BACE1 levels across different genotypes and age. P values refer to the test of interaction unless specified otherwise. Normal distribution and homoscedasticity were assessed by Shapiro–Wilk and Levene's test, respectively. If variables were not normally distributed, square root transformation or rank transformation was applied to improve normality and homoscedasticity. For rank transformation, the entire set of observations was ranked from smallest to largest (Conover et al, 1981). Mauchly's test was performed to calculate sphericity, and Greenhouse–Geisser or Huynh–Feldt adjustment were used to correct for violations of sphericity. If genotype effects or interactions were found, post hoc analyses were performed using Bonferroni's multiple comparisons test. Regression lines were calculated based on the least square algorithm, and value R 2, ranging from 0 to 1, was calculated as an indicator for goodness of fit. All results are presented as mean ± SEM. For statistical analysis, biological replicates (individual mice, not plaques) were considered as experimental unit. Data analysis was conducted in blinded fashion.
Brain extraction
Mice were anesthetized by intraperitoneal injection of ketamine (130 mg/kg) and xylazine (10 mg/kg). Subsequently, brains were extracted, quick‐frozen on dry ice, and stored at −80°C.
Aβ quantification
Frozen murine cortices were homogenized with a Sonifier 450 (Branson) in nine volumes of Tris‐buffered saline (pH 7.4, 4°C) containing complete protease inhibitor cocktail and stored in aliquots at −80°C. Triton X‐100 was added to a final concentration of 1%, and homogenates were incubated for 15 min at 4°C. After ultracentrifugation at 100,000 × g for 15 min, clear supernatants were diluted 1:100 and used for analysis. Levels of Aβ40 and Aβ42 were determined using the electrochemiluminescence immunoassay kits based on 6E10 from Meso Scale Discovery (Rockville) in either singlet or triplex format. Samples and standards were prepared according to the manufacturer's protocols.
Protein analysis
Protein concentrations were determined in cortex homogenates with the BCA (B9643, Sigma‐Aldrich). Equal amounts of proteins were loaded onto 8% SDS–PAGE gels with Laemmli buffer (8% SDS, 10% β‐mercaptoethanol, 40% glycerol, 0.025% bromophenol blue, 125 mM Tris, pH 6.8). Proteins were separated in Tris‐buffer (0.1% SDS, 190 mM glycine, 25 mM Tris) and then transferred onto polyvinylidene difluoride membranes (Amersham Hybond P 0.45 PVDF) overnight with Tris‐glycine buffer (25 mM Tris, 240 mM glycine). The Dual Xtra Prestained Protein Standard (Bio‐Rad) served as molecular mass marker. The membranes were blocked for 30 min at room temperature (RT) in PBS containing 0.1% Tween‐20 (A4974, 0500 AppliChem Panreac) and 6% non‐fat dry milk. Membranes were incubated overnight at 4°C with primary antibodies against BACE1 (rabbit polyclonal, D10E5, Cell Signaling, 1:1,000), APP (rabbit polyclonal, Y188, ab32136, Abcam, 1:10,000), calnexin (mouse monoclonal, ADI‐SPA‐860, Enzo, 1:2,000), and β‐actin (mouse monoclonal, A5316, Sigma, 1:10,000) in PBS‐T buffer (0.5% Tween‐20 in PBS). Membranes were washed three times for 10 min at RT in PBS‐T and subsequently incubated with horseradish‐peroxidase‐conjugated goat anti‐rabbit and goat anti‐mouse secondary antibodies. After incubation for 1 h at RT followed by three washes in PBS‐T, membranes were incubated with horseradish‐peroxidase substrate (ECL, GE Healthcare or ECL Plus) for 2 min and signals were captured with the ImageQuant LAS 4000 biomolecular imager (GE Healthcare Life Science). Multi Gauge software (Fujifilm) was applied for quantification of protein levels. Hybridization of calnexin and β‐actin was used as controls for equal loading. To compare BACE1 levels across several gels, the brain homogenate of a 2‐month‐old control mouse was run on each gel as an internal standard. All band intensities were normalized to this standard. The samples derive from the same experiment, and gels were processed in parallel.
Cranial window surgery
A cranial window was implanted over the right cortical hemisphere as previously described (Fuhrmann et al, 2007; Holtmaat et al, 2009). In brief, mice were anesthetized with an intraperitoneal injection of ketamine (130 mg/kg) and xylazine (10 mg/kg). Additionally, dexamethasone (20 μl at 4 mg/ml) was administered intraperitoneally immediately before surgery to prevent the development of cerebral edema. An open‐skull cranial window (5 mm diameter coverslip) was implanted above the somatosensory cortex. The center coordinates of the craniotomy were at Bregma +1.0 and 3.0 mm lateral from the midline. A metal bar was attached firmly to the skull to allow repositioning the mouse during subsequent imaging sessions. After surgery, mice received a subcutaneous analgesic treatment with carprofen (7.5 mg/kg) and antibiotic treatment with cefotaxime (5 mg/kg).
Chronic in vivo two‐photon imaging
Chronic in vivo two‐photon imaging was started after a recovery period of 4 weeks to minimize the effect of microglial activity in response to installation of the cranial window. In order to stain Aβ plaques, Methoxy‐X04 was injected intraperitoneally (0.5 mg/kg) 24 h before each imaging session. During imaging, mice were anesthetized with isoflurane (1% in 95% O2, 5% CO2), placed on a heating pad to keep body temperature at 37°C, and fixed to a custom‐made holder using the glued metal bar. In vivo two‐photon imaging was performed on a LSM 7 MP (Carl Zeiss) equipped with GaAsP (Gallium Arsenide) detectors and a 20× water‐immersion objective (W Plan‐Apochromat 20×/1.0 DIC, 1.0 NA, Carl Zeiss). In each mouse, a 425 × 425 × 200 μm3 large region of interest was reimaged weekly at a resolution of 0.24 × 0.24 × 0.4 μm3. Methoxy‐X04 was excited at 750 nm by a Ti:Sa laser (MaiTai DeepSee, Spectra‐Physics), and emission was collected below 485 nm. In subsequent imaging sessions, the previously imaged brain region was identified using the unique blood vessel pattern. To keep the emitted fluorescence stable at different depths, the laser intensity was adjusted using the z‐correction tool in the microscope control software.
Immunohistochemistry
Mice were deeply anesthetized with an intraperitoneal injection of ketamine (130 mg/kg) and xylazine (10 mg/kg) and were perfused with PBS, followed by 4% formalin solution. Mouse brains were dissected and post‐fixed in 4% formalin for 24 h at 4°C. Fixed brains were then cut into coronal sections (50 μm) with a vibratome. Free‐floating sections were permeabilized over night with 2% Triton X‐100 in PBS at RT and blocked with 10% normal goat serum, 0.3% Triton X‐100 in PBS for 2 h at RT. Sections were incubated with the following primary antibodies in 0.3% Triton X‐100 for 2 days at 4°C: BACE1 (rabbit polyclonal, D10E5, Cell Signaling, 1:100), APP (rabbit polyclonal, Y188, ab32136, Abcam, 1:500), IBA1 (rabbit polyclonal, 019‐19741, Wako, 1:500), NAB228 (mouse monoclonal, sc‐32277, Santa Cruz, 1:500), Ab126468 (rabbit polyclonal, Abcam, 1:500) and ubiquitin (rabbit polyclonal, ab7780, Abcam, 1:200). Subsequently, sections were washed three times in PBS and incubated with secondary antibody coupled to Alexa with an affinity for different species at a dilution of 1:500 for 2 days at 4°C. To stain amyloid plaques, sections were incubated for 15 min with 10 μg/ml Methoxy‐X04 in 50% ethanol, followed by three washes with 50% ethanol at RT. Sections were finally washed three times for 10 min with PBS before mounting them on glass coverslips with fluorescence conserving mounting medium (Dako).
Confocal imaging
Images were acquired with a LSM 780 confocal microscope (Zeiss) equipped with a 40×/1.4 oil‐immersion objective. Three‐dimensional 16‐bit data stacks were acquired in the somatosensory cortex with a lateral size of 1,024 × 1,024 pixels and an axial size of 30–110 pixels (depending on axial resolution and thickness of brain sections). BACE1, VGLUT1, IBA1, and APP micrographs were recorded at a lateral resolution of 0.1 μm/pixel and an axial resolution of 0.2 μm/pixel. Ubiquitin, Ab126468, and NAB228 micrographs were recorded at a lateral resolution of 0.2 μm/pixel and an axial resolution of 0.8 μm/pixel. For quantification of protein expression levels in mossy fiber terminals, two‐dimensional 16‐bit images with 1,024 × 1,024 pixels were acquired at 0.35 × 0.35 μm resolution.
Analysis of 3D microscopical data
Image data analysis was performed as previously reported (Peters et al, 2018), with slight modifications. All data stacks obtained by in vivo two‐photon microscopy were deconvoluted using AutoQuant (AutoQuantX3, Media Cybernetics). Quantification of amyloid plaques, axonal dystrophies, and BACE1‐positive dystrophies was performed using custom‐written MATLAB software. Initially, data stacks were processed to diminish intensity variations among different stacks and to account for the intensity decline in the axial dimension due to absorption and scattering of photons. For this purpose, the voxel intensity was normalized in each Z‐layer to the 70th and 85th percentile for Methoxy‐X04 and VGLUT1, respectively, and to the 50th percentile for BACE1, APP, and ubiquitin. Subsequently, a percentile‐based intensity threshold was applied, and connected component analysis was performed to identify contiguous clusters of voxels. This standard analysis was slightly modified for each of the biological readouts with the detailed analysis described below.
For BACE1‐, APP‐, and ubiquitin‐positive dystrophies, the 70th percentile of immunofluorescence signal was used as threshold for each image stack and clusters smaller than 8 μm3 were excluded. Microglia were identified by applying the 90th percentile as minimal intensity threshold, and connected components below 1 μm3 volume were excluded as noise.
For VGLUT1Venus fluorescence data stacks, the 75th percentile was applied as threshold. The resulting web‐like mask of supra‐threshold voxels was further segmented morphologically by calculating the distance transformation, followed by watershed segmentation along minimal distance ridges. Subsequently, the diameter of each VGLUT1‐positive segment was calculated from its respective volume by assuming sphere‐like morphology (volume = (4/3) * π * radius3). To analyze the size distribution of VGLUT1‐positive structures as a function of plaque distance and plaque size, diameters were binned into 0.1 μm steps.
Amyloid plaques were defined by applying the 90th percentile in the Methoxy‐X04 fluorescence data stacks, which allows to detect the total extent of a given plaque, including the peripheral sparse meshwork of Aβ fibrils around the core (Fig 3A and B). The radius of each individual plaque was calculated from the Z‐plane with the largest area extension in XY (), assuming spherical shape of plaques (Hefendehl et al, 2011). All plaques that contacted the image border were excluded from the analysis. The cut‐off size was set to a minimal plaque radius of 2 μm.
The distribution of VGLUT1‐ and BACE1‐positive dystrophies, Methoxy‐X04 intensity, and rate of plaque formation was analyzed with regard to proximity to the closest amyloid plaque. For this purpose, a quasi‐Euclidean 3D distance transformation was performed at 1 μm resolution from the border (not center) of each plaque into surrounding tissue as well as toward the inside of each plaque. Voxels inside plaques were assigned negative distance from plaque border. Subsequently, the mean Methoxy‐X04 intensity or mean volume fraction of dystrophic structures was calculated in individual successive 1‐μm‐thick consecutive layers around the plaque border. To quantify the pathological impact of each individual plaque, the 3D data stacks were divided into sectors with all voxels closest to a particular plaque constituting the sector of that plaque. For statistical analysis, plaques were grouped according to their radius (bins of 2 μm or 4 μm) and the pathological impact was compared between plaques of the same size group.
In the data sets obtained by chronic in vivo imaging, individual plaques were tracked semi‐automatically over time with the surface tracking module of Imaris (version 7.7.2, Bitplane). To identify events of plaque formation, plaques were tracked back to the first time point of appearance and were only assessed when present for at least 3 weeks, to warrant unambiguous distinction from background signal. In order to obtain the radial plaque growth rate, the radii of individual plaques were fitted with a monophasic association function and the first derivative of the best fit was calculated at each time point. For the correlation of plaque formation rate with plaque distance, all plaques that formed between 3 and 6 months of age were pooled and closest plaque distance was binned into 20 μm segments.
To estimate the relative protein expression levels in the mossy fiber terminals, the ratio between the mean immunofluorescence intensity within hippocampal stratum lucidum and that in the stratum oriens was calculated.
Author contributions
HS, FP, KP, MP, SFL, and UN performed the measurements. FP, HS, and CS analyzed and quantified the data. EH provided the VGLUT1Venus mouse model. FP, HS, and JH interpreted the data. FP, HS, and JH contributed to the conception and design of the study. FP wrote the manuscript and all authors provided critical revisions. All authors approved the final manuscript.
Conflict of interest
F.P. is full‐time employee at Evotec (Hamburg, Germany). H.S. is full‐time employee at Betapharm (Augsburg, Germany), and U.N. is full‐time employee at Novartis Pharma AG (Basel, Switzerland). All other authors declare that they have no conflict of interest.
Supporting information
Appendix
Expanded View Figures PDF
Source Data for Expanded View and Appendix
Review Process File
Source Data for Figure 1
Source Data for Figure 2
Source Data for Figure 3
Source Data for Figure 4
Source Data for Figure 5
Source Data for Figure 6
Acknowledgements
We thank Nadine Lachner for the animal care; Dr. Nils Brose for providing the VGLUT1Venus mouse model; Dr. Severin Filser and Balten Lauströer for scientific support and advice on the manuscript; and Peer Schmitz, Marcel Matt, Michael Schönhardt, Benno Fredmüller, and Katrin Moschke for the technical support. We acknowledge the Munich Cluster for Systems Neurology SyNergy (EXC1010), the ITN Extrabrain (606950), the ITN SynDegen (721802), and the Centers of Excellence in Neurodegeneration (COEN) for funding the project.
The EMBO Journal (2019) 38: e102345
Data availability
Data and explanation supporting the findings of the presented work are available on the article, expanded view figures, appendix, in the source data files, and from the corresponding author upon request.
References
- Burgold S, Filser S, Dorostkar MM, Schmidt B, Herms J (2014) In vivo imaging reveals sigmoidal growth kinetic of β‐amyloid plaques. Acta Neuropathol Commun 2: 1 [DOI] [PMC free article] [PubMed] [Google Scholar]
- Condello C, Yuan P, Schain A, Grutzendler J (2015) Microglia constitute a barrier that prevents neurotoxic protofibrillar Aβ42 hotspots around plaques. Nat Commun 6: 6176 [DOI] [PMC free article] [PubMed] [Google Scholar]
- Conover WJ, Iman RL, Conover W, Iman R (1981) Rank transformations as a bridge between parametric and nonparametric statistics. Available at: https://www.scienceopen.com/document?vid=3898b862-ece7-4ba8-a54f-8a3a7235e13d [Accessed August 23, 2019]
- Dawson HN, Ferreira A, Eyster MV, Ghoshal N, Binder LI, Vitek MP (2001) Inhibition of neuronal maturation in primary hippocampal neurons from tau deficient mice. J Cell Sci 114: 1179–1187 [DOI] [PubMed] [Google Scholar]
- Dawson HN, Cantillana V, Jansen M, Wang H, Vitek MP, Wilcock DM, Lynch JR, Laskowitz DT (2010) Loss of tau elicits axonal degeneration in a mouse model of Alzheimer's disease. Neuroscience 169: 516–531 [DOI] [PMC free article] [PubMed] [Google Scholar]
- De Strooper B (2003) Aph‐1, Pen‐2, and nicastrin with presenilin generate an active gamma‐secretase complex. Neuron 38: 9–12 [DOI] [PubMed] [Google Scholar]
- Deng M, He W, Tan Y, Han H, Hu X, Xia K, Zhang Z, Yan R (2013) Increased expression of reticulon 3 in neurons leads to reduced axonal transport of β Site amyloid precursor protein‐cleaving enzyme 1. J Biol Chem 288: 30236–30245 [DOI] [PMC free article] [PubMed] [Google Scholar]
- Egan MF, Kost J, Tariot PN, Aisen PS, Cummings JL, Vellas B, Sur C, Mukai Y, Voss T, Furtek C et al (2018) Randomized trial of verubecestat for mild‐to‐moderate Alzheimer's disease. N Engl J Med 378: 1691–1703 [DOI] [PMC free article] [PubMed] [Google Scholar]
- Filser S, Ovsepian SV, Masana M, Blazquez‐Llorca L, Brandt Elvang A, Volbracht C, Müller MB, Jung CKE, Herms J (2015) Pharmacological inhibition of BACE1 impairs synaptic plasticity and cognitive functions. Biol Psychiatry 77: 729–739 [DOI] [PubMed] [Google Scholar]
- Fuhrmann M, Mitteregger G, Kretzschmar H, Herms J (2007) Dendritic pathology in prion disease starts at the synaptic spine. J Neurosci 27: 6224–6233 [DOI] [PMC free article] [PubMed] [Google Scholar]
- Fukumoto H, Cheung BS, Hyman BT, Irizarry MC (2002) Beta‐secretase protein and activity are increased in the neocortex in Alzheimer disease. Arch Neurol 59: 1381–1389 [DOI] [PubMed] [Google Scholar]
- Fukumoto H, Rosene DL, Moss MB, Raju S, Hyman BT, Irizarry MC (2004) Beta‐secretase activity increases with aging in human, monkey, and mouse brain. Am J Pathol 164: 719–725 [DOI] [PMC free article] [PubMed] [Google Scholar]
- Goedert M, Wischik CM, Crowther RA, Walker JE, Klug A (1988) Cloning and sequencing of the cDNA encoding a core protein of the paired helical filament of Alzheimer disease: identification as the microtubule‐associated protein tau. Proc Natl Acad Sci USA 85: 4051–4055 [DOI] [PMC free article] [PubMed] [Google Scholar]
- Götz J, Chen F, van Dorpe J, Nitsch RM (2001) Formation of neurofibrillary tangles in P301 l tau transgenic mice induced by Abeta 42 fibrils. Science 293: 1491–1495 [DOI] [PubMed] [Google Scholar]
- Gowrishankar S, Yuan P, Wu Y, Schrag M, Paradise S, Grutzendler J, De Camilli P, Ferguson SM (2015) Massive accumulation of luminal protease‐deficient axonal lysosomes at Alzheimer's disease amyloid plaques. Proc Natl Acad Sci USA 112: E3699–3708 [DOI] [PMC free article] [PubMed] [Google Scholar]
- Harper JD, Lansbury PT (1997) Models of amyloid seeding in Alzheimer's disease and scrapie: mechanistic truths and physiological consequences of the time‐dependent solubility of amyloid proteins. Annu Rev Biochem 66: 385–407 [DOI] [PubMed] [Google Scholar]
- He Z, Guo JL, McBride JD, Narasimhan S, Kim H, Changolkar L, Zhang B, Gathagan RJ, Yue C, Dengler C et al (2018) Amyloid‐β plaques enhance Alzheimer's brain tau‐seeded pathologies by facilitating neuritic plaque tau aggregation. Nat Med 24: 29–38 [DOI] [PMC free article] [PubMed] [Google Scholar]
- Hefendehl JK, Wegenast‐Braun BM, Liebig C, Eicke D, Milford D, Calhoun ME, Kohsaka S, Eichner M, Jucker M (2011) Long‐term in vivo imaging of ‐amyloid plaque appearance and growth in a mouse model of cerebral ‐amyloidosis. J Neurosci 31: 624–629 [DOI] [PMC free article] [PubMed] [Google Scholar]
- Hellstrand E, Boland B, Walsh DM, Linse S (2010) Amyloid β‐protein aggregation produces highly reproducible kinetic data and occurs by a two‐phase process. ACS Chem Neurosci 1: 13–18 [DOI] [PMC free article] [PubMed] [Google Scholar]
- Herzog E, Nadrigny F, Silm K, Biesemann C, Helling I, Bersot T, Steffens H, Schwartzmann R, Nagerl UV, El Mestikawy S et al (2011) In vivo imaging of intersynaptic vesicle exchange using VGLUT1venus knock‐in mice. J Neurosci 31: 15544–15559 [DOI] [PMC free article] [PubMed] [Google Scholar]
- Holsinger RMD, McLean CA, Beyreuther K, Masters CL, Evin G (2002) Increased expression of the amyloid precursor beta‐secretase in Alzheimer's disease. Ann Neurol 51: 783–786 [DOI] [PubMed] [Google Scholar]
- Holtmaat A, Bonhoeffer T, Chow DK, Chuckowree J, De Paola V, Hofer SB, Hübener M, Keck T, Knott G, Lee W‐CA et al (2009) Long‐term, high‐resolution imaging in the mouse neocortex through a chronic cranial window. Nat Protoc 4: 1128–1144 [DOI] [PMC free article] [PubMed] [Google Scholar]
- Hussain I, Powell D, Howlett DR, Tew DG, Meek TD, Chapman C, Gloger IS, Murphy KE, Southan CD, Ryan DM et al (1999) Identification of a novel aspartic protease (Asp 2) as beta‐secretase. Mol Cell Neurosci 14: 419–427 [DOI] [PubMed] [Google Scholar]
- Ittner LM, Ke YD, Delerue F, Bi M, Gladbach A, van Eersel J, Wölfing H, Chieng BC, Christie MJ, Napier IA et al (2010) Dendritic function of tau mediates amyloid‐beta toxicity in Alzheimer's disease mouse models. Cell 142: 387–397 [DOI] [PubMed] [Google Scholar]
- Jackson RJ, Rudinskiy N, Herrmann AG, Croft S, Kim JM, Petrova V, Ramos‐Rodriguez JJ, Pitstick R, Wegmann S, Garcia‐Alloza M et al (2016) Human tau increases amyloid β plaque size but not amyloid β‐mediated synapse loss in a novel mouse model of Alzheimer's disease. Eur J Neurosci 44: 3056–3066 [DOI] [PMC free article] [PubMed] [Google Scholar]
- Jarrett JT, Lansbury PT (1993) Seeding ‘one‐dimensional crystallization’ of amyloid: a pathogenic mechanism in Alzheimer's disease and scrapie? Cell 73: 1055–1058 [DOI] [PubMed] [Google Scholar]
- Kandalepas PC, Sadleir KR, Eimer WA, Zhao J, Nicholson DA, Vassar R (2013) The Alzheimer's β‐secretase BACE1 localizes to normal presynaptic terminals and to dystrophic presynaptic terminals surrounding amyloid plaques. Acta Neuropathol 126: 329–352 [DOI] [PMC free article] [PubMed] [Google Scholar]
- Kang EL, Cameron AN, Piazza F, Walker KR, Tesco G (2010) Ubiquitin regulates GGA3‐mediated degradation of BACE1. J Biol Chem 285: 24108–24119 [DOI] [PMC free article] [PubMed] [Google Scholar]
- King ME, Kan H‐M, Baas PW, Erisir A, Glabe CG, Bloom GS (2006) Tau‐dependent microtubule disassembly initiated by prefibrillar beta‐amyloid. J Cell Biol 175: 541–546 [DOI] [PMC free article] [PubMed] [Google Scholar]
- Kuhn P‐H, Koroniak K, Hogl S, Colombo A, Zeitschel U, Willem M, Volbracht C, Schepers U, Imhof A, Hoffmeister A et al (2012) Secretome protein enrichment identifies physiological BACE1 protease substrates in neurons. EMBO J 31: 3157–3168 [DOI] [PMC free article] [PubMed] [Google Scholar]
- Leroy K, Ando K, Laporte V, Dedecker R, Suain V, Authelet M, Héraud C, Pierrot N, Yilmaz Z, Octave J‐N et al (2012) Lack of tau proteins rescues neuronal cell death and decreases amyloidogenic processing of APP in APP/PS1 mice. Am J Pathol 181: 1928–1940 [DOI] [PubMed] [Google Scholar]
- Lewis J, Dickson DW, Lin WL, Chisholm L, Corral A, Jones G, Yen SH, Sahara N, Skipper L, Yager D et al (2001) Enhanced neurofibrillary degeneration in transgenic mice expressing mutant tau and APP. Science 293: 1487–1491 [DOI] [PubMed] [Google Scholar]
- Li R, Lindholm K, Yang L‐B, Yue X, Citron M, Yan R, Beach T, Sue L, Sabbagh M, Cai H et al (2004) Amyloid beta peptide load is correlated with increased beta‐secretase activity in sporadic Alzheimer's disease patients. Proc Natl Acad Sci USA 101: 3632–3637 [DOI] [PMC free article] [PubMed] [Google Scholar]
- Mandelkow EM, Mandelkow E (1998) Tau in Alzheimer's disease. Trends Cell Biol 8: 425–427 [DOI] [PubMed] [Google Scholar]
- McCarter JF, Liebscher S, Bachhuber T, Abou‐Ajram C, Hübener M, Hyman BT, Haass C, Meyer‐Luehmann M (2013) Clustering of plaques contributes to plaque growth in a mouse model of Alzheimer's disease. Acta Neuropathol 126: 179–188 [DOI] [PMC free article] [PubMed] [Google Scholar]
- Neumann U, Ufer M, Jacobson LH, Rouzade‐Dominguez M‐L, Huledal G, Kolly C, Lüönd RM, Machauer R, Veenstra SJ, Hurth K et al (2018) The BACE‐1 inhibitor CNP520 for prevention trials in Alzheimer's disease. EMBO Mol Med 10: e9316 [DOI] [PMC free article] [PubMed] [Google Scholar]
- Peters F, Salihoglu H, Rodrigues E, Herzog E, Blume T, Filser S, Dorostkar M, Shimshek DR, Brose N, Neumann U et al (2018) BACE1 inhibition more effectively suppresses initiation than progression of β‐amyloid pathology. Acta Neuropathol 135: 695–710 [DOI] [PMC free article] [PubMed] [Google Scholar]
- Radde R, Bolmont T, Kaeser SA, Coomaraswamy J, Lindau D, Stoltze L, Calhoun ME, Jäggi F, Wolburg H, Gengler S et al (2006) Aβ42‐driven cerebral amyloidosis in transgenic mice reveals early and robust pathology. EMBO Rep 7: 940–946 [DOI] [PMC free article] [PubMed] [Google Scholar]
- Rapoport M, Dawson HN, Binder LI, Vitek MP, Ferreira A (2002) Tau is essential to beta ‐amyloid‐induced neurotoxicity. Proc Natl Acad Sci USA 99: 6364–6369 [DOI] [PMC free article] [PubMed] [Google Scholar]
- Roberson ED, Scearce‐Levie K, Palop JJ, Yan F, Cheng IH, Wu T, Gerstein H, Yu G‐Q, Mucke L (2007) Reducing endogenous tau ameliorates amyloid beta‐induced deficits in an Alzheimer's disease mouse model. Science 316: 750–754 [DOI] [PubMed] [Google Scholar]
- Sadleir KR, Eimer WA, Cole SL, Vassar R (2015) Aβ reduction in BACE1 heterozygous null 5XFAD mice is associated with transgenic APP level. Mol Neurodegener 10: 1 [DOI] [PMC free article] [PubMed] [Google Scholar]
- Sadleir KR, Kandalepas PC, Buggia‐Prévot V, Nicholson DA, Thinakaran G, Vassar R (2016) Presynaptic dystrophic neurites surrounding amyloid plaques are sites of microtubule disruption, BACE1 elevation, and increased Aβ generation in Alzheimer's disease. Acta Neuropathol 132: 235–256 [DOI] [PMC free article] [PubMed] [Google Scholar]
- Shoji M, Golde TE, Ghiso J, Cheung TT, Estus S, Shaffer LM, Cai XD, McKay DM, Tintner R, Frangione B (1992) Production of the Alzheimer amyloid beta protein by normal proteolytic processing. Science 258: 126–129 [DOI] [PubMed] [Google Scholar]
- Sinha S, Anderson JP, Barbour R, Basi GS, Caccavello R, Davis D, Doan M, Dovey HF, Frigon N, Hong J et al (1999) Purification and cloning of amyloid precursor protein beta‐secretase from human brain. Nature 402: 537–540 [DOI] [PubMed] [Google Scholar]
- Terry RD (1994) Neuropathological changes in Alzheimer disease. Prog Brain Res 101: 383–390 [DOI] [PubMed] [Google Scholar]
- Tesco G, Koh YH, Kang EL, Cameron AN, Das S, Sena‐Esteves M, Hiltunen M, Yang S‐H, Zhong Z, Shen Y et al (2007) Depletion of GGA3 stabilizes BACE and enhances beta‐secretase activity. Neuron 54: 721–737 [DOI] [PMC free article] [PubMed] [Google Scholar]
- Trojanowski JQ, Lee VM (2000) ‘Fatal attractions’ of proteins. A comprehensive hypothetical mechanism underlying Alzheimer's disease and other neurodegenerative disorders. Ann N Y Acad Sci 924: 62–67 [DOI] [PubMed] [Google Scholar]
- Tyler SJ, Dawbarn D, Wilcock GK, Allen SJ (2002) alpha‐ and beta‐secretase: profound changes in Alzheimer's disease. Biochem Biophys Res Commun 299: 373–376 [DOI] [PubMed] [Google Scholar]
- Vassar R, Bennett BD, Babu‐Khan S, Kahn S, Mendiaz EA, Denis P, Teplow DB, Ross S, Amarante P, Loeloff R et al (1999) Beta‐secretase cleavage of Alzheimer's amyloid precursor protein by the transmembrane aspartic protease BACE. Science 286: 735–741 [DOI] [PubMed] [Google Scholar]
- Vossel KA, Zhang K, Brodbeck J, Daub AC, Sharma P, Finkbeiner S, Cui B, Mucke L (2010) Tau reduction prevents Abeta‐induced defects in axonal transport. Science 330: 198 [DOI] [PMC free article] [PubMed] [Google Scholar]
- Vossel KA, Xu JC, Fomenko V, Miyamoto T, Suberbielle E, Knox JA, Ho K, Kim DH, Yu G‐Q, Mucke L (2015) Tau reduction prevents Aβ‐induced axonal transport deficits by blocking activation of GSK3β. J Cell Biol 209: 419–433 [DOI] [PMC free article] [PubMed] [Google Scholar]
- Wolfe MS, Kopan R (2004) Intramembrane proteolysis: theme and variations. Science 305: 1119–1123 [DOI] [PubMed] [Google Scholar]
- Yan R, Bienkowski MJ, Shuck ME, Miao H, Tory MC, Pauley AM, Brashier JR, Stratman NC, Mathews WR, Buhl AE et al (1999) Membrane‐anchored aspartyl protease with Alzheimer's disease beta‐secretase activity. Nature 402: 533–537 [DOI] [PubMed] [Google Scholar]
- Yang L‐B, Lindholm K, Yan R, Citron M, Xia W, Yang X‐L, Beach T, Sue L, Wong P, Price D et al (2003) Elevated beta‐secretase expression and enzymatic activity detected in sporadic Alzheimer disease. Nat Med 9: 3–4 [DOI] [PubMed] [Google Scholar]
- Zhang X‐M, Cai Y, Xiong K, Cai H, Luo X‐G, Feng J‐C, Clough RW, Struble RG, Patrylo PR, Yan X‐X (2009) Beta‐secretase‐1 elevation in transgenic mouse models of Alzheimer's disease is associated with synaptic/axonal pathology and amyloidogenesis: implications for neuritic plaque development. Eur J Neurosci 30: 2271–2283 [DOI] [PMC free article] [PubMed] [Google Scholar]
- Zhao J, Fu Y, Yasvoina M, Shao P, Hitt B, O'Connor T, Logan S, Maus E, Citron M, Berry R et al (2007) Beta‐site amyloid precursor protein cleaving enzyme 1 levels become elevated in neurons around amyloid plaques: implications for Alzheimer's disease pathogenesis. J Neurosci 27: 3639–3649 [DOI] [PMC free article] [PubMed] [Google Scholar]
Associated Data
This section collects any data citations, data availability statements, or supplementary materials included in this article.
Supplementary Materials
Appendix
Expanded View Figures PDF
Source Data for Expanded View and Appendix
Review Process File
Source Data for Figure 1
Source Data for Figure 2
Source Data for Figure 3
Source Data for Figure 4
Source Data for Figure 5
Source Data for Figure 6
Data Availability Statement
Data and explanation supporting the findings of the presented work are available on the article, expanded view figures, appendix, in the source data files, and from the corresponding author upon request.