

SUMMARY
Glutamine is thought to play an important role in cancer cells by being deaminated via glutaminolysis to α-ketoglutarate (aKG) to fuel the tricarboxylic acid (TCA) cycle. Supporting this notion, aKG supplementation can restore growth/survival of glutamine-deprived cells. However, pancreatic cancers are often poorly vascularized and limited in glutamine supply, in alignment with recent concerns on the significance of glutaminolysis in pancreatic cancer. Here, we show that aKG-mediated rescue of glutamine-deprived pancreatic ductal carcinoma (PDAC) cells requires glutamate ammonia ligase (GLUL), the enzyme responsible for de novo glutamine synthesis. GLUL-deficient PDAC cells are capable of the TCA cycle but defective in aKG-coupled glutamine biosynthesis and subsequent nitrogen anabolic processes. Importantly, GLUL expression is elevated in pancreatic cancer patient samples and in mouse PDAC models. GLUL ablation suppresses the development of KrasG12D-driven murine PDAC. Therefore, GLUL-mediated glutamine biosynthesis couples the TCA cycle with nitrogen anabolism and plays a critical role in PDAC.
In Brief
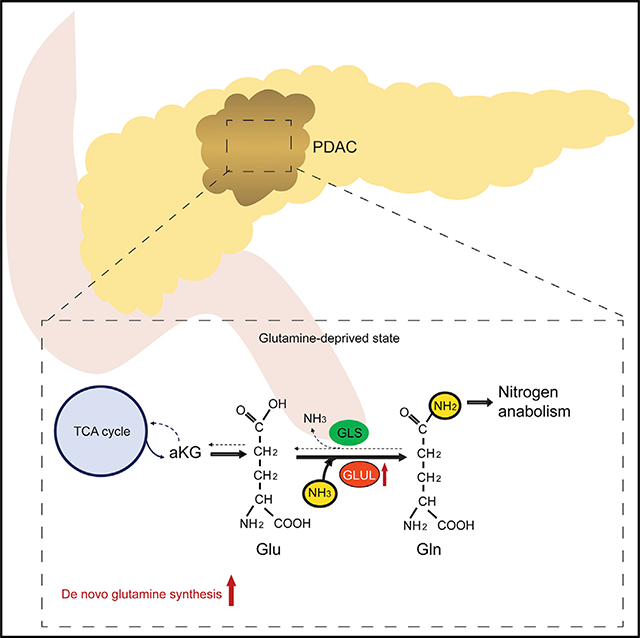
Bott et al. demonstrate that GLUL-mediated glutamine synthesis plays a critical role in converging the TCA cycle and nitrogen metabolism to promote nitrogen-dependent anabolic processes in pancreatic cancer. Ablation of GLUL suppresses PDAC development and may have important clinical implications.
Graphical Abstract
INTRODUCTION
Glutamine is the most abundant free amino acid in the human body (Bergström et al., 1974). Circulating glutamine enters a cell via transporters such as SLC1A5. The “canonical” usage of intracellular glutamine by cancer cells is via glutaminolysis mediated by glutaminases (GLS) to convert glutamine to glutamate, which can be further deaminated by glutamate dehydrogenase (GLUD) or glutamate transaminases to α-ketoglutarate (aKG) that enters the tricarboxylic acid (TCA) cycle for anaplerosis (replenishment of metabolic intermediates for energy production and biosynthesis) (Altman et al., 2016; Dang, 2012; DeBerardinis and Cheng, 2010; Hensley et al., 2013; Wise and Thompson, 2010). Oxidation of aKG in the TCA cycle generates ATP and 4-carbon units. Alternatively, aKG can undergo reductive carboxylation to generate isocitrate and citrate, and eventually 2-carbon units for fatty acid synthesis (Mullen et al., 2011). Cancer cells frequently exhibit an increased dependency on glutamine (Gao et al., 2009; Wise et al., 2008). This has been viewed as the result of a shift in cancer cells from glucose oxidation to aerobic glycolysis, known as the “Warburg effect,” which effectively starvestheTCA cycle of carbón backbones. Inhibition of this anaplerotic usage of glutamine, in particular by targeting GLS, has been actively explored for cancer therapy.
However, the explanation forthis increased glutamine requirement by cancer cells, especially in vivo, has recently become uncertain. In vivo studies indicate that glutamine addiction is more complex than merely serving as an anaplerotic carbon source (Biancur et al., 2017; Davidson et al., 2016). Pancreatic cancers, possibly due to their highly fibrotic and poorly vascularized nature, have been found to be commonly deprived of nutrients including glutamine (Kamphorst et al., 2015). GLS inhibition does not have antitumor effect in vivo in PDAC mouse models (Biancur et al., 2017). On the other hand, glutamine synthesis, but not glutaminolysis and oxidation, was found to be increased in glioblastoma patients and in several mouse tumor models (Davidson et al., 2016; Maher et al., 2012; Marin-Valencia et al., 2012; Mashimo et al., 2014). GLUL, aka glutamine synthetase (GS), the only enzyme identified to be responsible for de novo glutamine biosynthesis by condensing ammonium and glutamate into glutamine, was found to be elevated in a number of cancers (Bott et al., 2015; Cox et al., 2016; Tardito et al., 2015). These studies point to a possible importance of GLUL-mediated glutamine synthesis and its associated nitrogen assimilation and transferto nitrogen-containing macromolecules such as nucleotides and hexosamines in cancers, such as PDAC, where glutamine supply from the circulatory system is limited. In this study, we sought to determine how GLUL and the glutamine synthetic reaction contribute to cancer cell metabolism in the context of glutamine addiction, and how they may impact oncogenesis in vivo, in pancreatic cancers.
RESULTS
GLUL Expression Is Elevated in Human and Mouse Pancreatic Cancers
We first examined the expression of glutamate metabolizing enzymes in human cancers using publicly available databases. GLUL amplification was prevalent across many human cancers, with cancers of the breast, lung, and pancreas amongthose having the highest frequency (Figure 1A). This was consistent with GLUL expression levels detected by immunohistochemistry (IHC) in these tissues in Human Protein Atlas Database (Uhlén et al., 2015; Figure 1B).
Figure 1. GLUL Expression Is Increased in Human Cancers.

(A) cBioPortal shows increased GLUL amplification across human cancers, including that of breast, lung, and pancreas. Cancers with >6% amplification frequency are shown.
(B) Human Protein Atlas shows increased positive GLUL staining in breast, lung, and pancreatic cancers compared with normal tissues.
(C) Oncomine datasets (https://www.oncomine.org) were analyzed for GLUL mRNA expression levels in normal pancreatic tissue and pancreatic cancer. The boxes represent the interquartile range. Whiskers represent the 10th–90th percentile range. Bars represent the median. The p values were calculated by two-sample t test.
(D–G) A total of 178 pancreatic adenocarcinoma (PAAD) samples having both RNA-seq and clinical data were extracted from TCGA GDAC Firehose dataset 2016. R software was used to plot the GLUL expression among different clinical phenotypes. Sub-groups with sample size <5 or clinical information uncertain/unknown were excluded. (D) GLUL expression positively correlates with pathological stages. (E) GLUL expression positively correlates with tumor development based on TNM staging system. T describes the size of the original (primary) tumor and whether it has invaded nearby tissue. N describes nearby (regional) lymph nodes that are involved. M describes distant metastasis. Note that because metastasis data are not available, we cannot evaluate the association between GLUL expression and metastasis status. (F) GLUL expression positively correlates with histological grades. (G) GLUL expression based on the histological types defined by ICD-O-3, International Classification of Disease for Oncology.8140/3: adenocarcinoma, not otherwise specified (NOS); 8246/3: neuroendocrine carcinoma, NOS; 8480/3: mucinous adenocarcinoma; 8500/3: infiltrating duct carcinoma, NOS. Note that neuroendocrine carcinoma shows significantly lower GLUL expression in comparison with other histological types. The bottom and top of the boxes are the 25th and 75th percentile, respectively, and the bands near the middle of the boxes represent the median. The flattened arrows extending out of the box are the minimum and maximum values that do not exceed a certain distance from the interquartile range (IQR) of the data. 1.5 × IQR (the interquartile range) was used by default in R. The p values were calculated by two-tailed t test.
(H) A tissue microarray of human pancreatic cancer sections was stained for GLUL by immunohistochemistry (IHC). The relative intensity of staining in each section was assessed blindly and assigned a value ranging from 0–4 according to the highest level of staining found within the epithelium. The cancer grade is represented by each section regraded. Shown in the graph is the intensity score for each type of tissue in the human tissue microarray.
(I) Representative GLUL staining on WT pancreas (top panel, n = 3) and on tamoxifen-treated LSL-KrasG12D/+; Pdx1-CreER pancreas in invasive PDAC from mice harvested at the endpoint (n = 7).
(J) Representative GLUL IHC staining on WT pancreas (top panel) and on pancreata isolated from an end-stage LSL-KrasG12D/+; Pdx1-Cre mouse (bottom panel, n = 4).
(K) Pancreata were isolated from end-stage LSL-KrasG12D/+; Trp53f/f; Pdx1-Cre mice and age-matched WT littermates, and stained for GLUL by IHC.
(L) Pancreata were isolated from a WT C57BL/6J mouse and an end-stage KPC mouse, and stained for GLUL by IHC. Note that normal islets stain positive for GLUL.
Pancreatic tumors are usually highly fibrotic and poorly vascularized. As a result, they are commonly deprived of nutrients including glutamine (Kamphorst et al., 2015). We thus focused on the glutamine requirement in pancreatic cancers. GLUL was upregulated atthe mRNAlevel in several publicly available pancreatic cancer studies (Figure 1C). We also extracted data from the TCGA GDAC Firehose dataset 2016 with a total of 178 pancreatic adenocarcinoma (PAAD) samples that have both RNA sequencing (RNA-seq) and clinical data. GLUL expression positively correlated with the pathological stage (Figure 1D), TNM staging system (Figure 1E), and histological grades (Figure 1F). It is interesting to note that neuroendocrine carcinoma shows significantly lower GLUL expression compared to other histological types defined by ICD-O-3 (Figure 1G). Consistent with the TCGA dataset, using a tissue microarray (TMA) consisting of 132 human samples ranging from normal tissueto grade 3 pancreatic ductal adenocarcinoma (PDAC), we observed a positive correlation between GLUL expression and human pancreatic cancer progression (Figure 1H). Finally, we also examined GLUL expression in four commonly used genetically engineered mouse models (GEMMs) for pancreatic cancer: (1) tamoxifen-inducible Lox-Stop-Lox (LSL)-KrasG12D/+, Pdx1-CreER (Bardeesy et al., 2006); (2) LSL-KrasG12D/+, Pdx1-Cre (Hingorani et al., 2005); (3) LSL-KrasG12D/+, Trp53flox/flox (f/f), Pdx1-Cre (Bardeesy et al., 2006); and (4) LSL-KrasG12D/+, Trp53R172H/+, Pdx1-Cre (KPC) (Hingorani et al., 2005). In all four models, GLUL expression was markedly increased in late-stage PDAC (Figures 1I–1L). These data indicate that elevated GLUL expression is a common feature in human pancreatic cancers and in KrasG12D-driven PDAC mouse models.
aKG Rescuing Glutamine-Deprived Cells Requires GLUL
We then set out to study the molecular function and physiological relevance of GLUL-mediated glutamine synthesis in PDAC. Tothis end, we generated cancer cell lines derived from both the KPC and LSL-KrasG12D/+; Pdx1-Cre (KC) mice and used CRISPR constructs with three independent single guide RNAs (sgRNAs) to delete GLUL. Single-cell clones were isolated from the knockout populations (Figures 2A and S1A). The clones expressing GLUL that escaped genetic ablation, which were verified to have similar GLUL expression levels and growth properties as the parental cells, were used as GLUL-positive controls (Figures 2A and S1A). In both KC and KPC cells, GLUL ablation did not lead to a significant alteration of cell proliferation (Figures 2B and S1B).
Figure 2. GLUL Is Required for aKG Rescue of the Cells under Glutamine Limitation.

(A) KPC cells were transfected with a plasmid containing Cas9 and three independent sgRNAs targeting mouse GLUL. Single-cell clones were isolated via limited dilution and screened for expression of GLUL via immunoblotting. Clone 17, which had similar GLUL expression level as the parental cells, was used as a GLUL-proficient line, and clone 15 was used as a GLUL-deficient line in following studies.
(B) Cells were cultured under glutamine-containing full medium. Cell growth/proliferation was determined by counting cells with a hemocytometer. Shown is the mean of a representative experiment performed in triplicates plus SD.
(C) Cells were cultured under indicated conditions (+Q: full medium containing glutamine; −Q: glutamine-free medium; −Q + dmKG: glutamine-free with 6 mM dmKG) for 72 h. Images were captured using a Keyence BX-Z microscope.
(D) Cells were cultured under indicated conditions for 72 h. Cell confluence was determined via Sartorius IncuCyte.
(E) Cells were cultured under indicated conditions for 72 h. Relative cell growth was determined by the optical density (OD) of crystal violet staining and normalized to that of the initial cell density (red line). Shown is the mean of a representative experiment performed in triplicate plus SD. ***p < 0.001.
(F) Indicated cell clones were cultured under various conditions. Cells were stained by crystal violet and photographed. Relative growth was determined by the OD of crystal violet staining and normalized to that of the initial cell density (red dashed line). Shown is the mean of a representative experiment performed in triplicate plus SD. ***p < 0.001.
(G–I) Flag-GLUL was reconstituted in GLUL-deficient KPC cell line (clone 15) (G). Cells were cultured under indicated conditions for 72 h. Relative growth (H) and cell death by propidium iodide (PI) staining (I) were measured by Celigo cell imager. Shown is the mean of a representative experiment performed in triplicate plus SD. ****p < 0.0001.
(J–L) L3.6 human PDAC cell line was lentivirally infected by sgGLUL, representative GLUL-proficient and -deficient clones are shown. S2–103 human PDAC cell line was lentivirally infected by scramble (Scrbl) or shGLUL (J), or treated with MSO (K). MiaPaCa-2 human PDAC cell line stably expressing GLUL was established (L). Cells were cultured under indicated conditions for 72 h, and relative growth was determined by crystal violet staining normalized to that of the initial cell density (red line). Shown is the mean of a representative experiment performed in triplicate plus SD. ***p < 0.001.
The dependence of many cancer cells on glutamine, including PDAC cells, has been largely attributed to the increased demand for glutamine as an anaplerotic carbon source for the TCA cycle via glutaminolysis. This notion is supported by the observation that the cell permeable form of aKG, dimethyl-aKG (dmKG), rescues cells from glutamine deprivation, including PDAC cells (Son et al., 2013). In our hands, KPC and KC cells were sensitive to glutamine deprivation (Figures 2C, 2D, S1C, and S1D), which was partially rescued by dmKG and was further rescued by the combination of dmKG and nonessential amino acids (NEAA) (a condition we termed dmKGN) (Figures 2C, 2D, S1C, and S1D) or by the combination of dmKG and ammonium chloride (Figure 2E). Strikingly, the dmKG rescue, even in the presence of NEAA, was completely abolished when GLUL was genetically silenced (Figures 2C, 2D, S1C, and S1D) or pharmacologically inhibited by the GLUL-specific inhibitor methionine sulfoximine (MSO) (Tardito et al., 2015; Figures 2F and S1E). Reconstitution of Flag-tagged GLUL in GLUL-deficient KPC and KC cells rescued cell growth/viability under the dmKGN condition (Figures 2G–2I and S1F–S1H). Similar to the KPC and KC murine PDAC cells, silencing GLUL in human PDAC cell lines L3.6 with sgRNA or S2–013 with short hairpin RNA (shRNA), or inhibiting GLUL in these cells with MSO, also abolished dmKGN rescue (Figures 2J and 2K). Conversely, ectopic expression of GLUL in MiaPaCa-2 cells, which displayed low endogenous GLUL expression, conferred dmKGN rescue upon glutamine-deprivation (Figure 2L). Taken together, these data indicate that providing cells with dmKG, the carbon backbone of glutamine, and a nitrogen source is sufficient to restore growth in the absence of glutamine. Intriguingly, GLUL is required for the growth restoration, supporting the hypothesis that the glutamine synthetic pathway, functioning independently of fueling the TCA cycle, is important for the rescue of cells by the dmKGN condition.
To further demonstrate that it is glutamine synthesis, but not the TCA usage of glutamine, that plays a critical role in dmKGN rescue of glutamine deprivation, we used the GLS-specific inhibitor BPTES to inhibit glutaminolysis. BPTES did not inhibit the dmKGN rescue (Figures S2A and S2B). 6-Diazo-5-oxo-L-norleucine (L-DON), a promiscuous inhibitor of a wide spectrum of transaminases hence many glutamine usage pathways including nucleotide and hexosamine biosynthesis, inhibited dmKGN rescue (Figures S2A and S2B).
aKG is an important metabolite that is at the converging point of the TCA cycle and glutaminolysis. In addition, aKG is coupled with several nitrogen scavenging reactions that might be occurring upstream of glutamine synthesis, including those mediated by glutamate-oxaloacetate transaminase (GOT), glutamatepyruvate transaminase (GPT), phosphoserine transaminase (PSAT), and glutamate dehydrogenase (GLUD), to convert aKG to glutamate as the substrate for GLUL. To test which glutamate generation mechanism is critical for dmKGN rescue, cells were cultured with dmKGN and treated with various inhibitors of glutamate producing enzymes: the GOT inhibitor aminooxyacetic acid (AOA), the GPT inhibitors cycloserine and β-chloro-L-alanine, and the GLUD inhibitor epigallocatechin gallate (EGCG). AOA, cycloserine, and β-chloro-L-alanine each caused a modest reduction in growth while EGCG had no observable effect (Figures S2C and S2D). These data suggest that under glutamine-starvation condition, cells may be capable of scavenging nitrogen from multiple sources such as alanine and aspartate to transaminate aKG to produce glutamate as a substrate for glutamine synthesis.
aKG Is Coupled with Nitrogen Assimilation and Anabolism in a GLUL-Dependent Manner
aKG is a pleiotropic molecule that serves as a metabolite and as a co-factor for numerous enzymes. As a metabolite, aKG can be converted to succinate by the oxoglutarate dehydrogenase (OGDH) complex, to citrate via reductive carboxylation by isocitrate dehydrogenase 2 (IDH2), and to glutamate via transamination or GLUD-mediated amination of its alpha carbon (Figure 3A). As dmKG could rescue GLUL-proficient but not GLUL-deficient cells from glutamine deprivation, we determined whether aKG is being used to produce glutamine in GLUL-proficient cells, and whether the TCA cycle usage of aKG are affected by GLUL. To address this, we chemically modified the isotope tracer of 13C5-aKG to the cell-permeable dimethyl form (Figures 3B and S3A), which was not commercially available, and determined whether 13C5-dmKG would contribute to the three metabolic fates: to succinate via oxidation, to citrate/isocitrate via reductive carboxylation, and to glutamate then glutamine (Figure 3C). In both GLUL-proficient and -deficient cells, culturing with 13C5-dmKG in glutamine-free medium resulted in similar 13C labeling of aKG, glutamate, succinate, fumarate, malate, and citrate (Figure 3C), which was accompanied by similar oxygen consumption and ATP production in both GLUL-proficient and -deficient cells cultured in glutamine-free medium supplemented with dmKG (Figure 3D). Similarly, labeling of aspartate, which contributes carbons to nucleotide synthesis, was similar between GLUL-proficient and -deficient cells (Figure 3C). These results indicate that GLUL-deficient cells are fully competent for the TCA cycle. Importantly, in addition to the anaplerotic TCA usage, aKG was being converted to glutamate in both GLUL-proficient and -deficient cells, however, the conversion to glutamine was only observed in GLUL-proficient cells (Figure 3C).
Figure 3. GLUL Is Essential for Cataplerotic Nitrogen Transfer but Not Anaplerotic Usage of aKG.

(A) Schematic of proximal labeling patterns from 13C-aKG indicating the metabolic fates for aKG catalyzed by respective enzymes.
(B) Chemical reaction was performed to modify 13C5-aKG to cell permeable 13C5-dmKG. *C = 13C.
(C) GLUL-proficient and -deficient KPC cells were cultured in glutamine-free medium supplemented with 1.5 mM 13C-dmKG for 24 h. Polar metabolites were extracted and subjected to liquid chromatography-mass spectrometry (LC-MS). Total labeling of indicated metabolite is shown. Shown is the mean of a representative experiment performed in triplicate plus SD. ***p < 0.001.
(D) Basal OCR and ATP production of GLUL-proficient and -deficient cells after 1 h treatment in DMEM (+Q), DMEM no glutamine (−Q) or DMEM no glutamine supplemented with a-ketoglutarate (−Q+dmKG).
(E) Schematic of labeling patterns from 15N-NH4Cl.
(F) GLUL-proficient and -deficient KPC cells were cultured in glutamine-free medium supplemented with 6 mM dmKG and 1 mM 15N-NH4Cl for 24 h. Polar metabolites were extracted and subjected to LC-MS. Total labeling of indicated metabolite is shown as means of a representative experiment performed in triplicate plus SD. **p < 0.01; ***p < 0.001.
Consistently, unlike the GLUL-deficient cells that could not be rescued from glutamine deprivation by dmKGN, silencing an OGDH component dihydrolipoamide S-succinyltransferase (DLST), which is essential for the aKG to succinate conversion, and IDH2, which is responsible for reductive carboxylation of aKG to citrate, did not affect the ability of dmKGN to rescue cells from glutamine deprivation (Figure S3B). Similarly, TCA cycle and reductive carboxylation were unchanged in the human PDAC cell lines L3.6 with sgGLUL silencing, BxPC3 with MSO treatment, and MiaPaCa-2 with GLUL overexpression (Figures S3C and S4). The majority of labeled glutamine was m+5 in all tested GLUL-proficient cell lines (Figure S4), indicating a direct conversion of aKG to glutamate then glutamine. These data indicate that while aKG can be used for both TCA cycle anaplerosis and as a direct substrate for glutamate then glutamine synthesis, the latter, which is mediated by GLUL, plays an essential role in rescuing cell proliferation in glutamine-deprived conditions.
GLUL assimilates ammonia by adding the amide group to the terminal carbon in glutamate, which can be traced by culturing cells in the presence of 15N-NH4Cl. This terminal amide can be further traced to determine the contribution of GLUL-mediated ammonia assimilation and nitrogen transfer into other nitrogen-containing molecules (Figure 3E). In the presence of excess unlabeled glutamine, the fraction of 15N-labeled glutamine was barely detectable in both KPC and KC PDAC cells (Figures S5A and S5B), indicating that they do not engage in glutamine synthesis when glutamine can be acquired from the environment. However, upon glutamine deprivation, GLUL-proficient cells were able to utilize 15N-NH4Cl to synthesize glutamine de novo, and this fraction was significantly increased upon addition of dmKG (Figures 3F, S5A, and S5B). These data suggest that upon glutamine deprivation, carbon sources for de novo glutamine synthesis might be required to generate glutamine for various metabolic processes. In this regard, we examined metabolites that can be synthesized using the amide nitrogen from glutamine including nucleotides and hexosamine. Indeed, significant increases in fractional labeling in nucleotides and UDP-GlcNAc were observed upon the addition of dmKG in the GLUL-proficient cells (Figure 3F). Glutamine-specific isotopic labeling, such as m+3 labeled AMP/ADP/ATP, was observed only in the GLUL-proficient cells, but not in GLUL-deficient cells (Figures S5A and S5B). UDP-glucose isotopologues (m+1 and m+2) indicate that the uridine component was labeled at both nitrogens, which was consistent with the UTP result (Figures S5A and S5B). UDP-GlcNAc showed a specific labeling of m+3 in the GLUL-proficient but not-deficient cells, indicating that the m+3 fraction is derived from GLUL-mediated synthesis of glutamine (Figures S5A and S5B). In contrast, the fraction of 15N-labeled aspartate, which is produced by the transamination of the alpha amino group of glutamate, did not vary between GLUL-proficient and -deficient cells (Figure 3F). These results indicate that GLUL-mediated de novo synthesis of glutamine plays an essential role in transferring the terminal amide nitrogen to nucleotides and hexosamines, which correlates with the GLUL-dependent survival/growth in glutamine-deprived cells. We had been unable to rescue cell growth of glutamine-deprived GLUL-deficient cells using nucleotides and UDP-GlcNAc, likely owing to the pleiotropic effects of glutamine. Nonetheless, consistence with the importance of O-glycosylation, the O-GlcNAc transferase (OGT) inhibitor OSMI-1 inhibited cell growth and the dmKGN-rescue in GLUL-proficient cells (Figures S5C and S5D). Taken together, these findings demonstrate the importance of glutamine anabolism in promoting de novo nucleotide and hexosamine biosynthesis, which conceivably plays a critical role in cell growth under glutamine starvation.
Genetic Ablation of GLUL Suppresses PDAC
Our cell culture study indicates that GLUL expression is critical for cell growth/proliferation under glutamine-limited conditions. The pancreatic tumor environment is low in glutamine (Kamphorst et al., 2015), and GLUL is highly expressed in PDAC (Figure 1). Hence, we next sought to determine the in vivo role of GLUL using the PDAC mouse models. Because we observed increased GLUL expression in all four genetically engineered PDAC mouse models (Figures 1E–1H), we examined the LSL-KrasG12D/+;Trp53f/f;Pdx1-Cre model bred to mice with floxed GLUL alleles (He et al., 2010). GLUL ablation significantly delayed tumor development: 3-week-old GLUL+/+ animals showed substantial PDAC lesions but no detectable lesions were found in the GLULf/f animals (Figures 4A and 4B). GLUL+/+ mice developed several foci of invasive PDAC (Figure 4A, top left panel), which showed infiltrative and haphazard glands, high nuclearcytoplasm ratio, single cells, and a desmoplastic reaction (Figure 4A, top middle panel). However, the GLULf/f mice showed mostly normal pancreatic parenchyma, no invasive carcinoma, and only occasional foci of high-grade pancreatic intraepithelial neoplasia (PanIN) (Figure 4A, bottom left panel), which exhibited loss of nuclear polarity, marked nuclear pleomorphism, prominent nucleoli, cribriform architecture, and frequent mitosis (Figure 4A, bottom middle panel), but no invasive foci. IHC confirmed the presence of GLUL protein in the GLUL+/+ but not in GLULf/f ductal epithelia, with a low expression apparent in stromal cells (Figure 4A, right panels). GLULf/f mice showed significantly increased median survival (GLUL+/+: 33 d, GLULf/f: 67 d, Figure 4C). Consistent with the cell culture results showing defective nucleotide and hexosamine synthesis (Figures 3 and S5), GLUL knockout (KO) pancreata had markedly lower proliferation index as indicated by PCNA staining (Figure 4D) and O-glycosylation (Figure 4E). Interestingly, in the KO mice that still succumbed to PDAC development and death, the stromal areas (positive for Sirius Red staining) showed high GLUL expression (Figure S6), consistent with the observations in other cancer types that the stroma may supply tumor cells’ glutamine needs (Yan et al., 2018; Yang et al., 2016).
Figure 4. Ablation of GLUL Suppresses PDAC Development in KPC Mice.

(A) GLULf/f mice was bred to LSL-KrasG12D/+;Trp53f/f;Pdx1-Cre mice. H&E and GLUL IHC staining were performed on 3-week-old GLUL+/+ and GLULf/f mice. The middle panels are zoom-in photomicrographs of the boxed areas in the left panels.
(B) The number and size of ductal carcinoma foci (n = 3 for each genotype) were scored blindly and plotted. ***p < 0.001.
(C) Kaplan-Meier plot comparing GLUL+/+, GLULf/+, and GLULf/f mice in the LSL-KrasG12D/+; Trp53f/f; Pdx1-Cre background.
(D and E) Representative PCNA IHC staining (D) and O-GlcNAc staining (E) of the pancreas on 3-week-old GLUL WT and GLUL knockout (KO) mice. The right panels are zoom-in photomicrographs of the boxed areas showing more PCNA-positive or O-GlcNAc-positive cells in the WT pancreas. ImageJ was used and images were subjected to color deconvolution to remove hematoxylin counterstaining while PCNA or O-GlcNAc staining remained for further quantification. Intensity of PCNA or O-GlcNAc staining in randomly selected areas were quantified. The p value was calculated by two-tailed-t test.
(F and G) GLUL WT or KO LSL-KrasG12D/+;Trp53f/f;Pdx1-Cre mice had catheters implanted surgically into jugular veins. Stable isotope tracer 15N-NH4Cl was infused. Animals were sacrificed and organs were rapidly collected for metabolomics. (F) Total counts of 15N1-glutamine (M+0.997) is shown from pancreas and kidney. (G) Decreased m+1 Gln/m+0 Glu and m+2 Gln/m+1 Glu ratios indicate defective GLUL function in the KO pancreata.
(H) Both labeled and total UDP-GlcNAc are trending to be decreased in KO pancreata, indicating defective hexsosamine synthesis.
(I) Ex vivo 13C5-dmKG labeling were performed using WT and KO pancreata. The tumor-laden pancreas was roughly divided into multiple pieces then cultured in glutamine free DMEM supplemented with 10% dialyzed FBS and 1.5 mM 13C5-dmKG in the presence or absence of MSO (100 μM)for 1 h. Tissues were harvested and subjected to LC-MS. Note the decreased ratio of m+5 labeled glutamine to m+5 labeled glutamate and a reciprocal increased ratio of m+5 glutamate to aKG in the KO or MSO-treat WT tissues, indicating defective conversion of Glu to Gln. Each dot represents a piece of tissue (n = 3 mice in each group), bar shows mean ± SD.
To determine whether active glutamine synthesis occurs in PDAC in vivo, we performed jugular vein infusion of 15N-NH4Cl in GLUL wild-type (WT) and KO mice. We observed a significant decrease in the amount of m+0.997 (15N1)-labeled glutamine in the KO pancreas, but not in the kidney of paired animals (Figure 4F). The ratio of m+1 glutamine versus m+0 glutamate and that of m+2 glutamine versus m+1 glutamate, both indicative of GLUL-mediated conversion of glutamate to glutamine, were lower in the KO mice (Figure 4G). Consistent with the result observed in cultured cells (Figure 3F) and in vivo (Figure 4E), GLUL-dependent nitrogen transfer from 15N-NH4Cl to UDP-GlcNAc was also reduced in GLUL-KO PDAC (Figure 4H). To unequivocally show that the conversion of aKG to glutamate then glutamine occurs in PDAC, we attempted to perform in vivo tracing with 13C5-dmKG, yet found that the in vivo labeling of 13C5-dmKG via jugular vein infusion was extremely inefficient. Hence, instead, we performed ex vivo 13C5-dmKG tracing using tissue sections of tumor-laden pancreata isolated from GLUL WT and KO mice. Indeed, a lower ratio of m+5 glutamine versus m+5 glutamate and a reciprocal higher ratio of m+5 glutamate versus m+5 aKG were observed in the KO pancreata and in MSO-treated WT pancreata than in untreated WT pancreata (Figure 4I), indicating a blockade of glutamate to glutamine conversion when GLUL was inhibited genetically or pharmacologically.
Cell Autonomous Inhibition of GLUL Leads to Decreased Tumor Growth
Because the above mouse PDAC model showed increased GLUL expression in the stroma, we went on to further address the cell autonomous effect of GLUL ablation in PDAC. To this end, we silenced GLUL in KPC organoids in culture and then orthotopically implanted them into the pancreas of immunocompromised nude mice. We also used a syngeneic orthotopic model in which GLUL was silenced in the KC PDAC cells in culture and then orthotopically injected into the pancreas of immunocompetent C57BL6/J mice. While silencing GLUL in KPC organoids and in the KC cell culture did not alter their growth in vitro in glutamine replete conditions (Figures 5A and S1B), tumor development was significantly delayed in both models with GLUL downregulation (Figures 5B–5E), supporting an essential role of GLUL in PDAC cell growth in a cell autonomous fashion in vivo.
Figure 5. Inhibition of GLUL Decreased Tumor Growth.

(A) In vitro proliferation of KPC tumor cell organoids, in which GLUL inactivation through CRISPR-Cas9 gene editing was determined by immunoblotting, was measured by CellTiter-Glo. Relative growth was determined by normalizing the reading of cells plated at time 0. Shown is the mean plus SEM of 5 replicates.
(B) Bright-field/GFP images and tumor weights of tumors from nude mice orthotopically transplanted with the KPC organoids. Each dot represents one mouse.
(C) KC cells (5 million) stably expressing luciferase and lentiviral sgGLUL(GLUL-proficient, clone 3 or GLUL-deficient, clone 4) were implanted in the head of the pancreas of C57BL/6 mice. Tumor growth was monitored by IVIS imaging of the luciferase signal on weeks 1 and 2 after implantation. Representative images of 2 mice in each group are shown.
(D) Quantification of luciferase signals from each mouse. Each dot represents one mouse. The bars indicate the median. **p < 0.01.
(E) Kaplan-Meier survival curves for the mice implanted with the indicated cell lines. Median survival: GLUL-proficient (clone 3), 29 days (n = 8); GLUL-deficient (clone 4), 56 days (n = 7). p = 0.002 (log-rank test).
DISCUSSION
Glutamine is a multifunctional amino acid. In addition to its familiar role as a constituent of proteins, glutamine is an anaplerotic substrate for the TCA cycle, contributing its carbon backbone particularly in conditions of carbon diversion to glycolytic pathways. However, glutamine is also the obligatory nitrogen donor for the biosynthesis of purines, pyrimidines, NAD, asparagine, and hexosamines via its terminal amide group. Glutamine also drives the uptake of essential amino acids, activates mTOR, helps recycle excessive ammonia and glutamate, and regulates redox homeostasis (Altman et al., 2016; Cluntun et al., 2017; De Vitto et al., 2016). These high and diverse demands for glutamine cannot be met from steady-state endogenous production, which occurs mainly in the muscle, or solely from regular organismal dietary protein digestion, as is the case for many other amino acids. Addditionally, glutamine demand cannot be satisfied by macropinocytosis and/or autophagic digestion at the cellular level. As a result, many tissues upregulate GLUL to increase glutamine synthesis, particularly at times of enhanced metabolic need, increased growth or stress, such as pathogen infection. It is conceivable that this situation is exacerbated in tumor cells because of their high proliferation rate and often poor vascularization, therefore limiting access to circulating glutamine.
In this study, we report that GLUL is essential for cancer cell proliferation under glutamine limitation allowing cells to utilize other components such as aKG and ammonium to synthesize glutamine to support proliferation. The use of aKG in a non-TCA cycle manner has been appreciated in the context of it functioning as a co-factor for dioxygenases to regulate the epigenetic state (Carey et al., 2015) orto respond to DNA damage (Tran et al., 2017). Here, we show, by tracing 13C-dmKG, that aKG can be used to synthesize glutamine under the condition of metabolic stress, in addition to fueling the TCA cycle. These data indicate that glutamine addiction is more complex than merely serving as an anaplerotic carbon source for energy and biosynthetic demands of a proliferating cell, especially in the tumor microenvironment where vastly different metabolic co-dependencies occur compared with in vitro conditions (Biancur et al., 2017; Davidson et al., 2016). Our results are consistent with the findings that tumor cells, including PDAC cells, often have increased dependence on aspartate and alanine as well as their transaminases GOT and GPT. GOT and GPT can convert aspartate and alanine to oxaloacetate and pyruvate to provide carbon source for the TCA cycle and nucleotide synthesis, as well as to facilitate mitochondrial electron transport and maintaining redox homeostasis (Son et al., 2013; Sousa et al., 2016; Tajan et al., 2018). These reactions are coupled with the conversion of aKG to glutamate. aKG is also used by GLUD to assimilate ammonia as an intracellular metabolic waste product to generate glutamate (Spinelli et al., 2017). Several sources including glucose, lactate, and branched chain amino acids can supply TCA cycle carbons to replenish aKG (Hui et al., 2017; Jones et al., 2018; Neinast et al., 2019). Therefore, in addition to its critical roles as a TCA cycle metabolite and an enzymatic cofactor, aKG can serve as a central nitrogen receptor via the transamination and ammonia assimilation reactions to generate glutamate, one of whose metabolic fates is to be converted to glutamine by GLUL. It remains to be determined whether specific transaminases play a more predominant role in aKG-glutamate conversion in the context of glutamine biosynthesis. Nonetheless, our study indicates that GLUL-mediated glutamine synthesis on one hand facilitates ammonium assimilation and transamination reactions that are coupled with the TCA cycle, and on the other hand plays an essential role in glutamine-dependent nitrogen anabolism. While we cannot completely rule out the contribution of GLUL’s other enzymatic activities independent of glutamine synthesis (Eelen et al., 2018), our data demonstrate that GLUL-mediated glutamine anabolism plays a critical role in the biosynthesis of nucleotides and hexosamines and subsequent cell growth and proliferation.
It is important to note that GLUL expression is consistently elevated in human pancreatic cancer and in several PDAC mouse models (Figure 1). Whilethisincreased GLUL expression may be an adaptive response to the scarcity of nutrients especially glutamine itself, the underlying mechanisms remain to be determined. Several possibilities exist including gene amplification, transcriptional upregulation, and increased protein stability. An interesting possibility is that GLUL upregulation occurs through increased c-Myc activity and epigenetic regulation that are largely associated with PDAC development and aKG metabolism (Bott et al., 2015). Importantly, unlike GLS, whose ablation does not have an overt effect on PDAC development in vivo (Biancur et al., 2017), GLUL germline ablation leads to a significant delay in disease progression (Figures 4A–4C), which is accompanied by decreased O-glycosylation and cell proliferation (Figures 4D and 4E). Cancer cell autonomous inhibition of GLUL by CRISPR/Cas9 significantly decreased tumor growth (Figure 5), at least in the murine models. These data suggest that targeting the glutamine-nitrogen assimilation axis in tumor cells may be an ample approach to therapy. The incomplete inhibition of tumorigenesis in our studies is likely a result of the induction of GLUL expression in the stroma, thus increasing local supply of glutamine. Therefore, it may be important to concurrently target both tumor and stromal cells when considering developing GLUL inhibition as a therapeutic approach.
STAR⋆METHODS
LEAD CONTACT AND MATERIALS AVAILABILITY
Further information and requests for resources and reagents should be directed to and will be fulfilled by the Lead Contact, Wei-Xing Zong (zongwx@rutgers.edu).
Materials Availability Statement
13C5-dmKG generated in this study will be made available on request but we may require a payment and/or a completed Materials Transfer Agreement if there is potential for commercial application. Requests of the GLULf/f mouse line will be directed to its original source. All the rest reagents generated in the study will be made available upon requests. All materials are described in the KEY RESOURCES TABLE. Further information and requests for resources and reagents should be directed to and will be fulfilled by the Lead Contact, Wei-Xing Zong (zongwx@rutgers.edu)
KEY RESOURCES TABLE.
| REAGENT or RESOURCE | SOURCE | IDENTIFIER |
|---|---|---|
| Antibodies | ||
| GLUL, rabbit polyclonal | Sigma | Cat # G2781; RRID:AB_259853 |
| GLUL, rabbit polyclonal | Abcam | Cat #Ab73593; RRID:AB_2247588 |
| GLUL, mouse monoclonal | BD | Cat #610517 |
| β-tubulin, mouse monoclonal | Sigma | Cat #T9026; RRID:AB_477593 |
| Hsp90, rabbit polyclonal | Millipore | Cat #07–2174; RRID:AB_10807022 |
| GAPDH, mouse monoclonal | Cell Signaling | Cat #97166; RRID:AB_2756824 |
| DLST, rabbit polyclonal | Abnova | Cat #H00001743-D01; RRID:AB_10720339 |
| PCNA, rabbit monoclonal | Cell Signaling | Cat #13110; RRID:AB_2636979 |
| O-GlcNAc, mouse monoclonal | Cell Signaling | Cat #9875; RRID:AB_10950973 |
| Bacterial and Virus Strains | ||
| pLKO.1 | Addgene | 8453 |
| pLenti-sgRNA-EFS-Neo-IRES-GFP | Roe et al., 2017 | N/A |
| pLenti-Cas9-Puro | Addgene | 108100 |
| Biological Samples | ||
| Pancreatic cancer tissue microarray (de-identified) | Laboratory of Howard Crawford, University of Michigan | N/A |
| Chemicals, Peptides, and Recombinant Proteins | ||
| L-methionine sulfoximine (MSO) | Sigma | M5379 |
| 6-diazo-5-oxo-L-norleucine (L-DON) | Sigma | D2141 |
| BPTES | Sigma | SML0601 |
| Cycloserine | Sigma | C1159 |
| Direct Red 80 | Sigma | 365548 |
| Picric acid | Sigma | 197378 |
| OSMI-1 | Sigma | SML1621 |
| Aminooxyacetic acid (AOA) | Sigma | C13408 |
| Epigallocatechin gallate (EGCG) | Hara Office Inc | N/A |
| μ-chloro-L-alanine | Santa Cruz Biotechnology | sc-291972 |
| 15N-NH4Cl | Cambridge Isotope Laboratories | NLM-467-PK |
| 13C5-aKG | Cambridge Isotope Laboratories | CLM-2411-PK |
| 13C5-dmKG | This paper | N/A |
| Experimental Models: Cell Lines | ||
| FC1245 (KPC) pancreatic cancer cell line | Roy et al., 2015 | N/A |
| UN-KC-6141 (KC) pancreatic cancer cell line | Torres et al., 2013 | N/A |
| S2–013 | Thermo-Fisher | CVCL-B280 |
| MIA PaCa-2 | ATCC | CRL-1420 |
| L3.6 | Bruns et al., 1999 | N/A |
| Experimental Models: Organisms/Strains | ||
| Mouse LSL-KrasG12D, mixed 129sv/C57B6 | Jackson et al., 2001 | N/A |
| Mouse LSL-KrasG12D;p53f/f, mixed 129sv/C57B6 | Jackson et al., 2001 | N/A |
| Mouse Pdx1-Cre, mixed FVB/C57B6 | Jackson Laboratory | 014647 |
| Mouse GLULf/f (mixed 129/Ola and C57BL/6) | He et al., 2010 | N/A |
| Mouse C57Bl6.J | Jackson Laboratory | 000664 |
| Mouse Crl:NU-Foxn1nu | Charles River | 088 |
| Oligonucleotides | ||
| Mouse shDLST#1: TGTCTCATAGCCTCGAATATC | This paper | N/A |
| Mouse shDLST#2: CGAAAGAATGAACTTGCCATT | This paper | N/A |
| Control sgRNA: sgRosa26: GAAGATGGGCGGGAGTCTTC | This paper | N/A |
| Mouse sgGLUL#1: TGGGATCGTAGGCGCGAATG | This paper | N/A |
| Mouse sgGLUL#2 CATTCGCGCCTACGATCCCA | This paper | N/A |
| Mouse GLUL sgRNA mixture | Santa Cruz | sc-420579 |
| Human sgGLUL: GCGCTGCAAGACCCGGACCC | This paper | N/A |
| Mouse GLUL shRNA #1 | Sigma | NM_008131, #1: TRCN0000309816 |
| Mouse GLUL shRNA #2 | Sigma | NM_008131, #1: TRCN0000309745 |
| Recombinant DNA | ||
| LPC-FLAG-GLUL (human) | This paper | N/A |
| Software and Algorithms | ||
| MAVEN | Melamud et al., 2010 | N/A |
| AccuCor | Su et al., 2017 | N/A |
EXPERIMENTAL MODEL AND SUBJECT DETAILS
Animal strain, age, sex, and number
For the spontaneous PDAC models, we used LoxP-Stop-LoxP (LSL)-KrasG12D (Jackson et al., 2001) (mixed 129sv/C57B6); LSL-KrasG12D;p53f/f (Jackson et al., 2001); Pdx1-Cre (mixed FVB/C57B6); GLULf/f (mixed 129/Ola and C57BL/6) (He et al., 2010). For the orthotopic tumor models, C57BL/6J mice were used. For the in vivo organoid models, Nu/Nu mice were used. Mouse experiments were performed at the age of 6–8 weeks unless specified otherwise.
Spontaneous tumor models
Both male and female mice were used. Backcross were carried out to reach a mixed background, and gender and age-matched littermate animals were used for experiments. Crossing were carried out to obtain the proper controls and to meet statistical requirement, and to minimize the number of animals needed to obtain the experimental conditions. To develop spontaneous pancreatic GLUL−/−, KrasG12D/+, p53−/− mouse model, we crossed LSL-KrasG12D/+ mice with p53f/f mice to generate LSL-KrasG12D/+;p53f/f mice. These mice were further crossed with GLULf/f mouse to generate GLULf/+;LSL-KrasG12D/+; p53f/f mice. Simultaneously, we crossed GSf/f mice with Pdx1-Creto generate Pdx1-Cre;GLULf/+ mice. The resultant progeny triple transgenic animals (GLULf/+;LSL-KrasG12D/+;p53f/f) were crossed with double transgenic Pdx1-Cre (or Pdx1-CreER);GLULf/+ mice to generate KPG (GLULf/f;LSL-KrasG12D/+;p53f/f;Pdx1-Cre mice and their contemporary littermate controls.
Cell culture
The FC1245 cells(KrasG12D/+;Trp53R172H/+;Pdx1-Cre mouse pancreatic cancer cell line) (Roy et al., 2015) werenamed KPC cells. The UN-KC-6141 cell line (KrasG12D mouse pancreatic cancer cell line, named KC) was a kind gift from Dr. Surinder Batra (University of Nebraska Medical Center). KC cells were infected with a lentiviral vector encoding firefly luciferase under CMV promoter control (Cellomics Technology). S2–013, MiaPaCa-2, and L3.6 human PDAC cell lines were obtained from ATCC. KPC, KC, S2–013, and MiaPaCa-2 cells were cultured in DMEM supplemented with 10% bovine serum (Fetal Clone III, HyClone), 100 units/ml penicillin and 100 μg/ml streptomycin. L3.6 cells were cultured in RPMI supplemented with 10% bovine serum (Fetal Clone III, HyClone), 100 units/ml penicillin and 100 μg/ml streptomycin.
For conditioned media with glutamine deprivation, glutamine-free DMEM (ThermoFisher 11960044) was used. It was supplemented with dialyzed FBS (Gemini 100–108) and thefollowing substances individually orin combination: L-glutamine (ThermoFisher 25030081) at 2 mM, dimethyl-2-oxoglutarate (dmKG, Sigma 349631) at 6 mM, non-essential amino acid mixture (ThermoFisher 11140050) at 0.1 mM of each amino acid, NH4Cl (Sigma 243134) at 1 mM, aspartate (Sigma A9256) at 1 mM, alanine (Sigma A7469) at 1 mM.
METHOD DETAILS
Chemicals
L-methionine sulfoximine (MSO; Sigma M5379) at 100 μM for cultured cells or tissues and 10 mg/kg for mouse experiments, L-asparaginase (ASNase) at 0.5 IU/ml for cultured cells and 3 IU/g for mouse experiments, 6-Diazo-5-oxo-L-norleucine (L-DON; Sigma D2141) at 25 μM, BPTES (Sigma SML0601) at 10 μM, aminooxyacetic acid (AOA, Sigma C13408) at 500 μM, epigallocatechin gallate (EGCG, kindly provided by Dr. Yukihiko Hara at Tea Solutions, Hara Office Inc) at 50 μM, μ-chloro-L-alanine (Santa Cruz Biotechnology sc-291972) at 250 μM, cycloserine (Sigma C1159) at 250 μM, Direct Red 80 (Sigma 365548), Picric acid (Sigma 197378), OSMI-1 (Sigma #SML1621) at 50 μM. Stable isotope tracers were purchased from Cambridge Isotope Laboratories (15N-NH4Cl, NLM-467-PK; 13C5-aKG, CLM-2411-PK).
Antibodies
Antibodies were purchased from the indicated sources: GLUL (Sigma G2781,1:1,000 for IB, 1:800 for IHC; Abcam, ab73593,1:1,000 for IB; BD 610517,1:1,000 for IHC), β-tubulin (Sigma T9026, 1:10,000 for IB), Hsp90 (Millipore 07–2174,1:2,000 for IB), GAPDH (Cell Signaling #97166, 1:1,000 for IB), DLST (Abnova H00001743-D011:1,000 for IB), IDH2 (ProteinTech 15932–1-AP, 1:1,000 for IB), PCNA (Cell Signaling 13110, 1:8,000 for IHC), O-GlcNAc (CTD110.6, Cell Signaling #9875, 1:100 for IHC), GOT1 (Proteintech 14886–1-AP, 1:1,000 for IB), PSAT1 (Proteintech 10501–1-AP, 1:1,000 for IB), GLUD1 (Proteintech 14299–1-AP, 1:1,000 for IB).
Plasmids
Expression: mouse GLUL expression cDNA was cloned into pLPC retroviral vector. Short-hairpin RNA (shRNA): pLKO-based shRNA plasmids were purchased from Sigma-Aldrich
Mouse GLUL shRNA (NM_008131, #1: TRCN0000309816; #2: TRCN0000309745). Human IDH2 shRNA (SHCLNG-NM_002168, #1: TRCN0000229434; #2: TRCN0000229778). The following sequencesagainst DLST werecloned into pLKO.1 plasmid: shDLST#1: TGTCTCATAGCCTCGAATATC; shDLST#2: CGAAAGAATGAACTTGCCATT. CRISPR/Cas9 short guide RNA (sgRNA): for the organoid study, sgRNAs were cloned into the LRNG vector (pLenti-sgRNA-EFS-Neo-IRES-GFP) (Roe et al., 2017). Control sgRNA: sgRosa26 GAAGATGGGCGGGAGTCTTC; for mouse GLUL silencing, sgGLUL#1: TGGGATCGTAGGCGCGAATG; sgGLUL#2 CATTCGCGCCTACGATCCCA. pLenti-Cas9-Puro (Addgene #108100) was used for the expression of spCas9. For human cell culture, sgRNA of human GLUL was cloned into pLentiCRISPRv2 (Addgene #52961). sgGLUL: GCGCTGCAAGACCCGGACCC. For mouse cell culture and orthotopic studies, a pool of three plasmids each containing a 20 nt guide RNA sequence specific to mouse GLUL was purchased from Santa Cruz Biotechnologies (sc-420579).
Immunoblotting
Cell lysates were prepared in 1% sodium deoxycholate, 0.1% SDS, 1% Triton X-100, 0.01 M Tris pH8.0, 140 mM NaCl. Protein lysates were separated in SDS-PAGE. All primary antibodies were incubated overnight at 4°C. Alexafluor-conjugated goat anti-rabbit (IRDye800, Rockland) or goat anti-mouse (Alexafluor-680, Life Technologies) antibodies were used as secondary antibodies (1:10,000). Immunoblots were developed using an Odyssey Imager (LI-COR).
For immunoblotting of organoids, organoids were lysed with 20 mM HEPES; 300 mM NaCl; 1% Triton X-100; 5 mM EDTA; 10% Glycerol supplemented with protease inhibitors (Mini, Roche). Protein lysates were separated in 4%–12% Bis-Tris NuPage gels (Life Technologies). Immunoblots were probed with anti-Hsp90 (Millipore, 07–2174) and anti-GLUL (Abcam, ab73593) antibodies.
Histology and immunohistochemistry
Paraffin-embedded pancreas sections were stained with hematoxylin and eosin (H&E) or IHC. For IHC, paraffn-embedded pancreas sections were deparaffinized, rehydrated, and microwave heated for 15 min in 10 mM citrate buffer (pH 6.0) for antigen retrieval. 3% hydrogen peroxide was applied to block endogenous peroxidase activity. After 2.5 h of blocking with 10% goat serum, mouse anti-GLUL or control IgG were applied and incubated overnight at 4°C. After wash, slides were incubated with biotinylated secondary antibody and the streptavidin-biotin complex (Vectastain Elite ABC kit, Vector Laboratories) were applied, each for 30 min at room temperature with an interval washing. After being rinsed with PBS, the slides were immersed for 5 min in the coloring substrate 3,3′-diaminobenzidine (DAB, Sigma-Aldrich Co. LLC. St. Louis, MO) 0.4 mg/mL with 0.003% hydrogen peroxide, then rinsed with distilled water, counterstained with hematoxylin, dehydrated, and coverslipped. For Sirius Red staining, paraffn-embedded pancreas sections were deparaffinized, rehydrated, and stained with hematoxylin for 8 mins, followed by staining in Picro Sirius Red (Direct Red 80, Sigma 365548; Picric acid, Sigma 197378) for 1 h. After washing in two changes of 0.5% acidified water, slides were dehydrated and coverslipped. H&E and IHC slides were examined using light microscopy (Eclipse Ci, Nikon Instruments) and photographed using a digital camera (DS-F/3, Nikon Instruments).
Cell growth/proliferation assays
Manual counting
Cells were trypsinized off culture dishes, then counted with a hemocytometer. Cell culture was photographed using a Keyence BX-Z microscope.
Crystal violet staining
Cells were seeded at equal density in triplicate wells in 12-well plates. The following day, an initial seeding plate was fixed with 4% PFA. Remaining plates were washed three times with PBS before receiving deficient or supplemented media. Cells were cultured for 72 h, then fixed with 4% PFA. After fixation, cells were stained with 0.1% crystal violet. Stain was eluted with 10% acetic acid and absorbance measured at 590 nm.
IncuCyte measurement
Cells were seeded at 4×10⁴ cells per well in twelve well plates with various medium conditions. Cell proliferation assay was performed for three days using IncuCyte Live Cell Analysis System and analyzed using IncuCyte Zoom.
Celigo Cell Imager
Cells were seeded at 1,000 cells per well in 96-well plates with various medium conditions. Automated cell proliferation and death assays (by propidium iodide (PI) staining) were performed daily.
In vitro proliferation assay on mouse organoids
Organoids were dissociated into single cells with TrypLE Express Enzyme (ThermoFisher). Cells were counted and diluted to 10 cells/μl in a mixture of experimental medium: AdDMEM/F12 medium supplemented with HEPES (1x, Invitrogen), Glutamax (1x, Invitrogen), penicillin/streptomycin (1x, Invitrogen), B27 (1x, Invitrogen), R-spondin-conditioned medium (10% v/v, Calvin Kuo), mNoggin (0.1 μg/ml, Peprotech), Gastrin I (10 nM, Sigma), fibroblast growth factor 10 (FGF10, 0.1 μg/ml, Preprotech), Nicotinamide (10 mM, Sigma), and A83–01 (0.5 μM, Tocris) and Growth factor-reduced Matrigel (BD, 10% final concentration). 150 μLof this mixture (1500 cells per well) was plated in 96-well white plates (Nunc), whose wells had been previously coated with poly(2-hydroxyethyl methacrylate) (Sigma) to prevent cell adhesion to the bottom of the wells. Cell viability was measured every 24 h using the Cell-Titer-Glo assay (Promega) and SpectraMax I3 microplate reader (Molecular Devices). Five replicate wells per time point were measured.
Mitochondrial respiration
Oxygen consumption rate (OCR) and ATP production were measured using aSeahorse Biosciencesextracellularflux analyzer (XF24) as described previously (Guo et al., 2011). Briefly, cells were seeded at 5×10⁴ cells per well in the XF24 plates. Next day, cells were preincubated in various medium conditions, and basal OCRs and ATP levels were measured.
Synthesis of 13C-labled dimethyl 2-oxopentanedioate (13C5-dmKG)
p-toluenesulfonic acid monohydrate (38 mg, 0.2 mmol, 0.1 equiv) was added to the solution of 13C5-aKG (300 mg, 1.98 mmol, Cambridge Isotope Laboratories CLM-2411-PK) in CHCl3 (10 mL) and MeOH (3 mL). The resulting reaction mixture was stirred at room temperature overnight. The solvent was removed and the residue was purified by flash column chromatography (hexane/ethylacetate = 2:1) to afford the pure product 308 mg (yield 89%, colorless oil, purity > 95%). 1H NMR (600 MHz, CDCl3) δ 3.83 (dd, J = 4.0 Hz, 3H), 3.63 (d, J = 4.0 Hz, 3H), 3.21 (dd, J = 5.2, 4.6 Hz, 1H), 3.00 (dd, J = 10.7, 4.9 Hz, 1H), 2.73 (dd, J = 10.7, 4.6 Hz, 1H), 2.51 (dd, J = 10.9, 4.8 Hz, 1H). All chemicals and reagents were purchased from commercial suppliers and used without further purification. Proton Nuclear Magnetic Resonance (1H-NMR) spectra were recorded on a Bruker DRX-600 spectrometer.
LC-MS
To assay the total level of metabolite pools, cells were seeded in 100 mm dishes at equal cell number. Cells were washed three times with PBS before culturing in media with stable isotope tracers. After tracing, media was aspirated, then quickly overlaid with a 40:40:20 mixture of methanol:acetonitrile:water with 0.5% formic acid. The plates were incubated on ice for 5 min, then 50 μL of 15% NH4HCO3 was added to neutralize the acetic acid. Cells were scraped into microfuge tubes, and centrifuged for 10 min at 15,000 × g at 4°C. The supernatant was collected for LC-MS.
The LC-MS method involved hydrophilic interaction chromatography (HILIC) coupled with electrospray ionization totheQ Exactive PLUS hybrid quadrupole-orbitrap mass spectrometer (Thermo Scientific). The LC separation was performed on a XBridge BEH Amide column (150 mm × 2.1 mm, 2.5 μm particlesize, Waters, Milford, MA) using agradient of solvent A (95%/5% H2O/ acetonitrile with 20 mM ammonium acetate and 20 mM ammonium hydroxide, pH 9.4), and solvent B (20%/80% H2O/acetonitrile with 20 mM ammonium acetate and 20 mM ammonium hydroxide, pH 9.4). The gradient was 0 min, 100% B; 3 min, 100% B; 3.2 min, 90% B; 6.2 min, 90% B; 6.5 min, 80% B; 10.5 min, 80% B; 10.7 min, 70% B; 13.5 min, 70% B; 13.7 min, 45% B; 16 min, 45% B; 16.5 min, 100% B; 22 min, 100% B. The flow rate was 300 μL/min. Injection volume was 5 μL and column temperature 25°C. The automatic gain control (AGC) target was 3 × 10⁶. The maximum injection time was 50 ms. Scan range was 75–1,000. The metabolite features were extracted in MAVEN (Melamud et al., 2010) with the labeled isotope specified and a mass accuracy window of 5 ppm. The isotope natural abundance and tracer isotopic impurity was corrected using AccuCor (Su et al., 2017).
In vivo and ex vivo stable isotope labeling
For jugular vein catheterization, the procedure was modified from work previously described (Poillet-Perez et al., 2018). In brief, 3–6 week old mice were anaesthetized using isoflurane carried by 2% oxygen, followed by the placement of a central venous catheter (polyurethane tubing, 1 F in OD) (SAI Infusion Technologies) into the right jugular vein. A minimal amount of blood was carefully withdrawn to verify the catheter patency. The proximal end of the catheter was then tunneled subcutaneously, exited between the shoulder blades and properly secured with a catheter button (Instech Laboratories). Catheterized mice were allowed at least 3d tofully recover. Afterward, the button and catheter were connected to an infusion pump (New Era Pump System) through a mouse tether and swivel system (Instech Laboratories). Ammonia isotope tracer (150 mM, 15N-NH4Cl, NLM-467-PK, Cambridge Isotope Laboratories) was dissolved in sterile saline and infused at a rate of 15 nmol/g/min (0.1 μl/g/min) for 3 h. Infusion rate was determined and optimized based on serial infusions with different concentration of the tracer (data not shown). Mice were sacrificed and tissues (serum, pancreas, liver, and kidney analysis) were collected and analyzed by LC-MS. The isotope natural abundance and impurity of labeled substrate were corrected using a matrix-based algorithm. The construction of the purity matrix and C/N joint correction matrix is similar to AccuCor39.
For ex vivo stable isotope labeling, mice were sacrificed and necropsied to harvest pancreatic tissue. The pancreas (tumor laden) was roughly divided into multiple pieces then cultured in glutamine free DMEM supplemented with 10% dialyzed FBS and 1.5 mM 13C5-dmKG for 1 h. After the 1 h incubation, tissues were collected, frozen with Wollenberger clamp, and stored at −80°C. Tissue was processed as described above for in vivo tracing and submitted for LC/MS.
Orthotopic implantation and tumor Imaging
Cells were trypsinized and washed twice in PBS. 6–8 week old mice were anesthetized with a mixture of 100 mg/kg ketamine and 10 mg/kg xylazine. For orthotopic pancreatic tumor growth, the abdomen was shaved and swabbed with a sterile alcohol pad followed by povidone-iodide scrub. A small vertical incision was made over the left lateral abdominal area, to the left of the spleen. The head of the pancreas attached to the duodenum was located. Using a sterile insulin syringe, 5 million cells in 100 μL PBS were injected into the head of the pancreas. The injection site was pressed with a sterile cotton swab to prevent leakage. The abdominal and skin incisions were closed with 5–0 silk black braided sutures. The mice were given an intraperitoneal injection of 2 mg/kg Ketorolac immediately after surgery. To monitor tumor growth, the animals were injected intraperitoneally with 100 mg/kg RediJect D-Luciferin (PerkinElmer) and imaged on the IVIS Lumina III imaging system (Xenogen). Data were analyzed using Living Imagev 4.3.1 software.
Mouse organoids culture and in vivo transplantation assay
Organoids were cultured as described (Boj et al., 2015) and quickly harvested on ice in AdDMEM/F12 media supplemented with HEPES (1x, Invitrogen), Glutamax (1x, Invitrogen), and penicillin/streptomycin (1x, Invitrogen). For the orthotopic engraftment of mouse organoids, 6–8 week old mice were anesthetized using Isoflurane and subcutaneous administration of Ketoprofen (5 mg/kg). The surgery site was disinfected with Iodine solution and 70% ethanol. An incision was made in the upper left quadrant of the abdomen. Organoids were dissociated to single cells with TrypLE Express Enzyme (ThermoFisher). 25,000 cells/mouse were resuspended in 50 μL of growth factor-reduced Matrigel (BD) diluted 1:1 with cold PBS and injected in the tail region of the pancreas of 6 weeks-old female athymic Nu/Nu mice (Charles Rivers Laboratories). The incision at the peritoneal cavity was sutured with Coated Vicryl suture (Ethicon) and the skin was closed with wound clips (Reflex7, CellPoint Scientific Inc). Mice were euthanized 43 d after the surgery. When a tumor was found upon necropsy, it was dissected out, photographed, and weighted on a lab scale. If no tumor was found, the pancreas and spleen were dissected out and examined for fluorescence signal. Tumor weight was counted as zero if the lesions are too small to be dissected and weighted, although the engraftment might be visible in the GFP images. Tumors were imaged on a Zeiss SteREO Discovery V8 microscope using Axiovision software.
CRISPR/Cas9 knockout in organoids
pLenti-Cas9-Puro and LRNG-sgGLUL plasmids were sequentially introduced into murine T23 organoids. Briefly, lentiviruses were produced in HEK293T cells by transfecting plasmids and packaging plasmids (pMD2 and psPAX2) with X-tremeGENE9 transfection reagent (Roche), concentrated with LentiX concentrator (Clontech), and resuspended in organoid culture media supplemented with Y-27632 (10 mM, Sigma). Organoids were dissociated to single cells with TrypLE Express Enzyme (ThermoFisher). 100,000 cells were resuspended with concentrated lentivirus supplemented with polybrene (final concentration; 8 μg/mL), and spinoculated at 600 RCF for 45 min at room temperature. Two d after infection, G418 (1 mg/mL) and puromycin (2 μg/mL) were added for antibiotic selection.
All mouse experiments were done in compliance with the Institutional Animal Care and Use Committee guidelines at Rutgers University, Cold Spring Harbor Laboratory, and Stony Brook University. Mice implanted with tumor cells were monitored by IVIS imaging every week for tumor growth. Death, weight lossof ≥ 15% body weight, or inability to move were considered as endpoints when surviving animals would be euthanized.
QUANTIFICATION AND STATISTICAL ANALYSIS
All cell culture and isotope tracing experiments except for Figure S3B were performed at least three times, each with a triplicate. Independent two-sample and one sample t tests were used to make comparisons between two groups and to evaluate whether fold changes are different from one, respectively. Two tailed Student’s t test was performed for the xenograft tumor growth experiments. The analyses were mainly carried out using GraphPad Prism or Excel. The survival curves were analyzed by log-rank test. Different levels of statistical significance are indicated as: n.s.: non-significant, *p < 0.05, **p < 0.01, ***p < 0.001, and ****p < 0.0001.
DATA AND CODE AVAILABILITY
GLUL gene amplification across human cancers was analyzed using cBioPortal (http://www.cbioportal.org). The Human Protein Atlas (http://www.proteinatlas.org) was used to analyze GLUL IHC staining various tumor tissues. Oncomine (https://www.oncomine.org) datasets were analyzed for GLUL mRNA expression levels in normal pancreatic tissue and pancreatic cancer. For Figures 1D–1G, a total of 178 pancreatic adenocarcinoma (PAAD) samples having both RNaseq and clinical data were extracted from TCGA GDAC Firehose dataset 2016. R software was used to plot the GLUL expression among different clinical phenotypes. Sub-groups with sample size less than 5 or clinical information uncertain/unknown were excluded.
Supplementary Material
Highlights.
GLUL expression is high in human pancreatic cancers and in mouse PDAC models
aKG rescue of glutamine-deprived cells requires GLUL
De novo glutamine synthesis is essential for nitrogen anabolic processes
Genetic ablation of GLUL suppresses mouse PDAC development
ACKNOWLEDGMENTS
We thank Drs. Surinder Batra, Shawn Davidson, Estela Jacinto, Joshua Rabinowitz, Nancy Reich Marshall, Philip Furmanski, Yu Sun, and Chung S. Yang for reagents, technical assistance, and advice. The study was supported by NIH grants F99CA212445 (to A.J.B.); R01CA224550, R01CA129536, R01CA232246, R21CA205172 (to W.X.Z.); R01CA215059 (to H.F.); R01DK109714 (to T.G.A.); 5P30CA45508 (including the Animal and Animal and Tissue Engineering Shared Resource), 5P50CA101955, P20CA192996, U10CA180944, U01CA210240, U01CA224013, 1R01CA188134, and R01CA190092 (to D.A.T.); K22CA190521 (to J.Y.G.); and LCRF (to J.Y.G.). We are also grateful for support from the Lustgarten Foundation (where D.A.T. is a distinguished scholar), the Northwell Health Affiliation (to D.A.T.), and American Italian Cancer Foundation (to C.T.).
Footnotes
DECLARATION OF INTERESTS
The authors declare no competing interests.
SUPPLEMENTAL INFORMATION
Supplemental Information can be found online at https://doi.org/10.1016/j.celrep.2019.09.056.
REFERENCES
- Altman BJ, Stine ZE, and Dang CV (2016). From Krebs to clinic: glutamine metabolism to cancer therapy. Nat. Rev. Cancer 16, 619–634. [DOI] [PMC free article] [PubMed] [Google Scholar]
- Bardeesy N, Aguirre AJ, Chu GC, Cheng KH, Lopez LV, Hezel AF, Feng B, Brennan C, Weissleder R, Mahmood U, et al. (2006). Both p16(Ink4a) and the p19(Arf)-p53 pathway constrain progression of pancreatic adenocarcinoma in the mouse. Proc. Natl. Acad. Sci. USA 103, 5947–5952. [DOI] [PMC free article] [PubMed] [Google Scholar]
- Bergström J, Fürst P, Norée LO, and Vinnars E (1974). Intracellular free amino acid concentration in human muscle tissue. J. Appl. Physiol 36, 693–697. [DOI] [PubMed] [Google Scholar]
- Biancur DE, Paulo JA, Małachowska B, Quiles Del Rey M, Sousa CM, Wang X, Sohn ASW, Chu GC, Gygi SP, Harper JW, et al. (2017). Compensatory metabolic networks in pancreatic cancers upon perturbation of glutamine metabolism. Nat. Commun 8, 15965. [DOI] [PMC free article] [PubMed] [Google Scholar]
- Boj SF, Hwang CI, Baker LA, Chio II, Engle DD, Corbo V, Jager M, Ponz-Sarvise M, Tiriac H, Spector MS, et al. (2015). Organoid models of human and mouse ductal pancreatic cancer. Cell 160, 324–338. [DOI] [PMC free article] [PubMed] [Google Scholar]
- Bott AJ, Peng IC, Fan Y, Faubert B, Zhao L, Li J, Neidler S, Sun Y, Jaber N, Krokowski D, et al. (2015). Oncogenic Myc Induces Expression of Glutamine Synthetase through Promoter Demethylation. Cell Metab. 22, 1068–1077. [DOI] [PMC free article] [PubMed] [Google Scholar]
- Bruns CJ, Harbison MT, Kuniyasu H, Eue I, and Fidler IJ (1999). In Vivo Selection and Characterization of Metastatic Variants from Human Pancreatic Adenocarcinoma by Using Orthotopic Implantation in Nude Mice. Neoplasia 1, 50–62. [DOI] [PMC free article] [PubMed] [Google Scholar]
- Carey BW, Finley LW, Cross JR, Allis CD, and Thompson CB (2015). Intracellular α-ketoglutarate maintains the pluripotency of embryonic stem cells. Nature 518, 413–416. [DOI] [PMC free article] [PubMed] [Google Scholar]
- Cluntun AA, Lukey MJ, Cerione RA, and Locasale JW (2017). Glutamine Metabolism in Cancer: Understanding the Heterogeneity. Trends Cancer 3, 169–180. [DOI] [PMC free article] [PubMed] [Google Scholar]
- Cox AG, Hwang KL, Brown KK, Evason K, Beltz S, Tsomides A, O’Connor K, Galli GG, Yimlamai D, Chhangawala S, et al. (2016). Yap reprograms glutamine metabolism to increase nucleotide biosynthesis and enable liver growth. Nat. Cell Biol 18, 886–896. [DOI] [PMC free article] [PubMed] [Google Scholar]
- Dang CV (2012). Links between metabolism and cancer. Genes Dev. 26, 877–890. [DOI] [PMC free article] [PubMed] [Google Scholar]
- Davidson SM, Papagiannakopoulos T, Olenchock BA, Heyman JE, Keibler MA, Luengo A, Bauer MR, Jha AK, O’Brien JP, Pierce KA, et al. (2016). Environment Impacts the Metabolic Dependencies of Ras-Driven Non-Small Cell Lung Cancer. Cell Metab. 23, 517–528. [DOI] [PMC free article] [PubMed] [Google Scholar]
- De Vitto H, Perez-Valencia J, and Radosevich JA (2016). Glutamine at focus: versatile roles in cancer. Tumour Biol. 37, 1541–1558. [DOI] [PubMed] [Google Scholar]
- De Berardinis RJ, and Cheng T (2010). Q’s next: the diverse functions of glutamine in metabolism, cell biology and cancer. Oncogene 20, 313–324. [DOI] [PMC free article] [PubMed] [Google Scholar]
- Eelen G, Dubois C, Cantelmo AR, Goveia J, Brüning U, DeRan M, Jarugumilli G, van Rijssel J, Saladino G, Comitani F, et al. (2018). Role of glutamine synthetase in angiogenesis beyond glutamine synthesis. Nature 561, 63–69. [DOI] [PubMed] [Google Scholar]
- Gao P, Tchernyshyov I, Chang TC, Lee YS, Kita K, Ochi T, Zeller KI, De Marzo AM, Van Eyk JE, Mendell JT, and Dang CV (2009). c-Myc suppression of miR-23a/b enhances mitochondrial glutaminase expression and glutamine metabolism. Nature 458, 762–765. [DOI] [PMC free article] [PubMed] [Google Scholar]
- Guo JY, Chen HY, Mathew R, Fan J, Strohecker AM, Karsli-Uzunbas G, Kamphorst JJ, Chen G, Lemons JM, Karantza V, et al. (2011). Activated Ras requires autophagy to maintain oxidative metabolism and tumorigenesis. Genes Dev. 25, 460–470. [DOI] [PMC free article] [PubMed] [Google Scholar]
- He Y, Hakvoort TB, Köhler SE, Vermeulen JL, de Waart DR, deTheije C, ten Have GA, van Eijk HM, Kunne C, Labruyere WT, et al. (2010). Glutamine synthetase in muscle is required for glutamine production during fasting and extrahepatic ammonia detoxification. J. Biol. Chem 285, 95169524. [DOI] [PMC free article] [PubMed] [Google Scholar]
- Hensley CT, Wasti AT, and DeBerardinis RJ (2013). Glutamine and cancer: cell biology, physiology, and clinical opportunities. J. Clin. Invest 123, 3678–3684. [DOI] [PMC free article] [PubMed] [Google Scholar]
- Hingorani SR, Wang L, Multani AS, Combs C, Deramaudt TB, Hruban RH, Rustgi AK, Chang S, and Tuveson DA (2005). Trp53R172H and KrasG12D cooperateto promote chromosomal instability and widely metastatic pancreatic ductal adenocarcinoma in mice. Cancer Cell 7, 469–483. [DOI] [PubMed] [Google Scholar]
- Hui S, Ghergurovich JM, Morscher RJ, Jang C, Teng X, Lu W, Esparza LA, Reya T, Zhan Le, Yanxiang Guo J, et al. (2017). Glucose feeds the TCA cycle via circulating lactate. Nature 551, 115–118. [DOI] [PMC free article] [PubMed] [Google Scholar]
- Jackson EL, Willis N, Mercer K, Bronson RT, Crowley D, Montoya R, Jacks T, and Tuveson DA (2001). Analysis of lung tumor initiation and progression using conditional expression of oncogenic K-ras. Genes Dev. 15, 3243–3248. [DOI] [PMC free article] [PubMed] [Google Scholar]
- Jones CL, Stevens BM, D’Alessandro A, Reisz JA, Culp-Hill R, Nemkov T, Pei S, Khan N, Adane B, Ye H, et al. (2018). Inhibition of Amino Acid Metabolism Selectively Targets Human Leukemia Stem Cells. Cancer Cell 34, 724–740. [DOI] [PMC free article] [PubMed] [Google Scholar]
- Kamphorst JJ, Nofal M, Commisso C, Hackett SR, Lu W, Grabocka E, VanderHeiden MG, Miller G, Drebin JA, Bar-Sagi D, et al. (2015). Human pancreatic cancer tumors are nutrient poor and tumor cells actively scavenge extracellular protein. Cancer Res. 75, 544–553. [DOI] [PMC free article] [PubMed] [Google Scholar]
- Maher EA, Marin-Valencia I, Bachoo RM, Mashimo T, Raisanen J, Hatanpaa KJ, Jindal A, Jeffrey FM, Choi C, Madden C, et al. (2012). Metabolism of [U-13 C]glucose in human brain tumors in vivo. NMR Biomed. 25, 1234–1244. [DOI] [PMC free article] [PubMed] [Google Scholar]
- Marin-Valencia I, Yang C, Mashimo T, Cho S, Baek H, Yang XL, Rajagopalan KN, Maddie M, Vemireddy V, Zhao Z, et al. (2012). Analysis of tumor metabolism reveals mitochondrial glucose oxidation in genetically diverse human glioblastomas in the mouse brain in vivo. Cell Metab. 15, 827–837. [DOI] [PMC free article] [PubMed] [Google Scholar]
- Mashimo T, Pichumani K, Vemireddy V, Hatanpaa KJ, Singh DK, Sirasanagandla S, Nannepaga S, Piccirillo SG, Kovacs Z, Foong C, et al. (2014). Acetate is a bioenergetic substrate for human glioblastoma and brain metastases. Cell 159, 1603–1614. [DOI] [PMC free article] [PubMed] [Google Scholar]
- Melamud E, Vastag L, and Rabinowitz JD (2010). Metabolomic analysis and visualization engine for LC-MS data. Anal. Chem 82, 9818–9826. [DOI] [PMC free article] [PubMed] [Google Scholar]
- Mullen AR, Wheaton WW, Jin ES, Chen PH, Sullivan LB, Cheng T, Yang Y, Linehan WM, Chandel NS, and DeBerardinis RJ (2011). Reductive carboxylation supports growth in tumour cells with defective mitochondria. Nature 481, 385–388. [DOI] [PMC free article] [PubMed] [Google Scholar]
- Neinast MD, Jang C, Hui S, Murashige DS, Chu Q, Morscher RJ, Li X, Zhan L, White E, Anthony TG, et al. (2019). Quantitative Analysis ofthe Whole-Body Metabolic Fate of Branched-Chain Amino Acids. Cell Metab. 29, 417–429. [DOI] [PMC free article] [PubMed] [Google Scholar]
- Poillet-Perez L, Xie X, Zhan L, Yang Y, Sharp DW, Hu ZS, Su X, Maganti A, Jiang C, Lu W, et al. (2018). Autophagy maintains tumour growth through circulating arginine. Nature 563, 569–573. [DOI] [PMC free article] [PubMed] [Google Scholar]
- Roe JS, Hwang CI, Somerville TDD, Milazzo JP, Lee EJ, DaSilva B, Maiorino L, Tiriac H, Young CM, Miyabayashi K, et al. (2017). Enhancer Reprogramming Promotes Pancreatic Cancer Metastasis. Cell 170, 875–888. [DOI] [PMC free article] [PubMed] [Google Scholar]
- Roy I, McAllister DM, Gorse E, Dixon K, Piper CT, Zimmerman NP, Getschman AE, Tsai S, Engle DD, Evans DB, et al. (2015). Pancreatic Cancer Cell Migration and Metastasis Is Regulated by Chemokine-Biased Agonism and Bioenergetic Signaling. Cancer Res. 75, 3529–3542. [DOI] [PMC free article] [PubMed] [Google Scholar]
- Son J, Lyssiotis CA, Ying H, Wang X, Hua S, Ligorio M, Perera RM, Ferrone CR, Mullarky E, Shyh-Chang N, et al. (2013). Glutamine supports pancreatic cancer growth through a KRAS-regulated metabolic pathway. Nature 496, 101–105. [DOI] [PMC free article] [PubMed] [Google Scholar]
- Sousa CM, Biancur DE, Wang X, Halbrook CJ, Sherman MH, Zhang L, Kremer D, Hwang RF, Witkiewicz AK, Ying H, et al. (2016). Pancreatic stellate cells support tumour metabolism through autophagic alanine secretion. Nature 536, 479–483. [DOI] [PMC free article] [PubMed] [Google Scholar]
- Spinelli JB, Yoon H, Ringel AE, Jeanfavre S, Clish CB, and Haigis MC (2017). Metabolic recycling of ammonia via glutamate dehydrogenase supports breast cancer biomass. Science 358, 941–946. [DOI] [PMC free article] [PubMed] [Google Scholar]
- Su X, Lu W, and Rabinowitz JD (2017). Metabolite Spectral Accuracy on Orbitraps. Anal. Chem 89, 5940–5948. [DOI] [PMC free article] [PubMed] [Google Scholar]
- Tajan M, Hock AK, Blagih J, Robertson NA, Labuschagne CF, Kruiswijk F, Humpton TJ, Adams PD, and Vousden KH (2018). A Role for p53 in the Adaptation to Glutamine Starvation through the Expression of SLC1A3. Cell Metab. 28, 721–736. [DOI] [PMC free article] [PubMed] [Google Scholar]
- Tardito S, Oudin A, Ahmed SU, Fack F, Keunen O, Zheng L, Miletic H, Sakariassen PO, Weinstock A, Wagner A, et al. (2015). Glutamine synthetase activity fuels nucleotide biosynthesis and supports growth of glutaminerestricted glioblastoma. Nat. Cell Biol 17, 1556–1568. [DOI] [PMC free article] [PubMed] [Google Scholar]
- Torres MP, Rachagani S, Souchek JJ, Mallya K, Johansson SL, and Batra SK (2013). Novel Pancreatic Cancer Cell Lines Derived from Genetically Engineered Mouse Models ofSpontaneous Pancreatic Adenocarcinoma: Applications in Diagnosis and Therapy. Plos One 8, e80580. [DOI] [PMC free article] [PubMed] [Google Scholar]
- Tran TQ, Ishak Gabra MB, Lowman XH, Yang Y, Reid MA, Pan M, O’Connor TR, and Kong M (2017). Glutaminedeficiency induces DNAalkylation damage and sensitizes cancer cells to alkylating agents through inhibition of ALKBH enzymes. PLoS Biol. 15, e2002810. [DOI] [PMC free article] [PubMed] [Google Scholar]
- Uhlén M, Fagerberg L, Hallström BM, Lindskog C, Oksvold P, Mardinoglu A, Sivertsson Å, Kampf C, Sjöstedt E, Asplund A, et al. (2015). Proteomics. Tissue-based map ofthe human proteome. Science 347, 1260419. [DOI] [PubMed] [Google Scholar]
- Wise DR, and Thompson CB (2010). Glutamine addiction: a newtherapeutic target in cancer. Trends Biochem. Sci 35, 427–433. [DOI] [PMC free article] [PubMed] [Google Scholar]
- Wise DR, DeBerardinis RJ, Mancuso A, Sayed N, Zhang XY, Pfeiffer HK, Nissim I, Daikhin E, Yudkoff M, McMahon SB, and Thompson CB (2008). Myc regulates a transcriptional program that stimulates mitochondrial glutaminolysis and leads to glutamine addiction. Proc. Natl. Acad. Sci. USA 105,18782–18787. [DOI] [PMC free article] [PubMed] [Google Scholar]
- Yan W, Wu X, Zhou W, Fong MY, Cao M, Liu J, Liu X, Chen CH, Fadare O, Pizzo DP, et al. (2018). Cancer-cell-secreted exosomal miR-105 promotes tumour growth through the MYC-dependent metabolic reprogramming of stromal cells. Nat. Cell Biol 20, 597–609. [DOI] [PMC free article] [PubMed] [Google Scholar]
- Yang L, Achreja A, Yeung TL, Mangala LS, Jiang D, Han C, Baddour J, Marini JC, Ni J, Nakahara R, et al. (2016). Targeting Stromal Glutamine Synthetase in Tumors Disrupts Tumor Microenvironment-Regulated Cancer Cell Growth. Cell Metab. 24, 685–700. [DOI] [PMC free article] [PubMed] [Google Scholar]
Associated Data
This section collects any data citations, data availability statements, or supplementary materials included in this article.
Supplementary Materials
Data Availability Statement
GLUL gene amplification across human cancers was analyzed using cBioPortal (http://www.cbioportal.org). The Human Protein Atlas (http://www.proteinatlas.org) was used to analyze GLUL IHC staining various tumor tissues. Oncomine (https://www.oncomine.org) datasets were analyzed for GLUL mRNA expression levels in normal pancreatic tissue and pancreatic cancer. For Figures 1D–1G, a total of 178 pancreatic adenocarcinoma (PAAD) samples having both RNaseq and clinical data were extracted from TCGA GDAC Firehose dataset 2016. R software was used to plot the GLUL expression among different clinical phenotypes. Sub-groups with sample size less than 5 or clinical information uncertain/unknown were excluded.