

SUMMARY
Multiple mechanisms of resistance to epidermal growth factor receptor (EGFR) tyrosine kinase inhibitors (TKIs) have been identified in EGFR-mutant non-small cell lung cancer (NSCLC); however, recurrent resistance to EGFR TKIs due to the heterogeneous mechanisms underlying resistance within a single patient remains a major challenge in the clinic. Here, we report a role of nuclear protein kinase Cδ (PKCδ) as a common axis across multiple known TKI-resistance mechanisms. Specifically, we demonstrate that TKI-inactivated EGFR dimerizes with other membrane receptors implicated in TKI resistance to promote PKCδ nuclear translocation. Moreover, the level of nuclear PKCδ is associated with TKI response in patients. The combined inhibition of PKCδ and EGFR induces marked regression of resistant NSCLC tumors with EGFR mutations.
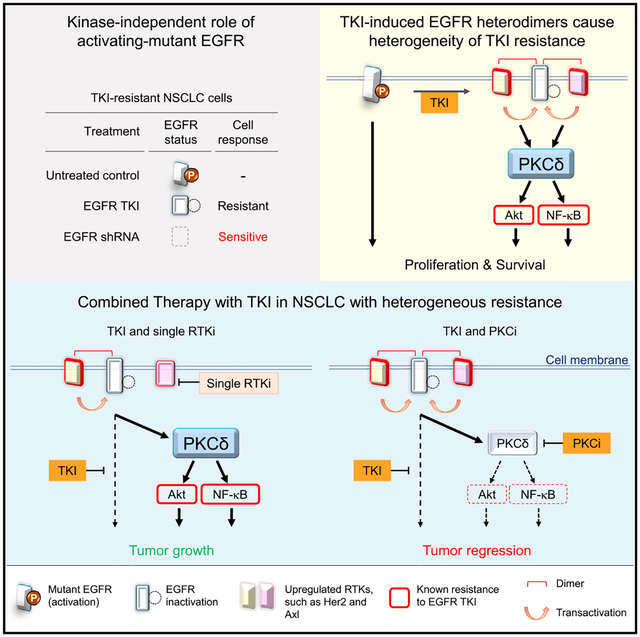
Graphical Abstract
In Brief
Lee et al. find nuclear PKCδ as a mediator of resistance mechanisms to EGFR tyrosine kinase inhibitors (TKIs). TKI-induced EGFR heterodimerization promotes PKCδ nuclear translocation, which is associated with TKI resistance in patients. Combined TKI and PKCδ inhibition induces regression of resistant NSCLC tumors.
INTRODUCTION
Epidermal growth factor receptor (EGFR)-activating-mutant non-small cell lung cancer (NSCLC) often initially responds well to EGFR tyrosine kinase inhibitors (TKIs) (Haber et al., 2011); however, the disease almost always recurs about 10–13 months of therapy. Analysis of clinical specimens indicated that TKI-resistant NSCLC harbors multiple acquired resistance mechanisms, including amplification or upregulation of Axl, Her-2, c-Met, Akt, Erk, and nuclear factor κB (NF-κB) signaling, and EGFR second-site mutation T790M (Rotow and Bivona, 2017). To overcome T790M-mediated resistance, third-generation TKIs, e.g., AZD9291 (osimertinib), were developed and showed promising results (Janne et al., 2015), but virtually all tumors eventually develop resistance after about 10 months of treatment (Minari et al., 2016). Likewise, tumors from patients who failed AZD9291 treatment also harbor similar mechanisms underlying disease progression, e.g., EGFR C797S mutation, activation of Akt and MAPK, and amplification of HER-2, MET, or EGFR, which are highly heterogeneous even within an individual patient (Minari et al., 2016; Piotrowska et al., 2015). In addition to acquired resistance, intrinsic resistance, which by definition is a lack of response or an initial response with tumor reprogression <4 months (Park et al., 2014), may also be attributed to heterogeneous resistant mechanisms. Previous in vitro studies indicated that EGFR amplification in EGFR-mutant NSCLC cells causes resistance to an irreversible TKI (Ercan et al., 2010). Those findings raise the interesting question of whether and how the expression level of EGFR per se plays a role in resistance to EGFR kinase inhibition. We hypothesized that EGFR-mutant NSCLC is addicted to EGFR via the well-known kinase-mediated downstream signaling (TKI-sensitive) and additional unknown roles of EGFR (TKI-insensitive), and that the TKI-insensitive EGFR pathways, including multiple known resistant mechanisms, contribute to the heterogeneity of TKI resistance. Thus, identification of a common and targetable mediator involved in the TKI-insensitive EGFR pathways may provide a treatment strategy to overcome disease recurrence.
RESULTS
A TKI-Insensitive Role of EGFR Maintains Cell Survival of EGFR-Mutant NSCLC with TKI Resistance
To corroborate the TKI-insensitive role of EGFR in TKI resistance, we depleted EGFR comparing with treating TKI in H1650 cells, which harbor EGFR-activating mutation and are resistant to TKIs via mechanisms unrelated to T790M mutation (Bivona et al., 2011; Sos et al., 2009). Interestingly, EGFR knockdown by two specific short hairpin RNAs, shRNA-E1 and shRNA-E2, almost completely inhibited cell growth (Figure 1A), whereas inhibition of EGFR by treating with TKI, gefitinib (gef), or erlotinib (erl) had virtually no effect on cell growth (Figures 1A and S1A), which was expected. PTEN loss and subsequent Akt activation as well as NF-κB pathway in H1650 have been shown to contribute to cell survival and resistance to TKIs (Bivona et al., 2011; Sos et al., 2009). Therefore, we assessed the phosphorylation status of Akt and NF-κB as well as EGFR downstream survival signaling, Erk in EGFR-depleted H1650 cells (Figure 1B). EGFR depletion attenuated all Akt, Erk, and RelA phosphorylation compared with EGFR kinase inhibition, which did not affect Akt or RelA and moderately reduced Erk phosphorylation (Figure 1B). The results showing TKI-resistant cells sensitized to EGFR depletion suggested an oncogenic addiction via unknown roles of mutant EGFR independently of TKI responsiveness, and that roles of EGFR may maintain cancer cell survival by activating downstream signaling, including Akt, Erk, and RelA phosphorylation, in TKI-resistant H1650 cells.
Figure 1. A TKI-Insensitive Role of Activating-Mutant EGFR Maintains Survival of NSCLC Resistant to EGFR TKIs.

(A) Comparison of response to EGFR depletion and EGFR kinase inhibition in H1650 cells. Cells were infected with control or EGFR shRNA (E1 or E2). Control shRNA cells were treated with 1 μM gefitinib (gef) or 0.1 μM erlotinib (erl) on day 0. Cells were counted after treatment at the indicated time points. Western blot analysis of phosphorylated and total EGFR in EGFR shRNA cells and in control shRNA cells treated with gef (1 μM) and erl (0.1 μM) for 24 hr. Error bars are based on assays that were repeated in triplicate and are present for each time point, but nominal in some cases.
(B) Western blot analysis of Akt, Erk, and RelA phosphorylation in H1650 cells treated as described in (A).
(C) Effects of re-expression of either active EGFR (del19) or kinase-dead (del19-KD) EGFR on EGFR depletion-induced growth inhibition of H1650 cells. Cells were counted after infection with E1 EGFR shRNA (shEGFR) and re-expressed shRNA-resistant EGFR (rEGFR) variants for 7 days. Western blot analysis of phosphorylated and total EGFR 2 days after lentiviral infection.
(D) Effects of EGFR depletion in NSCLC cell lines with various EGFR mutations and TKI responses. Cells were infected with control or E1 EGFR shRNA. Control cells were treated with 1 μM gef for 7 days. Top: cells were counted on day 7. Bottom: western blot analysis of phosphorylated and total EGFR on day 1. S, sensitive; R, resistant.
(E) Responses to EGFR depletion in 15 HCC827 clones with acquired gefitinib resistance (GR). HCC827 gef-resistant cells (GR cells) were generated by continuous (>2 months) culture in the presence of 1 μM gef followed by single-cell cloning. Features previously established to be related to resistance are shown at the bottom based on western blot analysis in Figure S1E. GR cells were counted after infection with control and E1 EGFR shRNA for 7 days.
Data in (A) and (C) to (E) represent mean ± SD (n = 3). See also Figure S1.
To validate these potential roles of EGFR that maintain survival of TKI-resistant cancer cells, we knocked down endogenous EGFR (del19, kinase activated) by shRNA-E1 targeting 3′ UTR of EGFR in H1650 cells and then re-expressed it or its corresponding kinase-dead (del19-KD) form in these cells. Re-expression of either EGFR-del19 or kinase-dead mutant (EGFR-del19-KD) rescued EGFR depletion-induced lethality (Figure 1C), indicating that the lethal activity requires EGFR depletion but is independent of EGFR kinase activity. Similar effects by EGFR depletion were observed in two other NSCLC cell lines, H1975 carrying the EGFR L858R/T790M mutation and H820 cells carrying the EGFR del19/T790M mutation and Met amplification (Figures 1D and S1B). Re-expression of endogenous EGFR in H1975 cells rescued EGFR depletion-induced lethality (Figure S1C). HCC827 cells were used as control cells, which require EGFR kinase activity for cell survival, and are sensitive to both TKI and EGFR depletion, and thus cannot be rescued by re-expression of the kinase-dead mutant (EGFR-del19-KD; Figure S1C, right). EGFR knockdown and rescue experiments in H1650, H1975, and HCC827 cells validated the specificity of EGFR shRNA-E1 (Figures 1C and S1C). Together, these results demonstrated a previously undiscovered role of EGFR in the survival of TKI-resistant cells.
To systematically interrogate the role of EGFR in acquired TKI resistance, we generated acquired TKI-resistant clones from TKI-sensitive HCC827 cells by exposing them to 1 μM gef for 6 months. Fifteen HCC827 gef-resistant (GR) clones isolated from a single cell demonstrated resistance to gef as indicated by their much greater median inhibitory concentration (IC50 > 1 μM) than the parental cells (IC50 ~ 0.006 μM) (Figure S1D, left). Each of the GR clones was also resistant to afatinib, a clinically used irreversible TKI (Figure S1D, right). Sequence analysis of EGFR in each GR clone revealed that none harbored the resistant T790M mutation. Next, we investigated whether features of known resistant mechanisms exist in GR clones and whether they are sensitive to EGFR depletion. Consistent with prior studies (Bivona et al., 2011; Rotow and Bivona, 2017), these GR clones showed distinctive features of resistance, such as upregulation of Her-2, Axl, Erk, Akt, or NF-κB, on western blot (Figures 1E [bottom] and S1E), suggesting the heterogeneity of TKI-resistance mechanisms in these GR cells. Nevertheless, knocking down endogenous EGFR by lentiviral shRNA-E1 significantly reduced the growth of all GR clones (Figure 1E, top). Together with the data from other three well-characterized TKI-resistant cell lines (Figure 1D), these results suggested that in addition to the well-known kinase activity of EGFR, there exists an unknown role of activating-mutant EGFR that is insensitive to TKI but is required for survival of TKI-resistant EGFR-mutant NSCLC.
Protein Kinase Cδ Serves as a Common Mediator in TKI-Insensitive EGFR Pathways and a Contributor to TKI Resistance
Because EGFR depletion, but not kinase inhibition, sensitized TKI-resistant cells, such as H1650 and all 15 HCC827-derived GR cell lines, harboring different resistant mechanisms to TKI, we hypothesized that the TKI-insensitive pathways of EGFR may confer TKI resistance through a common mediator. If so, therapeutic targeting of the common mediator may provide an effective strategy to overcome recurrent disease in patients with TKI-resistant EGFR-mutant NSCLC. To identify this mediator, we generated an EGFR-depleted resistant subclone (EDR) from H1650 cells by first knocking down EGFR with lentiviral shRNA-E1 and then selecting survived cells as EDR clone (Figure 2A). EGFR depletion was first validated 2 days after lentiviral shRNA infection by comparison with scrambled control (Figures 2A and 2B). After culturing for an additional 7 days, most of the EGFR-depleted cells had died; the few cells that survived were further cultured for more than 3 months and isolated as EDR cells (III, Figure 2A). EGFR depletion was subsequently validated in EDR cells by immunoblotting (Figure 2B, bottom). Analysis of EGFR knockdown efficiency by flow-cytometric analysis also supported the EGFR depletion as only about 10.5% of EDR cells expressed EGFR compared with the control shRNA group, which had >92% EGFR-positive cells (Figure 2A). These data indicated that the cells maintained similar EGFR depletion level during EDR cell establishment, and suggested that EDR cells could be used to search for survival signaling pathways that are present in the parental H1650 but significantly reduced by EGFR depletion and restored in the EDR clones. The identified pathways may represent survival signaling against the lethality induced by EGFR depletion in EDR cells and serve as an ideal therapeutic target to overcome TKI resistance for the EGFR-mutant NSCLC.
Figure 2. PKCδ Is Involved in TKI-Insensitive Pathways of Mutant EGFR and Confers Resistance to EGFR TKIs.

(A) Top: flow diagram of strategies used for establishing (I) control shRNA, (II) EGFR-depleted, and (III) EGFR-depletion-resistant (EDR) stable H1650 cells. Bottom: flow-cytometric analysis of EGFR expression in control shRNA and EDR cells at the end of treatment.
(B) Schematic of antibody array analysis identifying potential mediators. Control shRNA cells (I, green) were treated with 1 μM gefitinib (gef) for 24 hr (I+) and subjected to antibody array analysis for comparison with EGFR-depleted cells (II, red) and EDR cells (III, brown). Western blot showing phosphorylated and total EGFR status in the indicated groups.
(C) Gefitinib dose response in H1650 cells expressing two PKCδ shRNAs (#1 and #2), and/or re-expression of shRNA-resistant PKCδ (rPKCδ). Each stable cell was treated with gefitinib for 10 days and subjected to cell viability assay by crystal violet staining. PKCδ levels in each cell were determined by western blot.
(D) Sensitivity to sotrastaurin in H1650 cells harboring active (del19) or inactive (del19-KD) EGFR. The cells generated for the experiment shown in Figure 1C were treated with sotrastaurin for 10 days and cell viability was assayed as described in (C).
(E) H1650 cells were treated with PKC inhibitors, sotrastaurin (sotra) or Go-6983 (Go) in combination with gef at the indicated concentrations for 10 days. Cell viability was assayed as described in (C) and combination indexes (CI) were calculated. CI ≤ 0.3, strong synergy (red); CI = 0.3–0.9, synergy; CI = 0.9–1.1, additive; CI ≥ 1.1, antagonism.
(F) Quantification of tumor growth (as measured by luciferase intensity) in intrinsically TKI-resistant xenografts of mice treated with the indicated drugs. Mice with orthotopic H1650 tumors were imaged and treated daily with 5 mg/kg gef alone (n = 9), 30 mg/kg sotra alone (n = 9), or the combination (n = 9). Data represent mean ± SEM. **p < 0.01, for the gef-sotra combination versus untreated control (n = 9), gef alone, and sotra alone, statistically significant by Student’s t test.
(G) The H score of phosphorylation of Akt, RelA, Erk, and EGFR, and levels of proliferation marker (Ki67), nuclear and cytoplasmic PKCδ in H1650-derived xenograft tumors from mice treated as described in (F) for 5 days.
(H) Tumor growth and mice survival of EGFR-mutant (del19) TC386 patient-derived xenograft (PDX) model. Left: mice bearing TC386 xenograft were treated with gef, sotra, or the combination as described in (F) when the tumor volume reached 150–200 mm3 (n = 4–5 per arm). Tumor size was measured with a caliper twice per week. Right: Kaplan-Meier survival curves of TC386PDX tumor-bearing mice treated with gef, sotra, or the combination. Data represent mean ± SEM. Data in (C) to (E) and (G) represent mean ± SD (n = 3). See also Figure S2 and Tables S1–S3.
We then aimed to identify protein kinase candidates that can be targeted by drugs currently available for clinical use. To this end, we performed phosphorylation profiling of broad-scope proteins in these cells (Figure 2B) to identify common mediators that may be involved in the TKI-insensitive EGFR pathways and maintaining EDR cell survival by using a Phospho-Explorer Antibody Microarray (Table S1). A wide range of protein phosphorylation was detected and compared among the four different groups (Figure 2B): (I) shRNA control, (I+) shRNA control treated with TKI, (II) EGFR-depleted (day 2 population), and (III) EDR. To identify the potential mediators of the TKI-insensitive EGFR pathways, we used three criteria: (1) the spot was expressed similar levels (between 0.8- and 1.2-fold) in groups I and I+; (2) the spots from (1) in group II expressed lower levels (0.15-fold) than in group I; (3) the observed difference in (2) changed in the opposite direction in the EDR group (III) (>4-fold from group III). A total of 27 candidates were thus identified. Interestingly, among these mediators (Table S1), several, including B-RAF, β-catenin, c-Met, FAK, FKHR, NF-κB, and Raf1, have previously been implicated in resistance to EGFR inhibition (Rotow and Bivona, 2017; Tomasello et al., 2018). Ingenuity pathways analysis (IPA) identified 32 canonical signaling pathways involving these 27 mediators (Table S2). Interestingly, protein kinase Cδ (PKCδ) was involved in 22 of the 32 pathways (>68%; Figure S2A) suggesting that PKCδ may be a common mediator in the TKI-insensitive EGFR pathways involved in TKI resistance.
To further identify which of these mediators and their related pathways are critical in TKI resistance, we performed a synthetic lethality screen by counting the viable TKI-resistant H1650 cells treated with gef in combination of a commercially available inhibitor targeting these potential mediators or their corresponding pathways for 3 days; the combination index (CI) was calculated for each combination (Table S3), with results indicating that Go-6983 (pan-PKC inhibitor, PKCi), sotrastaurin (sotra), a PKCi currently in phase I/II clinical trials (Mochly-Rosen et al., 2012), and U73122 (phospholipase C [PLC] inhibitor) demonstrated the strongest synergy (CI ≤ 0.3) with gef (Table S3). Both PKCβ and PKCδ were identified in our first screen (Table S1). However, a comparison of each of the three PKC inhibitors (Table S3) indicated that only Go-6983 and sotra, which are able to inhibit both PKCβ and PKCδ, but not enzastaurin (inhibiting PKCβ, but not PKCδ, CI > 1; Table S3, blue versus green), ex hibited synergy with gef, suggesting that inhibition of PKCδ sensitized the TKI-resistant H1650 cells to gef. Although our results indicated that both PKCδ and PLCγ2 are involved in the TKI-insensitive EGFR pathways and TKI resistance, only the PKCδ inhibitor (sotra in this study) is currently available in clinical trials. Thus, we focused on PKCδ as a clinically targetable mediator that could rapidly benefit patients with EGFR-mutant NSCLC.
PKCδ Is Required for TKI Resistance
To validate the role of PKCδ in TKI resistance, we first knocked down PKCδ expression by two different shRNAs, #1 and # 2, targeting the coding region and 3′ UTR of PKCδ, respectively, in H1650 cells; PKCδ depletion sensitized cells to gef whereas re-expression of shRNA-resistant PKCδ reversed this sensitization effect (Figure 2C), suggesting that PKCδ is required for TKI resistance. To further investigate the role of PKCδ in EGFR-mutant NSCLC, we treated two TKI-resistant H1650 cell lines expressing EGFR-del19 (activated) or EGFR-del19-KD (inactivated), as shown in Figure 1C, with PKCi. Interestingly, H1650 cells expressing EGFR-del19-KD were more sensitive to sotra than those expressing EGFR-del19 (Figure 2D). These results suggested that EGFR kinase-inactive cells are more dependent on PKCδ activity than cells with active EGFR such that EGFR kinase activity rendered cells resistant to PKCi. We further validated the synergistic effects induced by inhibition of both EGFR kinase activity and PKCδ pathways by examining colony formation of H1650 cells treated with gef and PKCi for a longer time point of 10 days (Figures 2E and S2B). Remarkably, in almost all doses used, the CI values of the gef-sotra and gef-Go-6983 combinations were <0.3 (Figure 2E), further supporting the strong synergy initially observed in the synthetic lethality screen.
On the basis of the in vitro synergies of the TKI-PKCi combination in the intrinsically TKI-resistant H1650 cells (Figure 2C), we further evaluated the combination of gef with sotra in an H1650 orthotopic xenograft tumor model. The gef-sotra combination, but not each agent alone, induced significant tumor regression and extended mouse survival (Figures 2F, S2C, and S2D). All mice in the control, gef, and sotra groups died within 55 days but three of the mice in the gef-sotra combination group (n = 9) survived longer than 99 days, with one surviving beyond 1 year. PKCδ is known to elicit several survival signaling pathways in cancer cells (Basu and Pal, 2010) and, interestingly, Erk/MAPK, PI3K, and NF-κB signaling were among those identified in our first screen (Tables S1 and S2). In addition, Akt activation is associated with TKI resistance in PTEN-loss H1650 cells (Sos et al., 2009). Therefore, we also examined Akt, Erk, and NF-κB phosphorylation in tumors treated with the gef-sotra combination. Single treatment of gef or sotra reduced phosphorylation of AKT, RelA, and ERK (Figures 2G and S2E), suggesting that either EGFR or PKCδ are potential upstream molecules of this survival signaling. The combination treatment suppressed more pAkt, pRelA, and Ki67 levels than single drug treatment (Figure 2G, red bars), implying AKT and NF-κB are mechanisms for the synergy of EGFR and PKC inhibitors. These results supported the therapeutic potential of TKI-PKCi combination in TKI-resistant NSCLC and suggested that Akt and NF-kB survival signaling may be involved in the TKI-PKCi synergy in H1650 cells.
Next, we examined the effects of the gef-sotra combination in a heterogeneous patient-derived xenograft (PDX) model (TC386) from a naive EGFR-mutant (del19) NSCLC patient with PKCδ-resistant feature (positive nPKCδ staining; Figure S2F, left). In the gef-alone group, tumor progression was observed after gef treatment for 14 days (Figure 2H, left), suggesting TKI resistance in the tumors. Sotra alone had virtually no effect on tumor growth whereas sotra in combination with gef effectively induced tumor regression and extended mouse survival (Figure 2H, left). Notably, compared with mice from the control, sotra, and gef groups, which died within 70 days, all of the mice in the gef-sotra combination group survived longer than 120 days (Figure 2H, right). Together these data supported the therapeutic efficacy and the potential curative effect of the TKI-PKCi combination on TKI resistance in both orthotopic xenograft and PDX models.
To further validate the role of PKCδ as a common mediator in acquired TKI resistance, we performed genetic and pharmacological inhibition of PKCδ in GR cells. Knockdown of PKCδ by shRNA in multiple GR cell lines rendered them sensitive to gef (Figure 3A), whereas re-expression of PKCδ rescued the gef-resistant phenotype (Figure 3A). Consistent with these findings, inhibition of PKCδ by sotra significantly enhanced suppression of both cell viability and survival signaling in GR cells treated with gef in vitro (Figures 3B and S3A). The combination of gef and sotra was further evaluated in mice with NSCLC tumors (GR6) harboring acquired gef resistance. The gef-sotra combination effectively induced tumor regression (~88.5% regression after a 1-week treatment and ~98.3% regression after a 4-week treatment) whereas gef or sotra alone only modestly delayed tumor growth (Figures 3C and S3B). Furthermore, the effective doses of the gef-sotra combination did not significantly affect mouse body weight or the values of the indicators of liver and kidney functions (Figures S3C and S3D). These results suggested that the gef-sotra combination at the doses administered may be a safe and effective therapeutic strategy to treat EGFR-mutant NSCLC with TKI resistance. Since gef has received regulatory approval in NSCLC patients, and PKCi sotra is available for clinical studies, the combination could be readily tested in clinical trials, especially for patients whose tumor has developed resistance to TKIs.
Figure 3. PKCδ Is Required and Sufficient for EGFR TKI Resistance.

(A) IC50s of gefitinib in GR cells expressing scrambled control shRNA, PKCδ shRNA (shPKCδ), or shRNA-resistant PKCδ (shPKCδ-rPKCδ) were measured after 10 days of treatment. IC50 of gefitinib >10 μM indicates cells treated with up to 10 μM of gefitinib did not reach 50% of cell growth inhibition in control shRNA and shPKCδ-rPKCδ cells. PKCδ expression in indicated cells was determined by western blot.
(B) The IC50 of gefitinib (gef) in GR cells was measured after 10-day treatment of vehicle (control) or sotrastaurin (sotra) (20 μM).
(C) Quantification of tumor growth (measured by luciferase intensity) in lung orthotopic xenografts of mice treated with the indicated drugs. Mice bearing GR6 tumors were imaged every 7 days after treatment as described in Figure 2F. Data represent mean ± SEM (n = 7–9). **p < 0.01, for the gef-sotra combination versus untreated control, gef alone, and sotra alone, statistically significant by Student’s t test.
(D and E) Gefitinib dose response in TKI-sensitive H3255 (D) and HCC827 (E) cells ectopically expressing PKCδ in vitro. Vector control and PKCδ-expressing H3255 and HCC827 cells were treated with gef and subjected to cell viability assay by crystal violet staining. Top: PKCδ expression in cells expressing vector control or PKCδ.
(F) Effects of ectopic expression of PKCδ on gefitinib sensitivity in HCC827 xenografts compared with vector control tumors. Established tumors (250–300 mm3, n = 7) were randomized and treated with gef (50 mg/kg) per day for 3 days followed by measurement of tumor volume. Data represent mean ± SEM.
(G) Percentage of Ki67 (proliferation) and nuclear PKCδ-positive cells (left) and representative IHC staining of tumors (right) in HCC827-derived xenograft tumors from the experiment described in (F). Scale bar, 50 μm.
(H) HCC827 cells expressing control vector or PKCδ were treated with or without gef (0.1 μM) for 24 hr and subjected to western blot analysis with the indicated antibodies.
Data in (A), (B), (D), (E), and (G) represent mean ± SD (n = 3). See also Figure S3.
PKCδ Is Sufficient to Induce TKI Resistance
Next, to determine whether ectopic expression of PKCδ in TKI-sensitive NSCLC cells is sufficient to induce gef resistance, we established PKCδ-ectopic expressing stable clones from two TKI-sensitive H3255 and HCC827 cells. Ectopic expression of PKCδ significantly induced resistance to gef in vitro (Figures 3D and 3E) and in vivo (Figures 3F and 3G). Notably, TKI-induced cleaved poly(ADP ribose) polymerase (cPARP, a marker for apoptosis) was abolished by ectopic PKCδ expression (Figure 3H). Thus, enhanced expression of PKCδ may protect TKI-sensitive cells from TKI-induced apoptosis in EGFR-mutant NSCLC and is sufficient to cause TKI resistance.
Nuclear Localization of PKCδ Is Present in Multiple TKI-Resistant NSCLC Cells and Contributes to TKI Resistance
PKCδ is activated in specific subcellular compartments, such as the nucleus (Mochly-Rosen et al., 2012). To determine the molecular mechanism underlying the contribution of PKCδ to TKI resistance, we compared the expression and subcellular distribution of PKCδ between GR and parental HCC827 cells. Western blot analysis indicated that the total expression of PKCδ did not change significantly in both GR and parental HCC827 cells (Figure S4A). Interestingly, however, immunofluorescence staining and western blot analysis indicated greater PKCδ nuclear localization (nPKCδ) in the GR cells than in the parental HCC827 cells (Figures 4A and 4B). Furthermore, nPKCδ was readily detectable in a TKI-resistant EGFR-mutant H1650 cell model (Figures 4C and S4B), suggesting an association between nPKCδ and TKI resistance. To further characterize the role of nPKCδ in TKI resistance, we examined the effects of PKCδ inhibition on its nuclear localization. Treatment of H1650 and GR cells with sotra attenuated nPKCδ (Figures 4C, 4D, S4B, and S4C) and these results were confirmed in GR cells by treating with another PKCi, Go-6983 (Figure 4C). Moreover, treatment of sotra also led to downregulation of PKCδ overall protein expression (Figure S4D) but not mRNA levels (Figure S4E), and the reduction of PKCδ was attributed to the ubiquitination and proteasome degradation pathway (Figures S4F and S4G).
Figure 4. Nuclear Localization of PKCδ Is Required for TKI Resistance.

(A) Confocal microscopy analysis of PKCδ nuclear localization in HCC827 parental and GR cells by immunofluorescence staining (green). Nuclei were counterstained with DAPI (blue). Scale bars, 50 μm (upper images) and 10 μm (inset images).
(B) PKCδ expression in nuclear extracts (NE) of parental and GR cells was determined by western blot analysis.
(C) H1650 cells were treated with gefitinib (gef) (1 μM), EGFR shRNA, sotrastaurin (sotra) (10 μM), and Go (20 μM) for 24 hr. Top: at the end of treatment, PKCδ localization was analyzed by immunofluorescence staining as described in (A). Scale bar, 10 μm. Bottom: percentage of H1650 cells with high, medium, or low levels of nuclear PKCδ (nPKCδ) as determined by fluorescence microscopy. Fifty nuclei were counted in each treatment group.
(D) PKCδ in nuclear extract (NE) and cytosol extract (CE) in H1650 cells after 24 hr of sotra treatment, followed by western blot analysis.
(E) The IC50 of gefitinib and nPKCδ immunofluorescence staining in cells expressing vector control, wild-type (WT) PKCδ, or NLS mutant PKCδ (NLSm1 and NLSm3). Data represent mean ± SD (n = 3). Scale bar, 50 μm.
(F) Western blot analysis of pAkt, pErk, pRelA, pT505 PKCδ, and total PKCδ expression in HCC827-expressing vector control, WT PKCδ, NLSm1, or NLSm3 PKCδ mutants in the presence of gef (0.1 μM) for 24 hr.
See also Figure S4.
To determine whether nuclear localization of PKCδ is required to induce TKI resistance, we first identified a potent nuclear localization sequence (NLS) at the C-terminal of human PKCδ using in silico analysis of NLS (Figure S4H) and showed that the NLS was highly conserved among different species. We then constructed two mutations in the NLS region (NLSm1 and NLSm3) of human wild-type PKCδ (PKCδ-WT; Figure S4H). Two TKI-sensitive cells, H3255 and HCC827, were transduced with empty vector, PKCδ-WT, PKCδ-NLSm1, or PKCδ-NLSm3. Results from immunofluorescence analysis indicated that PKCδ increased in both nuclei and cytoplasm of PKCδ-WT cells compared with vector control cells whereas increased PKCδ was detected only in cytoplasm of both NLSm1- and NLSm3-expressing cells, confirming that these two NLS PKCδ mutants effectively blocked PKCδ nuclear translocation (Figure 4E). We then treated these stable transfectant cells with gef and found that ectopic expression of PKCδ-WT, which increased nuclear PKCδ expression, but not PKCδ-NLSm1 or PKCδ-NLSm3 mutants, induced pAkt, pErk, and pRelA (Figure 4F) and rendered cells resistant to gef (Figure 4E). In addition, WT and NLS mutant PKCδ expressed similar kinase activity in HCC827 cells (Figures S4I and S4J), indicating that the differences in TKI sensitivity between WT PKCδ and the NLS mutants were attributed to their localization, but not kinase activity. Collectively, these findings indicated that nuclear PKCδ is required for TKI resistance.
Phosphorylation on the activation loop of PKC serves as a priming step allowing catalytic maturation of PKCδ (Dutil et al., 1998), which involves T505 phosphorylation (pT505) (Parekh et al., 1999), a phosphorylation site that was identified in our first screen (Table S1). However, pT505 does not seem to be necessary for the catalytic activity of PKCδ (Stempka et al., 1997) but may be associated with its localization (Leitges et al., 2002). To determine whether pT505 is required for PKCδ nuclear translocation in EGFR-mutant lung cancer model, we established three stable cells by ectopically expressing phosphorylation-defective (T505A) and phosphorylation-mimic (T505D and T505E) mutant PKCδ (Figure S4K). These three T505 mutants, similar to WT PKCδ, were detected in both the nucleus and cytoplasm of the cells (Figure S4L) by immunofluorescence staining. These results indicated that all three T505 mutants were still localized in nucleus unlike the NLS mutants, and suggested that PKCδ pT505 is not required for controlling its nuclear translocation.
To determine whether PKCδ pT505 is only accompanied by its nuclear localization, we examined the levels of pT505 in the WT and NLS mutants expressing cells treated with gef (Figures 4F and S4M). We found that pT505 PKCδ was enhanced in WT PKCδ cells compared with vector control cells but was not affected by TKI gef (gef, Figure S4M). These data supported our results from initial screening (Table S1) that TKI is not able to suppress pT505 in TKI-resistant cells. Interestingly, cells expressing NLS mutants (m1 and m3), which do not contain nuclear PKCδ (Figure 4E), exhibited substantially lower levels of pT505 PKCδ compared with WT cells in the presence of gef (Figure 4F). These results suggested that pT505 of PKCδ does not control but may accompany its nuclear translocation, which promotes survival signaling pErk, pRelA, and pAkt, and confers TKI resistance.
TKI-Insensitive EGFR Pathways Contribute to the Heterogeneity of TKI-Resistance Mechanisms via nPKCδ Upregulation
To further validate the role of EGFR on nPKCδ in EGFR-mutant NSCLC, we knocked down EGFR in H1650 cells and compared the effects on nPKCδ to TKI treatment. Immunofluorescence staining showed that EGFR depletion, but not kinase inhibition, reduced nPKCδ (Figure 4C), suggesting an unknown TKI-insensitive role of EGFR in promoting nPKCδ in TKI-resistant NSCLC. EGFR is a membrane-bound receptor that can interact with other receptor tyrosine kinases (RTKs), such as Her-2 and Axl, which limits the sensitivity to anti-EGFR therapies (Hirsch et al., 2009). Interestingly, these RTKs have been implicated in PKCδ activation (Allen-Petersen et al., 2014; Elkabets et al., 2015). The above results (Figure 4C) indicated that EGFR knockdown, which eliminated all of EGFR pathways, but not TKI, which only reduced kinase-dependent activity, suppressed nPKCδ levels. Thus, we asked whether the RTKs that are overex-pressed in acquired resistant cells upregulate nPKCδ and whether TKI-inactivated EGFR promotes nPKCδ and TKI resistance through heterodimer formation with those RTKs. Because previous studies have reported the roles of Axl and Her-2 in TKI resistance (Rotow and Bivona, 2017), we first validated that inhibition of Axl and Her-2 enhances TKI sensitivity in our GR4 (Axl overexpression) and GR10 (Her-2 overexpression) cells, respectively (Figure S5A). These results also confirmed that these resistant features led to TKI resistance in the GR cells. Immunoprecipitation followed by western blot analysis to assess EGFR interactions in the two GR cells treated with TKI indicated that TKI induced the interaction between EGFR with Axl in GR4 and with Her-2 in GR10 cells (Figure 5A), suggesting the existence of EGFR heterodimers upon the addition of TKI. Interestingly, GR4 or GR10 cells treated with R428 (Axli) or lapatinib (Her-2i) alone or with gef alone did not significantly reduce nPKCδ. In contrast, only co-inhibition of EGFR and Axl or Her-2 in GR4 or GR10 cells, respectively, attenuated the nPKCδ levels (Figure 5B). Lapatinib treatment alone slightly reduced nPKCδ in the G10 cells, which may be attributed to the dual inhibitory effects on both Her-2 and EGFR (Figure 5B, bottom). These data suggested that the EGFR kinase activity in TKI-resistant cells remains critical for upregulation of nPKCδ. The TKI-induced interaction between EGFR and other resistance-mediating RTKs (heterodimers) may upregulate nPKCδ and lead to TKI resistance in EGFR-mutant NSCLC.
Figure 5. Nuclear Localization of PKCδ Is Induced by EGFR Heterodimers in TKI-Resistant Cells.

(A) Cell lysates from GR4 and GR10 cells treated with 1 μM gefitinib (gef) for 24 hr were subjected to immunoprecipitation with EGFR antibody or immunoglobulin G control. The immunoprecipitates (left) or cell lysates (right) were then blotted with the indicated antibodies.
(B) Western blot showing PKCδ expression in nuclear extracts of GR4 and GR10 cells treated with 1 μM gef in combination with 2.5 μM R428 and 5 μM lapatinib (Lapa) for 24 hr.
(C) Western blot showing phosphorylated PLCγ2 in cells treated with gef (1 μM) and R428 or Lapa for 24 hr. SE, short exposure; LE, long exposure.
(D) Western blot showing PKCδ expression in NE and phosphorylated and total PLCγ2 and ERK in whole cell extracts (WCE) of GR4 and GR10 cells treated with U73122 (5 μM) for 24 hr.
See also Figure S5.
To investigate the mechanisms of how EGFR heterodimers induce nuclear PKCδ and to elucidate the effects of Axl and Her-2 upregulation on EGFR phosphorylation, we examined EGFR phosphorylation status by a human EGFR phosphorylation antibody array in GR4 cells treated with TKI (gef) and Axl inhibitor (R428). Although the array data suggested that co-inhibition of EGFR and Axl blocked more EGFR Y1173 and Y845 phosphorylation than TKI alone (data not shown), western blot analysis indicated that only EGFR Y1173 phosphorylation (pY1173) but not Y845 was suppressed by co-inhibition compared with gef alone (Figure S5B). Similar results were also observed in GR10 cells treated with TKI and Her-2 inhibitor (Figure S5B). In addition to EGFR Y1173 and Y845, we also detected EGFR Y1068 and Y1086 phosphorylation (Figure S5B). pY1173 was only partially inhibited by gef treatment whereas Y1068 and Y1086 EGFR phosphorylation were almost completely suppressed (Figure S5B). The sustained phosphorylation on EGFR Y1173 was further suppressed by co-treating GR4 and GR10 cells with Axl or Her-2 inhibitor, respectively (Figure S5B). These results suggested that the interaction of EGFR and Axl or Her-2 may sustain EGFR pY1173 in resistant cells treated with TKI, and raised an interesting question of whether the sustained EGFR pY1173 may contribute to the TKI-insensitive EGFR pathway.
EGFR Y1173, when phosphorylated, functions as a docking site for phospholipase Cγ (PLCγ) (Chattopadhyay et al., 1999) which cleaves phosphatidylinositol 4,5-bisphosphate (PIP2), resulting in the production of the secondary messengers diacylglycerol (DAG) and inositol 1,4,5-trisphosphate (IP3). DAG activates isozymes of the PKC family, including PKCδ (Rosse et al., 2010). Consistently, EGFR pY1173 observed in GR cells treated with gef and lapatinib (Figure S5B) was associated with the phosphorylation of PLCγ2 (Figure 5C) but not PLCγ1 (Figure S5C). Interestingly, PLCγ2 was identified in our first screen (Table S1), and the second synthetic lethality screen indicated synergistic effects of gef and PLCγ inhibitor (U73122) (Table S3). To further investigate the role of PLCγ2 in nuclear PKCδ, we treated GR4 and GR10 cells with U73122 and observed a significant suppression of nuclear PKCδ (Figure 5D). These data suggested that the interaction of EGFR with Axl or Her-2 sustains EGFR pY1173 and PLCγ2 activity in the presence of EGFR inhibitor. Such activation enhanced nuclear PKCδ and conferred TKI resistance. Therefore, EGFR-Y1173-PLCγ2-nPKCδ is a common axis of TKI-insensitive EGFR pathways that contributes to the heterogeneity of TKI resistance.
nPKCδ Is Upregulated in Human EGFR-Mutant NSCLC with Acquired TKI Resistance and Correlates with Poor Survival in EGFR-Mutant NSCLC Patients Treated with First-Line Single-Agent TKIs
To strengthen our findings that nPKCδ is upregulated in TKI resistant cells and confers TKI resistance, we examined nPKCδ status by immunohistochemistry (IHC) in matched pretreatment and TKI-resistant EGFR-activating mutation-harboring NSCLC specimens from 41 patients (Table 1 and Figures S6A–S6C). All of these patients were treated with erl or gef and had met the established clinical definition of acquired resistance to TKI. Surprisingly, we found that nPKCδ was present in more than 40% of their resistant tumors (17/41, 41.5%). Twelve among the resistant tumors (29.3%) had higher nPKCδ expression levels than their matched pretreatment tumors (Figure 6A), suggesting acquired TKI resistance in these tumors. The other five nPKCδ-positive tumors (~12.2%, 3 high, 1 medium, and 1 low level of nPKCδ) had similar nPKCδ levels compared with their matched pretreatment tumors (Figure 6A), suggesting the role of nPKCδ in intrinsic TKI resistance.
Table 1.
Nuclear PKCδ Is Upregulated in Human EGFR-Mutant NSCLC with Resistance to TKI
| nPKCδ | |||||||||||
|---|---|---|---|---|---|---|---|---|---|---|---|
| ID | Age (yr) | Sex | Smoking | Stage | EGFR Alteration | Pretreatment | Resistance | EGFR T790M | Objective Response | PFS (months) | TKI |
| 1 | 69 | F | no | 4 | S768I, L858R | 0 | 3 | − | PR | 9.1 | gef |
| 2 | 77 | F | no | 4 | L858R | 0 | 3 | − | PR | 14.1 | gef |
| 3 | 81 | M | yes | 4 | 19del | 0 | 3 | − | PR | 28.5 | gef |
| 4 | 81 | M | no | 4 | 19del | 0 | 3 | − | SD | 22.2 | gef |
| 5 | 53 | M | no | 4 | 19del | 0 | 3 | − | PR | 26.8 | gef |
| 6 | 73 | F | no | 3b | L858R | 0 | 3 | + | PR | 10.8 | gef |
| 7 | 62 | F | no | 4 | 19del | 0 | 3 | − | PR | 22.4 | gef |
| 8 | 44 | F | no | 4 | 19del | 0 | 3 | − | PR | 8.6 | gef |
| 9 | 72 | F | no | 4 | 19del | 1 | 3 | + | PR | 16.0 | gef |
| 10 | 47 | F | no | 4 | L858R | 1 | 3 | − | PD | 2.2 | gef |
| 11 | 60 | M | no | 4 | 19del | 2 | 3 | − | SD | 8.4 | gef |
| 12 | 78 | M | no | 4 | 19del | 2 | 3 | − | SD | 6.1 | gef |
| 13 | 56 | F | no | 4 | 19del | 3 | 3 | − | PR | 4.9 | erl |
| 14 | 66 | F | no | 4 | L858R | 3 | 3 | − | PD | 1.6 | gef |
| 15 | 66 | F | no | 4 | L858R | 3 | 3 | − | PD | 2.7 | gef |
| 16 | 60 | M | no | 4 | 19del | 2 | 2 | − | SD | 9.2 | gef |
| 17 | 87 | F | no | 4 | 19del | 1 | 1 | − | PD | 2.4 | gef |
| 18 | 61 | M | no | 4 | L858R | 0 | 0 | NA | PR | 9.3 | gef |
| 19 | 50 | M | no | 4 | L858R | 0 | 0 | − | SD | 3.5 | gef |
| 20 | 58 | M | yes | 4 | L858R | 0 | 0 | − | PR | 3.7 | gef |
| 21 | 49 | F | no | 4 | L858R | 0 | 0 | − | PD | 1.6 | gef |
| 22 | 57 | F | no | 3b | L861Q | 0 | 0 | − | SD | 8.7 | gef |
| 23 | 81 | F | no | 4 | L858R | 0 | 0 | − | PR | 3.9 | gef |
| 24 | 45 | F | no | 4 | 19del | 0 | 0 | − | PD | 3.0 | gef |
| 25 | 67 | F | no | 4 | 19del | 0 | 0 | − | SD | 6.0 | gef |
| 26 | 54 | M | yes | 4 | L858R | 0 | 0 | − | PR | 34.0 | gef |
| 27 | 61 | M | no | 4 | L861Q | 0 | 0 | − | PR | 14.4 | gef |
| 28 | 89 | F | no | 4 | L858R | 0 | 0 | − | PR | 10.5 | gef |
| 29 | 63 | M | yes | 4 | L858R | 0 | 0 | − | PR | 11.9 | gef |
| 30 | 37 | F | no | 4 | 19del | 0 | 0 | − | PR | 8.2 | gef |
| 31 | 41 | F | no | 4 | L858R | 0 | 0 | − | PR | 7.2 | gef |
| 32 | 67 | F | no | 4 | 19del | 0 | 0 | − | PR | 6.4 | gef |
| 33 | 50 | F | no | NA | 19del | 0 | 0 | − | SD | 6.8 | erl |
| 34 | 52 | F | no | 4 | 19del | 0 | 0 | − | PR | 6.7 | gef |
| 35 | 75 | F | no | 4 | L858R | 0 | 0 | + | PR | 9.3 | gef |
| 36 | 72 | F | no | 4 | L858R | 0 | 0 | + | SD | 11.9 | gef |
| 37 | 54 | M | yes | 4 | 19del | 0 | 0 | − | PR | 6.0 | gef |
| 38 | 37 | F | no | 4 | 19del | 0 | 0 | − | PR | 7.7 | gef |
| 39 | 56 | F | no | 4 | 19del | 0 | 0 | − | SD | 5.8 | gef |
| 40 | 71 | F | no | 4 | L858R | 0 | 0 | NA | PR | 7.0 | gef |
| 41 | 55 | M | yes | 4 | L858R | 0 | 0 | − | SD | 6.0 | gef |
PFS, progression-free survival; M, male; F, female; gef, gefitinib; erl, erlotinib; PR, partial response; SD, stable disease; NA, not available.
Figure 6. nPKCδ Reduces Progression-Free Survival in Patients with EGFR-Mutant NSCLC Treated with a First-Line EGFR TKI and Confers Resistance of EGFR T790M+ NSCLC to Third-Generation EGFR TKIs.

(A) Changes of nPKCδ levels in resistant tumors compared with pretreatment tumors. The 41 matched EGFR-mutant NSCLC specimens from patients before single-agent TKI treatment (pretreatment, Pre) and after development of resistance to these drugs (resistance, R) were collected (see also Table 1) and their nPKCδ levels were detected by IHC staining. A score of 3 indicates high level, 2 medium, and 1 low.
(B) Median progression-free survival (PFS) and 95% confidence intervals of low nPKCδ (score = 0 and 1) and high nPKCδ (score = 2 and 3) groups from 166 EGFR-mutant NSCLC patients treated with EGFR TKI.
(C) Effects of nPKCδ on PFS in the cohort as described in (B).
(D and E) H1975 (D) and TM0204 PDX (E) tumor growth. Tumor-bearing mice were treated with 1 mg/kg AZD9291, 30 mg/kg sotrastaurin (sotra), or the combination. Data represent mean ± SEM (n = 6–8 for H1975 mice; n = 5 for TM0204 mice).
(F) Nuclear PKCδ levels of EGFR-mutant mouse tumors were detected by IHC staining as described in Figure 3G. The genetically engineered EGFR del19 (left) and EGFR L858R T790M (right) mice bearing spontaneous lung tumors were treated with erlotinib and AZD9291, respectively. Lung tumors were collected from the mice before and after daily treatment of EGFR TKI until tumor regrowth, indicating resistance.
(G) A model illustrating the development of resistance to TKI and the proposed therapeutic strategies against resistant tumors in EGFR-mutant NSCLC. Patients with resistant tumors “c” and “d” harboring additional EGFR mutations, such as T790M and C797S, respectively, could be treated with next-generation TKI. For resistant tumor “a” and “b,” multiple combination treatments of the same TKI with specific kinase inhibitors targeting a single resistance pathway were unsuccessful in the clinic, likely due to tumor heterogeneity of mechanisms of resistance to TKI. Inhibition of PKCδ, a common mediator involved in multiple resistance mechanisms, such as Axl and Her-2 upregulation, has the potential to overcome such heterogeneous resistance in combination with TKI.
To further validate the clinical importance of the findings in TKI-intrinsic resistance, we examined the status of nPKCδ in a larger cohort including 166 naive tumors from patients with EGFR-mutant NSCLC treated with single-agent gef, erl, or afatinib as first-line therapy. Analysis of nPKCδ expression in these TKI-naive tumor samples showed that nPKCδ was highly expressed in 19 (11.4%) of the 166 patients (Figure 6B and Table S4), well consistent with the ~12% from the previous cohort (Figure 6A). Furthermore, high expression of nPKCδ in these 19 patients was associated with worse progression-free survival following TKI treatment (Figure 6C). These findings suggested that nPKCδ may contribute to both acquired (~29.3%, Figure 6A) and intrinsic (~ 11.4%; Figure 6B) resistance to TKI and that it may be a common mechanism underlying TKI resistance in human EGFR-mutant NSCLC.
nPKCδ Induces Resistance to Third-Generation TKI in T790M+ Tumors
Third-generation TKIs are currently the most potent anticancer drugs against TKI-resistant EGFR-mutant NSCLC with T790M mutation (Rotow and Bivona, 2017). From our results above, we noticed that T790M-positive (T790M+) patients (case 6 and 9 in Table 1), who may be considered for third-generation TKI treatment, concurrently harbored increased nPKCδ in their resistant tumors (Table 1). Co-occurrence of EGFR T790M mutation and reactivation of other resistant RTKs, such as Axl, was reported in TKI-treated NSCLC (Zhang et al., 2012). These findings prompted us to ask whether PKCδ plays a direct role in resistance to third-generation TKI and whether the combination of third-generation TKI with PKCi may also benefit T790M+ patients with a PKCδ-resistant feature. Using the H1975 cell line model system, which harbors the T790M-resistant mutation but is sensitive to EGFR depletion as shown in an earlier experiment (Figures 1D and S1C), we treated H1975 cells with the third-generation TKI, AZD9291 (0.1–0.2 μM), which nearly abolished all EGFR phosphorylation (Figure S6D) but only partially inhibited cell growth (Figure S6E). nPKCδ was readily observed in untreated H1975 cells and was reduced by treatment of sotra (Figure S6F). These findings together suggested that nPKCδ may cause resistance to third-generation TKIs in T790M+ cells. To assess the role of PKCδ in these cells, we treated H1975 tumors with AZD9291 in combination with sotra in vitro (Figures S6E and S6G) and in vivo (Figure 6D). A strong synergy (CI < 0.3) between AZD9291 and sotra in H1975 cells in vitro (Figure S6E) suggested that inhibition of PKCδ may provide additional benefit when combined with a third-generation TKI to treat T790M+ NSCLC patients with a PKCδ-resistant marker. This concept was further validated in mice with H1975 tumor as well as the T790M+ PDX (TM0204) tumor harboring the EGFR del19/T790M mutation and PKCδ-resistant feature (positive nPKCδ staining; Figure S2F). The AZD9291-sotra combination effectively led to tumor regression in H1975 and TM0204 PDX models but not sotra or AZD9291 (partially delayed tumor growth) alone (Figures 6D and 6E). IHC staining of drug-treated tumors demonstrated that sotra at the dose used effectively reduced nPKCδ. Moreover, the combination of sotra and AZD9291 suppressed survival signaling pErk and pRelA, and enhanced apoptosis (TUNEL) (Figure S6H).
To strengthen our conclusion that nPKCδ is upregulated in TKI-resistant tumors, we detected nPKCδ expression levels by IHC staining in two untreated control tumors and five first-generation TKI erl-resistant tumors from genetically engineered EGFR del19-mutant mice as well as in four untreated control tumors and two third-generation TKI AZD9291-resistant tumors from EGFR L858R T790M mutant mice (Ji et al., 2006; Li et al., 2007). Encouragingly, all tumors resistant to TKI expressed higher levels of nPKCδ than untreated control tumors, particularly in AZD9291-resistant tumors (Figure 6F). Together, these results supported our conclusion that nPKCδ renders NSCLC tumors resistant to third-generation TKI and that sotra and AZD9291 prevent tumor growth in heterogeneous T790M+ tumor models with AZD9291 resistance in a cooperative manner.
DISCUSSION
Diverse upregulation or activation of RTKs as well as EGFR downstream signaling have been shown to induce TKI resistance in EGFR-mutant NSCLC (Camidge et al., 2014; Minari et al., 2016). In several studies, the therapeutic effects in TKI-resistant NSCLC are concurrent with drug-induced downregulation of EGFR, such as heat-shock protein 90 inhibitor (Johnson et al., 2015) and dual targeting of EGFR by afatinib and cetuximab in clinical trials (Janjigian et al., 2014). Nonetheless, whether and how downregulation of EGFR induces TKI-resistant tumor regression is not clear. Moreover, the lack of effective strategies to overcome relapses due to heterogeneity of resistance suggested that different lesions may develop distinct mechanisms of resistance within a tumor or in an individual patient, complicating the treatment strategies (Suda et al., 2016). Here, we report a mechanism by which EGFR-mutant NSCLC escapes the antitumor activity of TKI via the EGFR-mediated resistance through nPKCδ upregulation (Figure 6G). Combination of PKCi and TKI leads significant tumor shrinkage.
It has been reported that kinase inhibitor induces the formation of inactive EGFR heterodimers (Anido et al., 2003; Ferrer-Soler et al., 2007). Consistently, we showed that gef induced EGFR heterodimers in TKI-resistant EGFR-mutant NSCLC, in which phosphorylation of EGFR Y845, Y1068, and Y1086 were almost completely suppressed by gef. However, EGFR pY1173 was only partially reduced by gef, and the sustained pY1173 by EGFR heterodimer promoted activation of PLCγ2 and PKCδ. Identification of pY1173 EGFR in TKI resistance is interesting and encouraging to further understand the detailed mechanisms underlying how RTKs mediate PKCδ activation. A systematic study will be required to derive a clear conclusion on this aspect and pursue it in the future.
Our findings offer insights into the addiction of TKI-resistant EGFR-mutant NSCLC via TKI-insensitive EGFR survival pathways, and may partially explain the differences in the response to EGFR kinase inhibition versus EGFR protein reduction in patients with TKI-resistant EGFR-mutant NSCLC. Moreover, we identified targetable PKCδ as a common mediator of the EGFR pathway that plays a role in multiple TKI-resistant mechanisms.
Although PKCδ in cancer cells is known to promote antiapoptotic signaling, a cleaved form of PKCδ, δCF, has been reported to play a contrasting role in enhancing apoptosis (Reyland, 2007), and these complex functions appear to be cell-type dependent (Basu and Pal, 2010). In NSCLC, full-length PKCδ has been shown to promote cell survival (Basu and Pal, 2010). In our study, two antibodies, Ab182126 and LS-C199448 recognizing the C- and N-terminal domain of PKCδ, respectively, detected PKCδ protein in the nucleus, suggesting a full-length PKCδ in the nucleus of EGFR-mutant TKI-resistant lung cancer cells. Ectopic expression of full-length PKCδ in EGFR-mutant NSCLC cells led to TKI resistance without inducing apoptosis. Moreover, all our clinical and preclinical data supported the oncogenic role of PKCδ, particularly in TKI resistance.
Abera and Kazanietz (2015) demonstrated that the PKC isozyme PKCα is involved in resistance to TKI using H1650 cells as a model and generating an H1650-M3 resistant clone by treatment with high doses of erl (1–10 μM). However, the parental H1650 cells themselves are considered erl resistant as previously reported (Bivona et al., 2011; Sos et al., 2009), and our data confirmed that H1650 cells are also resistant to gef (IC50 > 1 μM) compared with TKI-sensitive HCC827 (IC50 ~ 0.006 μM). erl at 0.1 μM was sufficient to completely suppress EGFR phosphorylation in H1650 cells (Bivona et al., 2011). However, the IC50 of erl in H1650 and H1650-M3 cells were about 3 and 20 μM, respectively. Such high doses of erl are thought to induce off-target effects. In addition, the clinical role of PKCα was not validated in the study by Abera and Kazanietz (2015). Therefore, the PKCα-mediated TKI resistance (H1650-M3 versus H1650) may represent different conditions from our PKCδ study.
PKC inhibitor as a single-agent treatment or in combination with chemotherapy has not been successful in tumors (Mochly-Rosen et al., 2012). Consistently, our results showed that sotra alone did not affect tumor growth in all xenograft tumor models. However, the combination of sotra with gef led to significant tumor regression without significant changes in mouse body weight or liver and kidney functions. These results suggested a potential and safe therapeutic strategy by combining TKI with PKC inhibitor for EGFR-mutant NSCLC patients with resistance to TKI.
Upregulation of RTKs is a common mechanism underlying TKI resistance (Camidge et al., 2014; Minari et al., 2016). A single tumor with heterogeneous resistance mechanisms may upregulate multiple RTKs and cause failure of the combination therapy of TKI and specific RTK inhibitors (Figure 6G). Here, we identified nPKCδ as a common downstream molecule of the resistance-mediated RTKs, and a common upstream molecule of resistant survival signaling in TKI-resistant cells. Thus, inhibition of PKCδ has the potential to overcome the heterogeneity of TKI resistance. Because nPKCδ was highly expressed in human EGFR-mutant NSCLC with intrinsic and acquired TKI resistance, and was correlated with poor TKI response in patients, and because the combined inhibition of PKCδ and EGFR induced significant tumor regression in TKI-resistant EGFR-mutant NSCLC xenografts and PDX models, it may be worthwhile to evaluate such combinations as therapeutic options for patients with EGFR-mutant NSCLC with TKI resistance.
STAR★METHODS
CONTACT FOR REAGENT AND RESOURCE SHARING
Further information and requests for resources and reagents should be directed to and will be fulfilled by the Lead Contact, Mien-Chie Hung (mhung@mdanderson.org).
EXPERIMENTAL MODEL AND SUBJECT DETAILS
Human NSCLC Clinical Specimens
All specimens were acquired from patients under the auspices of clinical protocols approved by the respective ethics review board at each hospital; informed consent was obtained in all cases. The tumor tissues were obtained as pleural effusion or biopsy specimen from patients with stage IIIB or IV NSCLC that had been screened for EGFR-activating mutations. The tissues were then fixed in formalin and embedded in paraffin. Pretreated EGFR-mutant NSCLC specimens (n = 127) were retrieved from the archive of Department of Pathology at Lin-Kou Chang-Gung Memorial Hospital, Taiwan. Forty-one of these have matched TKI resistant specimens. Another 39 specimens of pretreated EGFR-mutant NSCLC were obtained from China Medical University Hospital, Taiwan. From all tissue blocks, 4 μm tissue slides were prepared for immunohistochemical staining.
TUMORIGENESIS ASSAYS AND IMMUNOHISTOCHEMICAL STAINING
H1650/luc and GR6/luc cells were injected directly into the right chest of BALB/c nude mice (six-week-old, female). Tumor volume as indicated by luciferase intensity was measured by an IVIS system on the days shown. H1975 cells were inoculated subcutaneously into nude mice. TC386 patient-derived xenografts (PDX) tumors were cut to about 2 mm3 in size and implanted into the flank subcutaneous space of nude mice as described previously(Hao et al., 2015). TM0204 PDX-bearing mice were purchased from Jackson Laboratory. Tumor-bearing mice were randomized and drugs administered according to treatment group. Gefitinib, AZD9291, and sotrastaurin were administered orally five times per week (1 week equaled one treatment cycle) and continued for indicated cycles. HCC827-vector and HCC827-PKCδ cells were inoculated subcutaneously into the hind limbs of NSG mice. Tumor-bearing mice were randomized and treated with gefitinib. Tumor volumes for subcutaneous tumors were measured with calipers twice per week. Immunohistochemical staining was performed as previously described(Shen et al., 2013) in the tumors after drug treatment for 5 days. All animal procedures were conducted under the guidelines approved by the Institutional Animal Care and Use Committee (IACUC) at MD Anderson Cancer Center (Protocol Number 06-87-06139).
CELL CULTURE AND GENERATION OF GR AND EDR CLONES
Human NSCLC cell lines (H1650, HCC827, H1975, and H820) were obtained from ATCC. H1650, HCC827, H1975, and H820 and the corresponding subclones were grown in RPMI medium supplemented with 10% fetal bovine serum (FBS). Human NSCLC cell line H3255 was a gift from Dr. Zhen Fan and were grown in DMEM/F12 medium supplemented with 10% fetal bovine serum (FBS). All cell lines have been tested for mycoplasma contamination and were validated by short tandem repeat (STR) DNA fingerprinting using the AmpFLSTR® Identifiler® PCR Amplification Kit (Life Technologies Grand Island, NY). The STR profiles were compared with ATCC fingerprints and the Cell Line Integrated Molecular Authentication database. HCC827 gefitinib-resistant cells (GR cells) were generated by continuous (> 2 months) culture in standard RPMI medium in the presence of 1 μM gefitinib, followed by single-cell cloning. EDR cells were generated from H1650 cells depleted of EGFR by lentiviral infection. H1650 cells were infected with viruses overnight in the presence of polybrene (10 μg/mL), then cultured in fresh medium for 24 hr and subsequently selected by puromycin (2 μg/mL) for 2 days. The cells were then subcultured and maintained in 1 μg/mL puromycin. After 7 days, most of the cells had died; the few that survived were then cultured with 1 μg/mL puromycin for 3 more months to obtain the EDR clone.
METHOD DETAILS
Constructs and shRNAs
Human EGFR-del19 (purchased from Addgene) and human PKCδ (OriGene) were subcloned into the pCDH-CMV-MCS vector (System Biosciences). Kinase-dead EGFR del19 was constructed by site-directed mutagenesis. In brief, WT EGFR ORF with a C-terminus Flag-tag was amplified and subcloned it into the pCDH-CMV vector. The K721A mutation (kinase dead) was generated using the QuikChange Site-Directed Mutagenesis Kit (Agilent Technologies) following the manufacturer’s protocol. After verification of the K721A mutation by DNA sequencing, we used both WT and K721A mutant as template to further prepare the exon 19 deletion mutant lacking amino acids 722–726 (ELREA) using the same kit to generate the EGFR-del19 and EGFR-del19-KD constructs, respectively. PKCδ-NLSm1 and NLSm3 was generated from human wide-type PKCδ vector. Each construct was verified by sequencing before use. Human EGFR shRNAs and scrambled control shRNA were constructed and described previously42. Human PKCδ shRNAs were obtained from Sigma-Aldrich.
Cell Counting and Cell Viability Assays
Cellular responses to the treatments were estimated by cell counting or cell viability assay. To count the cells with a hemocytometer, cells were seeded on six-well plates (5 × 10⁴ cells/well) and cultured for the indicated period. For the synthetic lethal screen, H1650 cells were seeded in 24-well plates in RPMI 1640 medium containing 10% FBS overnight, then treated with the respective agent(s) for 3 days. Viable cells were identified by the Cell Counting Kit-8 (Donjindo) according to the manufacturer’s protocol. For the validated cell viability assays, cells were seeded in 24-well plates in RPMI 1640 medium containing 10% FBS overnight, then treated with the respective agent(s). After the indicated days, cells were washed with PBS, fixed with ice-cold methanol, and stained with 0.5% crystal violet. Crystal violet was dissolved in acetic acid and optical density of each well measured at 570 nm (OD570) using an ELISA plate reader. The average OD570 of untreated cells was set to 100%. The percentage of treated cells that were viable were then calculated accordingly. The median inhibitory concentration (IC50) for each drug was determined from the dose-effect relationship at four or five concentrations of each drug using the CompuSyn software (version 1.0.1; CompuSyn, Inc.) by the method of Chou and Martin based on the median-effect principle and plot. Data are expressed as percentage of control cells and mean ± s.d. of three independent experiments. The interactions of two drug treatments were evaluated by the Chou-Talalay combination indices (Chou, 2006).
Immunoprecipitation and Western Blot Analysis
Immunoprecipitation (IP) and Western blot (WB) analysis were performed as previously described42. Briefly, cells were washed twice with phosphate-buffered saline solution (PBS), lysed in lysis buffer, briefly sonicated, and then subjected to IP-WB. For Western blot analysis, proteins were separated by sodium dodecyl sulfate electrophoresis on a 10% or 12% polyacrylamide gel and transferred onto polyvinylidene fluoride membranes (Invitrogen). After overnight incubation with primary antibody, washing, and incubation with secondary antibodies, blots were developed with a chemiluminescence system (Pierce).
Protein Kinase Cδ (PKCδ) Kinase Activity Assay
PKCδ was immunoprecipitated (IP) from HCC827 cells expressing WT PKCδ or NLS mutant (NLSm1 and NLSm3) and immunoprecipitates were then subjected to Western blot (WB) analysis and PKC kinase activity assay using a PKC kinase activity kit (Enzo Life Sciences, ADI-EKS-420A). The PKC activities measured were normalized to the quantitated levels of PKCδ protein expression from IP-WB.
Antibody Array
The Phospho-Explorer Antibody Array images were analyzed with the GenePixTM Pro 4.0 image analysis software. Fluorescence intensity measurements were normalized against local background, and cytoskeletal antibodies (β-actin and GAPDH) were used for normalization of total protein quantity between samples.
Biological Network and Pathway Analysis
Biological networks and pathways related to the 27 mediators were analyzed with Ingenuity Pathway Analysis (IPA) software (Qiagen). All mediators identified by the antibody array analysis were uploaded into the IPA software. For the analysis of networks and pathways, the cutoff values were set as p < 10−8.
Confocal Microscopy Analysis
Confocal microscopy analysis was performed as described previously42. Briefly, drug-treated cells were washed with PBS and fixed in 100% methanol for 20 min at −20°C. Cells were then subjected to permeabilization with 0.5% Triton X-100 with 3% bovine serum albumin overnight at 4°C. After that, cells were incubated with primary antibodies overnight at 4°C, washed with PBS and further incubated with the appropriate secondary antibody. Nuclei were counterstained with 4,6-diamidino-2-phenylindole (DAPI) before mounting. Confocal fluorescence images were captured using a Zeiss LSM710 laser microscope. The relative intensity of PKCδ in nuclei to that in the whole cell was determined by ImageJ version 1.49 software.
Immunohistochemical Staining of Human NSCLC Clinical Specimens
A rabbit monoclonal PKCδ antibody (clone ERR17075, ab182126, Abcam, diluted at 1:2000) raised against PKCδ was used according to the product instructions. IHC staining was performed automatically with a Leica Bone-MAX (Leica Microsystems GmbH) according to the manufacturer’s standard protocol. The slides were counterstained with hematoxylin. The immunoreactivity of nPKCδ was ranked as previously described (Xia et al., 2004). Briefly, nPKCδ immunoreactivity was categorized into four groups (score 0, 1, 2, and 3) according to a well-established system in which H score was generated by the percentage of positive tumor cells. The scores with their indicating percentage of positive cells are score 0 (0%), 1 (less than 50%), 2 (51–75%), 3 (more than 75%). All slides were independently viewed and scored by two pathologists. Slides in which there was a scoring discrepancy were reevaluated and reconciled by a two-headed microscope. The probability of cancer recurrence in low (score = 0 and 1) and high (score = 2 and 3) nPKCδ populations was determined by Kaplan Meier analysis. The Mantel-Cox (log rank) p is reported (with p < 0.05 considered significant). For T790M mutation analysis, exons 20 of the EGFR gene in all cases were sequenced by the Sanger method. Briefly, DNA was isolated from formalin-fixed paraffin embedded (FFPE) tumor by using a QuickExtract™ FFPE DNA Extraction Kit (Epicentre). DNA fragment containing EGFR exons 20 were amplified with intron-based primers EGFR-20F (5′-GTCCCTGTGCTAGGTCTTTT-3′) and EGFR-20R (5′-ATCTCCCTTCCCTGATTAC-3′). PCR reaction was performed at 95°C for 5 min, followed by 40 cycles at 95°C for 15 s, 56°C for 30 s, and 72°C for 30 s, then by 10 min extension at 72 °C. The PCR products were bidirectional sequenced on ABI 3730 XL sequencers (Applied Biosystems) with ABI BigDye Terminator v3.1 Cycle Sequencing Kits and analyzed by Chromas Sequence Scanner Software. GenBank NM_005228 was used as the reference DNA for nucleotide positions.
QUANTIFICATION AND STATISTICAL ANALYSIS
Statistical Analysis
All experiments were repeated at least three times unless otherwise indicated. Error bars represent standard deviation (SD). Student’s t test was used to compare two groups of independent samples. A p value < 0.05 was considered statistically significant. Kaplan-Meier analysis and Log-rank (Mantel-Cox) test were used to evaluate the statistical significance for comparison of survival curves.
Supplementary Material
KEY RESOURCES TABLE
| REAGENT or RESOURCE | SOURCE | IDENTIFIER |
|---|---|---|
| Antibodies | ||
| EGFR | Thermo Fisher Scientific | MS-400 |
| EGFR (phospho Y1068) | Abcam | ab5644 |
| EGFR (phospho Y1086) | Abcam | Ab5650 |
| EGFR (phospho Y1173) | Cell Signaling Technology | 4407 |
| EGFR (phospho Y845) | Cell Signaling Technology | 6963 |
| Her2 | Cell Signaling Technology | 2165 |
| Axl | Genetex | GTX108560 |
| Phospho-p44/42 MAPK (Erk1/2) (Thr202/Tyr204) | Cell Signaling Technology | 4370 |
| ERK 1/2 | Santa Cruz | SC-514302 |
| Phospho-Akt (Ser473) | Cell Signaling Technology | 3787 |
| Akt | Cell Signaling Technology | 9272 |
| Phospho-NF-kB p65 (Ser536) | Cell Signaling Technology | 3036 |
| IkBa | Cell Signaling Technology | 9242 |
| β-Actin | Sigma-Aldrich | A2228 |
| Alpha tubulin | Genetex | GTX27291 |
| PKC delta (WB, IF, and IHC) | Abcam | AB182126 |
| PKC delta (IF) | Novopro Bioscience | LS-C199448 |
| PKC delta (IP) | Santa Cruz | SC-937 |
| PKC delta (phospho T505) | Abcam | ab60992 |
| Ki67 | Abcam | ab15580 |
| Cleaved PARP | Cell Signaling Technology | 5625 |
| Histone H3 | Genetex | GTX122148 |
| phospho-PLCG1 (pTyr 783) | Sigma | SAB4503827 |
| phospho-PLCG2 (pTyr 759) | Cell Signaling Technology | 3874 |
| PLCg2 | Cell Signaling Technology | 3872 |
| Phospho-Histone H2A.X (Ser139) | Cell Signaling Technology | 9718 |
| Biological Samples: Patient-Derived Xenograft Tumor | ||
| TC386 | MDACC | N/A |
| TM0204 | Jackson laboratory | N/A |
| Chemicals, Peptides, and Recombinant Proteins | ||
| ICG-001 | Selleckchem | S2662 |
| PNU-74654 | Sigma | P0052 |
| Resveratrol | Selleckchem | S1396 |
| Aspirin | Sigma | A2093 |
| Sulindac | Sigma | S8139 |
| KN-62 | EMD Millipore | 422706 |
| Dvl-PDZ | EMD Millipore | 322338 |
| NSC668036 | Sigma | SML0046 |
| BMS-345541 | Selleckchem | S8044 |
| SP600125 | Selleckchem | S1460 |
| Trametinib | ApexBio Technology | A3887 |
| NFAT inhibitor | Cayman Chemical | 13855 |
| Enzastaurin | Selleckchem | S1055 |
| Go6983 | R & D Systems | 2285 |
| Sotrastaurin | Chemscene | SC-0090 |
| U-73122 | Cayman Chemical | 70740 |
| Edelfosine | R & D Systems | 3022 |
| FIPI | Cayman Chemical | 13563 |
| VU0359595 | Sigma | SML0566 |
| IWP2 | Cayman Chemical | 13951 |
| IWP4 | Cayman Chemical | 13954 |
| LGK-974 | Xcess Biosciences | M60106 |
| Gefitinib | LC Lab | G-4408 |
| Erlotinib | LC Lab | E-4007 |
| AZD9291 | Selleckchem | S72975 |
| Lapatinib | LC Lab | L-4804 |
| R428 | Medchem Express | HY-15150 |
| Critical Commercial Assays | ||
| Phospho Explorer Antibody Array | Full Moon Biosystems | PEX100 |
| Human EGFR Phosphorylation Antibody Array | Abcam | AB134005 |
| Experimental Models: Cell Lines | ||
| H1650 | ATCC | CRL-5883 |
| HCC827 | ATCC | CRL-2868D |
| H1975 | ATCC | CRL-5908DQ |
| H820 | ATCC | HTB-181 |
| Experimental Models: Organisms/Strains | ||
| BALB/c nude mice | Jackson laboratory | N/A |
| BALB/c SCID mice | Jackson laboratory | N/A |
| Recombinant DNA | ||
| pLKO-shPRKCD #1 | Sigma-Aldrich | TRCN0000379731 |
| pLKO-shPRKCD #2 | Sigma-Aldrich | TRCN0000272637 |
| pCDH-CMV-MCS-EF1-EGFR del19 | This paper | N/A |
| pCDH-CMV-MCS-EF1-EGFR del19-kd | This paper | N/A |
| pCDH-CMV-MCS-EF1-EGFR L858R/T790M | This paper | N/A |
| pCDH-CMV-MCS-EF1-PRKCD | This paper | N/A |
| pCDH-CMV-MCS-EF1-PRKCD NLSm1 | This paper | N/A |
| pCDH-CMV-MCS-EF1-PRKCD NLSm3 | This paper | N/A |
| Software and Algorithms | ||
| Ingenuity Pathway Analysis | QIAGEN Bioinformatics | N/A |
Significance.
The heterogeneity of tyrosine kinase inhibitor (TKI) resistance remains a challenge in treating TKI-intrinsic or acquired resistant EGFR-mutant non-small cell lung cancer (NSCLC). In the current study, we report EGFR heterodimer-mediated nuclear PKCδ as a common mediator shared by multiple TKI-resistance mechanisms, and it is upregulated in a significant proportion of patients (~41.5%) with TKI-resistant NSCLC. Inhibition of PKCδ sensitized NSCLC tumors with mutant EGFR to first and third-generation TKI. These results provide mechanistic insights into the role of the EGFR-PKCδ axis in TKI resistance and suggest an EGFR addiction in TKI-resistant EGFR-mutant NSCLC.
Highlights.
PKCδ is a common mediator shared by multiple TKI-resistant pathways
TKI-induced EGFR heterodimers promote nuclear PKCδ and TKI resistance
Nuclear PKCδ associates with worse TKI response in EGFR-mutant NSCLC patients
Inhibition of PKCδ sensitizes resistant EGFR-mutant NSCLC to EGFR TKI
ACKNOWLEDGMENTS
This study was funded in part by the following: grants from the US National Institutes of Health (MD Anderson Cancer Center support grant P30CA016672); The MD Anderson Cancer Center-China Medical University and Hospital Sister Institution Fund; the Ministry of Health and Welfare, China Medical University Hospital Cancer Research Center of Excellence (MOHW107-TDU-B-212-114024 and MOHW107-TDU-B-112015); Center for Biological Pathways; and Chang Gung Memorial Hospital (grant CMRPG3D1911 to Y.-F.F.). S.-S.C. was supported by the CPRIT Research Training Program (RP140106 and RP170067).
This work is in memoriam of Mr. Nan-Tu Huang for his courageous fight against lung cancer.
Footnotes
DECLARATION OF INTERESTS
The authors declare no competing interests.
SUPPLEMENTAL INFORMATION
Supplemental Information includes six figures and four tables and can be found with this article online at https://doi.org/10.1016/j.ccell.2018.11.007.
REFERENCES
- Abera MB, and Kazanietz MG (2015). Protein kinase Calpha mediates erlotinib resistance in lung cancer cells. Mol. Pharmacol 87, 832–841. [DOI] [PMC free article] [PubMed] [Google Scholar]
- Allen-Petersen BL, Carter CJ, Ohm AM, and Reyland ME (2014). Protein kinase Cdelta is required for ErbB2-driven mammary gland tumorigenesis and negatively correlates with prognosis in human breast cancer. Oncogene 33, 1306–1315. [DOI] [PMC free article] [PubMed] [Google Scholar]
- Anido J, Matar P, Albanell J, Guzman M, Rojo F, Arribas J, Averbuch S, and Baselga J (2003). ZD1839, a specific epidermal growth factor receptor (EGFR) tyrosine kinase inhibitor, induces the formation of inactive EGFR/HER2 and EGFR/HER3 heterodimers and prevents heregulin signaling in HER2-overexpressing breast cancer cells. Clin. Cancer Res 9, 1274–1283. [PubMed] [Google Scholar]
- Basu A, and Pal D (2010). Two faces of protein kinase Cdelta: the contrasting roles of PKCdelta in cell survival and cell death. ScientificWorldJournal 10, 2272–2284. [DOI] [PMC free article] [PubMed] [Google Scholar]
- Bivona TG, Hieronymus H, Parker J, Chang K, Taron M, Rosell R, Moonsamy P, Dahlman K, Miller VA, Costa C, et al. (2011). FAS and NF-kappaB signalling modulate dependence of lung cancers on mutant EGFR. Nature 471, 523–526. [DOI] [PMC free article] [PubMed] [Google Scholar]
- Camidge DR, Pao W, and Sequist LV (2014). Acquired resistance to TKIs in solid tumours: learning from lung cancer. Nat. Rev. Clin. Oncol 11, 473–481. [DOI] [PubMed] [Google Scholar]
- Chattopadhyay A, Vecchi M, Ji Q, Mernaugh R, and Carpenter G (1999). The role of individual SH2 domains in mediating association of phospholipase C-gamma1 with the activated EGF receptor. J. Biol. Chem 274, 26091–26097. [DOI] [PubMed] [Google Scholar]
- Chou TC (2006). Theoretical basis, experimental design, and computerized simulation of synergism and antagonism in drug combination studies. Pharmacol. Rev 58, 621–681. [DOI] [PubMed] [Google Scholar]
- Dutil EM, Toker A, and Newton AC (1998). Regulation of conventional protein kinase C isozymes by phosphoinositide-dependent kinase 1 (PDK-1). Curr. Biol 8, 1366–1375. [DOI] [PubMed] [Google Scholar]
- Elkabets M, Pazarentzos E, Juric D, Sheng Q, Pelossof RA, Brook S, Benzaken AO, Rodon J, Morse N, Yan JJ, et al. (2015). AXL mediates resistance to PI3Kalpha inhibition by activating the EGFR/PKC/mTOR axis in head and neck and esophageal squamous cell carcinomas. Cancer Cell 27, 533–546. [DOI] [PMC free article] [PubMed] [Google Scholar]
- Ercan D, Zejnullahu K, Yonesaka K, Xiao Y, Capelletti M, Rogers A, Lifshits E, Brown A, Lee C, Christensen JG, et al. (2010). Amplification of EGFR T790M causes resistance to an irreversible EGFR inhibitor. Oncogene 29, 2346–2356. [DOI] [PMC free article] [PubMed] [Google Scholar]
- Ferrer-Soler L, Vazquez-Martin A, Brunet J, Menendez JA, De Llorens R, and Colomer R (2007). An update of the mechanisms of resistance to EGFR-tyrosine kinase inhibitors in breast cancer: gefitinib (Iressa)-induced changes in the expression and nucleo-cytoplasmic trafficking of HER-ligands (Review). Int. J. Mol. Med 20, 3–10. [PubMed] [Google Scholar]
- Haber DA, Gray NS, and Baselga J (2011). The evolving war on cancer. Cell 145, 19–24. [DOI] [PubMed] [Google Scholar]
- Hao C, Wang L, Peng S, Cao M, Li H, Hu J, Huang X, Liu W, Zhang H, Wu S, et al. (2015). Gene mutations in primary tumors and corresponding patient-derived xenografts derived from non-small cell lung cancer. Cancer Lett. 357, 179–185. [DOI] [PMC free article] [PubMed] [Google Scholar]
- Hirsch FR, Varella-Garcia M, and Cappuzzo F (2009). Predictive value of EGFR and HER2 overexpression in advanced non-small-cell lung cancer. Oncogene 28 (Suppl 1), S32–S37. [DOI] [PubMed] [Google Scholar]
- Janjigian YY, Smit EF, Groen HJ, Horn L, Gettinger S, Camidge DR, Riely GJ, Wang B, Fu Y, Chand VK, et al. (2014). Dual inhibition of EGFR with afatinib and cetuximab in kinase inhibitor-resistant EGFR-mutant lung cancer with and without T790M mutations. Cancer Discov. 4, 1036–1045. [DOI] [PMC free article] [PubMed] [Google Scholar]
- Janne PA, Yang JC, Kim DW, Planchard D, Ohe Y, Ramalingam SS, Ahn MJ, Kim SW, Su WC, Horn L, et al. (2015). AZD9291 in EGFR inhibitor-resistant non-small-cell lung cancer. N. Engl. J. Med 372, 1689–1699. [DOI] [PubMed] [Google Scholar]
- Ji H, Li D, Chen L, Shimamura T, Kobayashi S, McNamara K, Mahmood U, Mitchell A, Sun Y, Al-Hashem R, et al. (2006). The impact of human EGFR kinase domain mutations on lung tumorigenesis and in vivo sensitivity to EGFR-targeted therapies. Cancer Cell 9, 485–495. [DOI] [PubMed] [Google Scholar]
- Johnson ML, Yu HA, Hart EM, Weitner BB, Rademaker AW, Patel JD, Kris MG, and Riely GJ (2015). Phase I/II study of HSP90 inhibitor AUY922 and Erlotinib for EGFR-mutant lung cancer with acquired resistance to epidermal growth factor receptor tyrosine kinase inhibitors. J. Clin. Oncol 33, 1666–1673. [DOI] [PMC free article] [PubMed] [Google Scholar]
- Leitges M, Gimborn K, Elis W, Kalesnikoff J, Hughes MR, Krystal G, and Huber M (2002). Protein kinase C-delta is a negative regulator of antigen-induced mast cell degranulation. Mol. Cell. Biol 22, 3970–3980. [DOI] [PMC free article] [PubMed] [Google Scholar]
- Li D, Shimamura T, Ji H, Chen L, Haringsma HJ, McNamara K, Liang MC, Perera SA, Zaghlul S, Borgman CL, et al. (2007). Bronchial and peripheral murine lung carcinomas induced by T790M-L858R mutant EGFR respond to HKI-272 and rapamycin combination therapy. Cancer Cell 12, 81–93. [DOI] [PubMed] [Google Scholar]
- Minari R, Bordi P, and Tiseo M (2016). Third-generation epidermal growth factor receptor-tyrosine kinase inhibitors in T790M-positive non-small cell lung cancer: review on emerged mechanisms of resistance. Transl. Lung Cancer Res 5, 695–708. [DOI] [PMC free article] [PubMed] [Google Scholar]
- Mochly-Rosen D, Das K, and Grimes KV (2012). Protein kinase C, an elusive therapeutic target? Nat. Rev. Drug Discov 11, 937–957. [DOI] [PMC free article] [PubMed] [Google Scholar]
- Parekh D, Ziegler W, Yonezawa K, Hara K, and Parker PJ (1999). Mammalian TOR controls one of two kinase pathways acting upon nPKCdelta and nPKCepsilon. J. Biol. Chem 274, 34758–34764. [DOI] [PubMed] [Google Scholar]
- Park KS, Raffeld M, Moon YW, Xi L, Bianco C, Pham T, Lee LC, Mitsudomi T, Yatabe Y, Okamoto I, et al. (2014). CRIPTO1 expression in EGFR-mutant NSCLC elicits intrinsic EGFR-inhibitor resistance. J. Clin. Invest 124, 3003–3015. [DOI] [PMC free article] [PubMed] [Google Scholar]
- Piotrowska Z, Niederst MJ, Karlovich CA, Wakelee HA, Neal JW, Mino-Kenudson M, Fulton L, Hata AN, Lockerman EL, Kalsy A, et al. (2015). Heterogeneity underlies the emergence of EGFRT790 wild-type clones following treatment of T790M-positive cancers with a third-generation EGFR inhibitor. Cancer Discov. 5, 713–722. [DOI] [PMC free article] [PubMed] [Google Scholar]
- Reyland ME (2007). Protein kinase Cdelta and apoptosis. Biochem. Soc. Trans 35, 1001–1004. [DOI] [PubMed] [Google Scholar]
- Rosse C, Linch M, Kermorgant S, Cameron AJ, Boeckeler K, and Parker PJ (2010). PKC and the control of localized signal dynamics. Nat. Rev. Mol. Cell Biol 11, 103–112. [DOI] [PubMed] [Google Scholar]
- Rotow J, and Bivona TG (2017). Understanding and targeting resistance mechanisms in NSCLC. Nat. Rev. Cancer 17, 637–658. [DOI] [PubMed] [Google Scholar]
- Shen J, Xia W, Khotskaya YB, Huo L, Nakanishi K, Lim SO, Du Y, Wang Y, Chang WC, Chen CH, et al. (2013). EGFR modulates microRNA maturation in response to hypoxia through phosphorylation of AGO2. Nature 497, 383–387. [DOI] [PMC free article] [PubMed] [Google Scholar]
- Sos ML, Koker M, Weir BA, Heynck S, Rabinovsky R, Zander T, Seeger JM, Weiss J, Fischer F, Frommolt P, et al. (2009). PTEN loss contributes to erlotinib resistance in EGFR-mutant lung cancer by activation of Akt and EGFR. Cancer Res. 69, 3256–3261. [DOI] [PMC free article] [PubMed] [Google Scholar]
- Stempka L, Girod A, Muller HJ, Rincke G, Marks F, Gschwendt M, and Bossemeyer D (1997). Phosphorylation of protein kinase Cdelta (PKCdelta) at threonine 505 is not a prerequisite for enzymatic activity. Expression of rat PKCdelta and an alanine 505 mutant in bacteria in a functional form. J. Biol. Chem 272, 6805–6811. [DOI] [PubMed] [Google Scholar]
- Suda K, Rivard CJ, Mitsudomi T, and Hirsch FR (2016). Heterogeneity in tumors and resistance to EGFR TKI therapy-letter. Cancer Res. 76, 3109–3110. [DOI] [PMC free article] [PubMed] [Google Scholar]
- Tomasello C, Baldessari C, Napolitano M, Orsi G, Grizzi G, Bertolini F, Barbieri F, and Cascinu S (2018). Resistance to EGFR inhibitors in non-small cell lung cancer: clinical management and future perspectives. Crit. Rev. Oncol. Hematol 123, 149–161. [DOI] [PubMed] [Google Scholar]
- Xia W, Chen JS, Zhou X, Sun PR, Lee DF, Liao Y, Zhou BP, and Hung MC (2004). Phosphorylation/cytoplasmic localization of p21Cip1/WAF1 is associated with HER2/neu overexpression and provides a novel combination predictor for poor prognosis in breast cancer patients. Clin. Cancer Res 10, 3815–3824. [DOI] [PubMed] [Google Scholar]
- Zhang Z, Lee JC, Lin L, Olivas V, Au V, LaFramboise T, Abdel-Rahman M, Wang X, Levine AD, Rho JK, et al. (2012). Activation of the AXL kinase causes resistance to EGFR-targeted therapy in lung cancer. Nat. Genet 44, 852–860. [DOI] [PMC free article] [PubMed] [Google Scholar]
Associated Data
This section collects any data citations, data availability statements, or supplementary materials included in this article.