Abstract
Objective:
This study assessed the association between tendon stiffness on sonoelastography and grades of tendinopathy on MRI in patients with supraspinatus tendinopathy.
Methods:
25 consecutive adult patients with clinically suspected supraspinatus tendinopathy and no prior history of trauma referred for MRI of the shoulder were selected for this study. The supraspinatus tendinopathy was graded in consonance with MRI findings (Grade I, normal; Grade II, mild tendinopathy; Grade III, moderate tendinopathy; and Grade IV, marked tendinopathy). Strain ratios were evaluated. Spearman rank correlation test was used, to analyze the association of the MRI grade with strain ratios.
Results:
Out of 25 patients, Grade I changes on MRI were found in 5 patients (20.0%), Grade II tendinopathy in 13 patients (52.0%), Grade III in 6 patients (24.0%), and Grade IV in 1 patient (4.0%). The mean sonoelastography strain ratio of supraspinatus tendons were 0.76 ± 0.32 in patients with Grade I, 0.59 ± 0.40 in Grade II, 0.31 ± 0.10 in Grade III and 0.15 ± 0.02 in Grade IV patients respectively. The strain ratios showed good correlation with the MRI grade p < 0.05.
Conclusion:
We compared the MRI findings of supraspinatus tendinopathy with sonoelastography strain ratios. Sonoelastography showed good correlation with MRI.
Advances in knowledge:
Sonoelastography in supraspinatus tendinopathy may help in predicting improvement or worsening of the tendon health at the tissue level. Therefore, there is a possibility that it has use in the rehabilitation of professionals suffering from supraspinatus tendinopathy.
Introduction
Rotator cuff tendinopathies are a prevalent cause of reduced activity or disability in the general population. Patients may present with decreased shoulder function such as painful shoulder movements, a painful arc, weakness, discomfort, and stiffness. On clinical evaluation, weak external rotators, a weak supraspinatus, and signs of impingement may be found.1
Sonoelastography (SE) by measuring stiffness helps to assess the biomechanical and structural properties of tissues.2 Ultrasound (USG) is an easily accessible imaging tool that relies on alteration of echogenicity for diagnosis of tendinopathy. However, the abnormal tendon may have similar echogenicity to that of the surrounding healthy tissues, making diagnosis difficult in tendinopathy. MRI takes into account change in signal pattern while CT looks at changes in attenuation. These modalities lack the capability of showing very early changes in tendinopathy, which involve alteration of stiffness of the tendon. In the present study, however, we could not come across a case where SE was abnormal and MRI was normal in a symptomatic patient. We undertook this study in order to further understand the utility of SE in the detection of supraspinatus tendinopathies and comparing SE findings with that of MRI.
Methods and Materials
Subjects
Ours was a prospective cross-sectional study, performed over a period of 15 months on 25 consecutive patients (Table 1) (7 females, 18 males; mean age 41.7 years; age range 25–75 years) who had history of mild to moderate discomfort during activity with no significant motion limitation and tenderness over the area of the greater tuberosity, suggested rotator cuff tendinopathy. In all patients, blunt trauma/ open wounds, full thickness supraspinatus tendon (SST) tear, or a previous surgery, and other general contraindications for MRI were excluded. An informed written consent from the patient was taken. The patients were first evaluated with real-time SE followed by MRI. The Ethical Committee and Review Board of our Institution (Department of Radio-diagnosis, Bharati Hospital and Research Centre, Pune, India) approved the study.
Table 1.
Clinical characteristics of the patients
| Variables | Total (N = 25) |
| Sex | |
| Male | 18 |
| Female | 7 |
| Mean age (years) | 41.7 |
| Location/side | |
| Right | 13 |
| Left | 12 |
Real-time sonoelastography
An Affiniti 70 ultrasound machine (Philips, Amsterdam, Netherlands) with a 5–12 MHz linear array transducer was used. Two radiologists were present at the time of examination; a senior radiologist would then confirm the final results of USG & SE. This helped to minimize any single observer bias. The patient was positioned on a chair, with the arm in the internal rotation position and the forearm positioned in pronation on the patient’s back. The examiner would stand behind the patient. The transducer was maintained perpendicular to the SST in order to avoid anisotropy and long axis view images of the SST were obtained. The long axis view corresponded to the coronal MR image plane. In patients with discomfort, a modified Crass position (Figure 1) as used by Jon A. Jacobson3 was adapted, where the patient’s ipsilateral hand is placed on the ipsilateral hip, allowing easy visualization of the rotator interval.
Figure 1. .
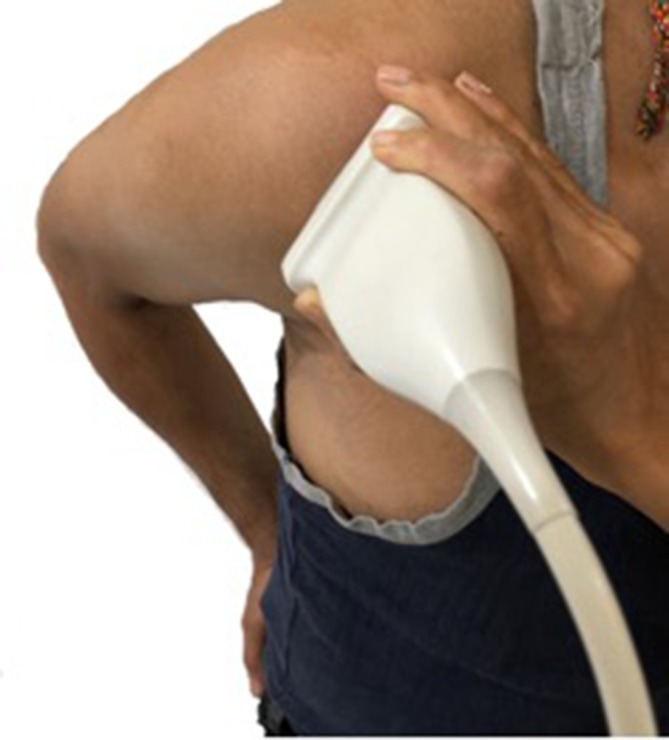
Supraspinatus tendon (long axis). Transducer placement with shoulder in modified Crass position.
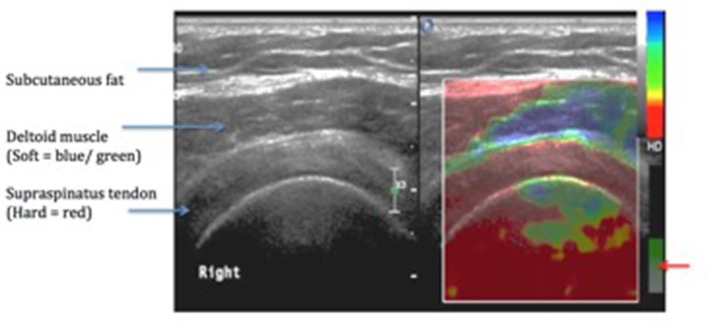
The area from the most anterior to the most posterior portion of the SST was evaluated in this position and static images were acquired when essential. The estimation of the tissue elasticity distribution was done in real time and the results of the analysis were denoted in color over the conventional B-mode image using standardized settings. SE images were acquired when the transducer was perpendicular to the tendons with mild compression, with the amount of compression based on the quality factor indicated on the screen of the ultrasound system. A 256° color map was superimposed on the B mode images. This was designed so that soft tissues would indicate a blue color and hard tissues indicated a red color (Figure 2). They were assessed for the presence of focal lesions, which were described as green to blue (soft) areas on the SE color map. Focal lesions were counted and evaluated according to the following grading system (modified from the criteria described by De Zordo et al4): Grade I, no focal lesion or red (hard) tendon; Grade II, one focal lesion; Grade III, two focal lesions; and Grade IV, more than two focal lesions. Stiffness was assessed with the strain ratio. ROI (Region of interest) 'A' was kept on the abnormal focal region on the tendon (appearing green to blue, indicating area of softening) and ROI 'B' was kept on the normal appearing portion of the tendon (reference area). (Most machines compute strain ratio as B/A).
Figure 2. .
An elastogram of a normal supraspinatus tendon. [Quality factor for maintaining similar level of pressure on the probe–(Red arrow)].
Harder areas, which display little or almost no strain, are characterized by lower strain values than those of softer areas.5 Therefore, according to the above formula,6 the strain ratio for inclusions that are harder than the reference tissue will be >1 and softer inclusions will have strain ratio between 0 and 1.
Magnetic resonance imaging
The MRI examination for the evaluation of rotator cuff/SST pathology was performed based on a standard protocol. The patients were placed supine with the arm externally rotated. The shoulder coil appropriately placed over the shoulder. According to a study by Madden,7 an externally rotated position of the arm during MRI scan altered the orientation of the SST to the main magnetic field, reducing the incidence of the magic angle (55°) effect. Proton density, T 1 weighted, T 2 weighted and fat-saturated spin echo images were obtained in oblique coronal, axial and sagittal imaging planes (Table 2) on the Achieva 1.5T SE (Philips, Amsterdam, Netherlands). In order to avoid misinterpretation due to magic angle artefact, abnormal signal intensity on proton density images were compared with that on T2 weighted images. The magic angle effect has a weaker signal on long TE (time to echo) images as compared to the signal on short TE images.7 One experienced musculoskeletal radiologist evaluated the MR images. Grades of supraspinatus tendinopathy were modified from criteria described by Sein et al.8 In the coronal planes, abnormal signal intensity on T 2 weighted images were classified from Grades I to IV according to the extent of the signal changes from anterior coronal to posterior coronal images. Grade I was a normal tendon, no abnormal signal intensity. In Grade II, signal changes was less than 25% of the tendon thickness; in Grade III, less than 50%; and Grade IV, more than 50%.
Table 2.
MR protocol followed in our study
| Sequence | Plane | Time of repetition (ms) | Time of echo (ms) | Slice thickness (mm) | Matrix |
| T1 | Axial | Shortest | 18 | 3.0 | 480 |
| PDFS | Axial | Shortest | 30 | 3.0 | 480 |
| T1 | Coronal | 500–650 | 20 | 3.0 | 512 |
| PDFS | Coronal | Shortest | 30 | 3.0 | 512 |
| STIR | Coronal | Shortest | 30 | 3.0 | 400 |
| GRE | Coronal | Shortest | 13.8 | 3.0 | 320 |
| T1 | Sagittal | Shortest | 18 | 3.0 | 576 |
| STIR | Sagittal | Shortest | 30 | 3.0 | 400 |
Statistical analysis
The collected data were coded and entered in Microsoft Excel sheet. The data were evaluated using SPSS (Statistical Package for social sciences) v. 20.0 software. Spearman rank correlation is a test that is used to measure the degree of association between two variables, where the value r =+1 means a perfect positive correlation and the value r = −1 means a perfect negative correlation (Value of r; −1 to −0.5 or +1 to +0.5 means a strong association; −0.5 to −0.3 or +0.3 to +0.5 means a moderate association, −0.3 to −0.1 or +0.1 to +0.3 means a weak association and −0.1 to +0.1 means none or very weak association). We used this test to evaluate the association of the MRI grade with strain ratios. The level of significance was set at p < 0.05.
Results
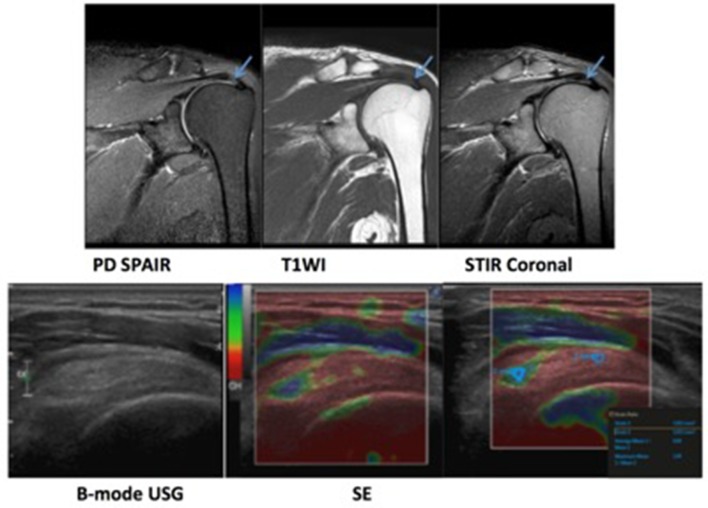
In our study, 25 SSTs were classified using a modified scale of Grade I to IV, according to the MRI findings. Out of 25 patients, Grade I signal abnormality on MRI (normal SST) was found in a little more than a quarter of the patients, Grade II tendinopathy in a little more than half the patients, Grade III in one-fourth of the patients and Grade IV in only one patient. The mean strain ratio, as a guide to stiffness, was 0.54 ± 0.36 in diseased tendons. The strain ratio went on decreasing with increasing severity of tendinopathy (Figure 3) Perfect negative correlation (r = –0.508, p = 0.0094); was found between the MRI grade and the strain ratio. The association between the two variables was statistically significant (p < 0.05). (Table 3, Figure 4).
Figure 3. .
A 75-year-old male patient with chronic left shoulder pain. MRI revealed supraspinatus tendinopathy in the form of a globular high signal (arrow). Ultrasound revealed mildly thickened tendon with irregular fibre striations. Sonoelastography revealed an area of softening (blue/green area). Strain ratio was found to be 0.58 (indicative of softening).
Table 3.
Association between MRI and sonoelastography strain ratios
| MRI grade | No. of patients (N = 25) | Strain ratio |
| I | 5 | 0.76 ± 0.32 |
| II | 13 | 0.59 ± 0.40 |
| III | 6 | 0.31 ± 0.10 |
| IV | 1 | 0.15 ± 0.02 |
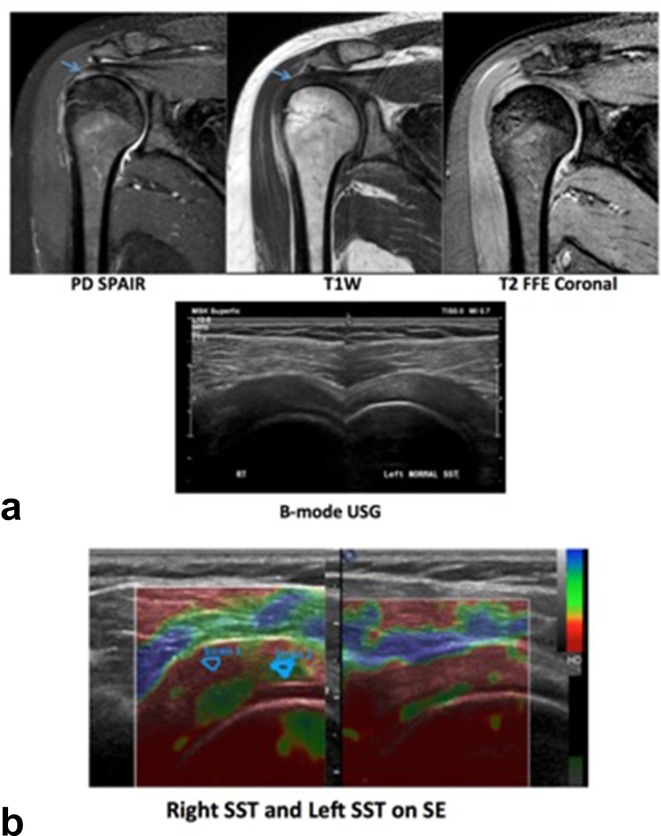
Figure 4. .
(a) A 35-year-old female patient with complaints of right shoulder pain. MRI revealed mild thickening with increased signal intensity in right supraspinatus tendon suggestive of tendinosis. (b) Ultrasound of bilateral rotator cuff tendons revealed, a bulky right SST andnormal left SST. Softening was noted on SE on the right. Strain ratio of left SST was 0.96 and that on the right was 0.49. SE, sonoelastography; SST, supraspinatus tendon.
Discussion
Among the Rotator cuff tendons, the SST is a commonly injured tendon, which is also commonly affected by tendinopathy. MRI is sensitive and currently the gold-standard in the diagnosis of rotator cuff tendinopathy. Tendinopathy occurs due to collagen breakdown, which softens and weakens the tendon, and may finally lead to tendon tear or rupture.9 A study by Kjellin et al10 revealed that eosinophilic, fibrillar and mucoid degeneration/ scarring corresponds with the increased signal intensity on PD-weighted images and an unclear margin at the articular side of the SST. SE shows good agreement with histologic changes in tendon degeneration.11 SE has shown changes of tendinopathy in symptomatic Achilles tendons,12 SSTs13 and extensors of the elbow,14 and can be an efficient tool for follow-up studies. Palle et al15 assessed elasticity of the Achilles tendon using conventional qualitative elastography. They reported that tendons with tendinopathy were softer (green to blue areas) than normal tendons. Joong-Bae Seo et al13 showed that sonoelastography was helpful in detecting the intratendinous alterations of the SST. While we compared tendon on tendon, other workers have compared fat to tendon and a gel pad to tendon16 and even bone to tendon.17 A study done by Sang-Uk Lee16 in 2016 evaluated the fat/tendon and pad/tendon strain ratios. They concluded that the pad/tendon strain ratio is more useful than the fat/tendon strain ratio for the evaluation of supraspinatus tendinopathy.
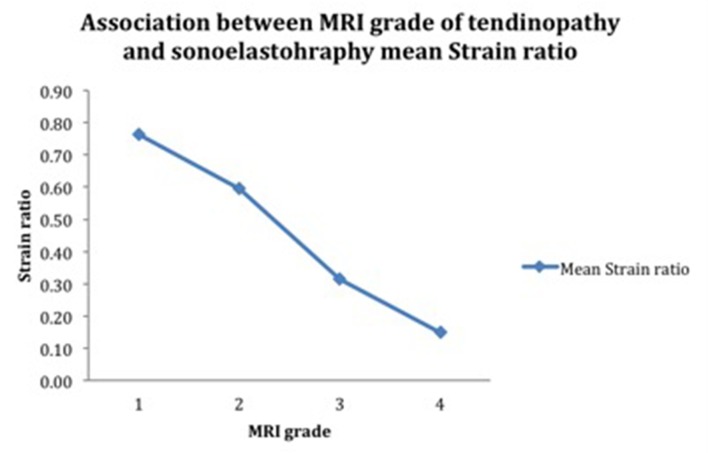
In our study, we found a moderate to strong linear association between the MRI grade and the stiffness indicated by the strain ratios (p < 0.05). There was a perfect negative correlation (r = –0.508, p = 0.0094) between grade of tendinopathy and SE strain ratio. As tendinopathy increased, tendons became softer which was indicated by the reduced strain ratio values (Figure 5).
Figure 5. .
Correlation between MRI grade and sonoelastography in supraspinatus tendinopathy. There was a moderate to strong association between grade of tendinopathy and sonoelastography strain ratio.
Limitations of our study included firstly a small sample size population. Secondly, SE is an operator-dependent study, however, to overcome this, we constantly monitored our level of pressure on the probe with one eye always on the quality factor level (displayed on the right corner of the screen). A learning curve is required as with any new modality, which was attained over a period of time.
The results of our study showed a strong correlation of strain elastography findings with MRI. We believe that strain elastography would be of advantage in the early recognition of changes of tendinopathy/tendon softening which could help to initiate early rehabilitation before the commencement of inflammatory or degenerative processes. This in the future would allow sport persons to modify their exercise model and prevent tendon damage with the initiation of early rehabilitation.18–20 However, this has not been proven in our study and is a possibility.
Conclusion
Our study shows good association of findings of tendon stiffness, with that of tendinopathy on MRI. Hence, SE shows moderate to strong association with MRI findings of tendinopathy. SE can thus be used as an add-on for the diagnosis of rotator cuff tendinopathy. It is a good method for estimation of tendon elasticity as well as imaging diagnosis. It is an easily accessible, quick and not too expensive a technique. Further follow-up studies are recommended for monitoring post-therapy changes in tendon strain ratios. SE has potential to detect abnormalities in the tendons prior to USG and MRI. SE character of a tendon is a new exciting parameter and its value in diagnosis of tendinopathy earlier than MRI remains to be ascertained.
Contributor Information
Aishvarya Vasishta, Email: aishvarya19@gmail.com.
Abhimanyu Kelkar, Email: aishvarya19@gmail.com.
Priscilla Joshi, Email: aishvarya19@gmail.com.
Renuka Hapse, Email: aishvarya19@gmail.com.
REFERENCES
- 1. Shin KM . Partial-thickness rotator cuff tears . Korean J Pain 2011. ; 24 : 69 . doi: 10.3344/kjp.2011.24.2.69 [DOI] [PMC free article] [PubMed] [Google Scholar]
- 2. Domenichini R , Pialat JB , Podda A , Aubry S . Ultrasound elastography in tendon pathology: state of the art . Skeletal Radiol 2017. ; 46 : 1643 – 55 . doi: 10.1007/s00256-017-2726-2 [DOI] [PubMed] [Google Scholar]
- 3. Jacobson JA . Shoulder US: anatomy, technique, and scanning pitfalls . Radiology 2011. ; 260 : 6 – 16 . doi: 10.1148/radiol.11101082 [DOI] [PubMed] [Google Scholar]
- 4. De Zordo T , Lill SR , Fink C , Feuchtner GM , Jaschke W , Bellmann-Weiler R , et al. . Real-time sonoelastography of lateral epicondylitis: comparison of findings between patients and healthy volunteers . AJR Am J Roentgenol 2009. ; 193 : 180 – 5 . doi: 10.2214/AJR.08.2020 [DOI] [PubMed] [Google Scholar]
- 5. Dudea SM , Botar-Jid C , Dumitriu D , Vasilescu D , Manole S , Lenghel ML . Differentiating benign from malignant superficial lymph nodes with sonoelastography . Med Ultrason 2013. ; 15 : 132 – 9 . doi: 10.11152/mu.2013.2066.152.smd1cbj2 [DOI] [PubMed] [Google Scholar]
- 6. Havre R , Waage J , Gilja O , Ødegaard S , Nesje L . Real-time elastography: strain ratio measurements are influenced by the position of the reference area . Ultraschall Med 2012. ; 33 : 559 – 68 . doi: 10.1055/s-0031-1273247 [DOI] [PubMed] [Google Scholar]
- 7. Madden ME . The magic-angle effect of the supraspinatus tendon . Radiol Technol 2006. ; 77 : 357 – 65 . [PubMed] [Google Scholar]
- 8. Sein ML , Walton J , Linklater J , Harris C , Dugal T , Appleyard R , et al. . Reliability of MRI assessment of supraspinatus tendinopathy . Br J Sports Med 2007. ; 41 : e9 . doi: 10.1136/bjsm.2006.034421 [DOI] [PMC free article] [PubMed] [Google Scholar]
- 9. Parameswaran K , Willems-Widyastuti A , Alagappan VK , Radford K , Kranenburg AR , Sharma HS . Role of extracellular matrix and its regulators in human airway smooth muscle biology . Cell Biochem Biophys 2006. ; 44 : 139 – 46 . doi: 10.1385/CBB:44:1:139 [DOI] [PubMed] [Google Scholar]
- 10. Kjellin I , Ho CP , Cervilla V , Haghighi P , Kerr R , Vangness CT , et al. . Alterations in the supraspinatus tendon at MR imaging: correlation with histopathologic findings in cadavers . Radiology 1991. ; 181 : 837 – 41 . doi: 10.1148/radiology.181.3.1947107 [DOI] [PubMed] [Google Scholar]
- 11. Klauser AS , Miyamoto H , Tamegger M , Faschingbauer R , Moriggl B , Klima G , et al. . Achilles tendon assessed with sonoelastography: histologic agreement . Radiology 2013. ; 267 : 837 – 42 . doi: 10.1148/radiol.13121936 [DOI] [PubMed] [Google Scholar]
- 12. De Zordo T , Chhem R , Smekal V , Feuchtner G , Reindl M , Fink C , et al. . Real-time sonoelastography: findings in patients with symptomatic Achilles tendons and comparison to healthy volunteers . Ultraschall in Med 2010. ; 31 : 394 – 400 . doi: 10.1055/s-0028-1109809 [DOI] [PubMed] [Google Scholar]
- 13. Seo JB , Yoo JS , Ryu JW . Sonoelastography findings of supraspinatus tendon in rotator cuff tendinopathy without tear: comparison with magnetic resonance images and conventional ultrasonography . J Ultrasound 2015. ; 18 : 143 – 9 . doi: 10.1007/s40477-014-0148-8 [DOI] [PMC free article] [PubMed] [Google Scholar]
- 14. De Zordo T , Lill SR , Fink C , Feuchtner GM , Jaschke W , Bellmann-Weiler R , et al. . Real-time sonoelastography of lateral epicondylitis: comparison of findings between patients and healthy volunteers . Amer J Roentgenol 2009. ; 193 : 180 – 5 . doi: 10.2214/AJR.08.2020 [DOI] [PubMed] [Google Scholar]
- 15. Lalitha P , Reddy MCh , Reddy KJ . Musculoskeletal applications of elastography: a pictorial essay of our initial experience . Korean J Radiol 2011. ; 12 : 365 – 75 . doi: 10.3348/kjr.2011.12.3.365 [DOI] [PMC free article] [PubMed] [Google Scholar]
- 16. Lee SU , Joo SY , Kim SK , Lee SH , Park SR , Jeong C . Real-time sonoelastography in the diagnosis of rotator cuff tendinopathy . J Shoulder Elbow Surg 2016. ; 25 : 723 – 9 . doi: 10.1016/j.jse.2015.10.019 [DOI] [PubMed] [Google Scholar]
- 17. Tudisco C , Bisicchia S , Stefanini M , Antonicoli M , Masala S , Simonetti G . Tendon quality in small unilateral supraspinatus tendon tears. Real-time sonoelastography correlates with clinical findings . Knee Surg Sports Traumatol Arthrosc 2015. ; 23 : 393 – 8 . doi: 10.1007/s00167-013-2551-7 [DOI] [PubMed] [Google Scholar]
- 18. Leadbetter WB . Cell-matrix response in tendon injury . Clin Sports Med 1992. ; 11 : 533 – 78 . [PubMed] [Google Scholar]
- 19. Cook JL , Khan KM , Kiss ZS , Purdam CR , Griffiths L . Reproducibility and clinical utility of tendon palpation to detect patellar tendinopathy in young basketball players . Br J Sports Med 2001. ; 35 : 65 – 9 . doi: 10.1136/bjsm.35.1.65 [DOI] [PMC free article] [PubMed] [Google Scholar]
- 20. Cook JL , Khan KM , Kiss ZS , Griffiths L . Patellar tendinopathy in junior basketball players: a controlled clinical and ultrasonographic study of 268 patellar tendons in players aged 14-18 years . Scand J Med Sci Sports 2000. ; 10 : 216 – 20 . doi: 10.1034/j.1600-0838.2000.010004216.x [DOI] [PubMed] [Google Scholar]


