

Abstract
Purpose:
Radiotherapy (RT) can transform the immune landscape and render poorly immunogenic tumors sensitive to PD-L1 inhibition. Here, we established that the response to combined RT and PD-L1 inhibition is transient and investigated mechanisms of resistance.
Experimental Design:
Mechanisms of resistance to RT and PD-L1 blockade were investigated in orthotopic murine head and neck squamous cell carcinoma (HNSCC) tumors using mass cytometry and whole-genome sequencing. Mice were treated with anti–PD-L1 or anti–TIM-3 alone and in combination with and without RT. Tumor growth and survival were assessed. Flow cytometry was used to assess phenotypic and functional changes in intratumoral T-cell populations. Depletion of regulatory T cells (Treg) was performed using anti-CD25 antibody.
Results:
We show that the immune checkpoint receptor, TIM-3, is upregulated on CD8 T cells and Tregs in tumors treated with RT and PD-L1 blockade. Treatment with anti–TIM-3 concurrently with anti–PD-L1 and RT led to significant tumor growth delay, enhanced T-cell cytotoxicity, decreased Tregs, and improved survival in orthotopic models of HNSCC. Despite this treatment combination, the response was not durable, and analysis of relapsed tumors revealed resurgence of Tregs. Targeted Treg depletion, however, restored antitumor immunity in mice treated with RT and dual immune checkpoint blockade and resulted in tumor rejection and induction of immunologic memory.
Conclusions:
These data reveal multiple layers of immune regulation that can promote tumorigenesis and the therapeutic potential of sequential targeting to overcome tumor resistance mechanisms. We propose that targeted Treg inhibitors may be critical for achieving durable tumor response with combined radiotherapy and immunotherapy.
Translational Relevance
Immunotherapy clinical trials targeting the programmed-death 1/programmed-death ligand 1 (PD-1/PD-L1) axis show that a majority of head and neck squamous cell carcinoma (HNSCC) patients are resistant to PD-1/PD-L1 inhibition. Our findings reveal the complexity of tumor immune evasion mechanisms and underscore the critical role regulatory T cells play in treatment resistance of HNSCCs.
Introduction
Head and neck squamous cell carcinoma (HNSCC) is the fifth most common malignancy globally with over 600,000 patients diagnosed annually (1). Despite aggressive treatment involving chemotherapy and radiotherapy (RT), the overall survival (OS) rate remains below 50% after 5 years for advanced HNSCC patients (1, 2). The programmed-death 1/programmed-death ligand 1 (PD-1/PD-L1) axis has been implicated in evasion of immune recognition in a number of cancers including HNSCC (3–8). However, the response to PD-1/PD-L1 therapy is discouraging with approximately 13% response rate in HNSCC (9). The low response to immune checkpoint blockade in HNSCC is largely attributed to additional immunosuppressive pathways in the tumor microenvironment that remain poorly understood. Furthermore, a majority of patients who respond to immune checkpoint blockade develop therapeutic resistance (10, 11). Dual targeting of immune checkpoint pathways has resulted in only limited improvement in OS and in some cases increased toxicity and reduced antitumor immunity (12). In a recent report, Koyama and colleagues demonstrated upregulation of the immune checkpoint T-cell immunoglobulin mucin-3 (TIM-3) in a preclinical model of non–small cell lung cancer that developed acquired resistance to PD-1 checkpoint blockade (13). Although the study showed a survival advantage in mice that received anti–PD-1 and anti–TIM-3 treatment, all mice died of increased tumor burden. RT has the potential to sensitize tumors to immune checkpoint blockade by promoting a T-cell–inflamed tumor microenvironment and has shown promising results in preclinical models of lung, bladder, and head and neck cancers (14–16). However, resistance to RT and immune checkpoint blockade represents a major impediment to achieving durable tumor control.
To develop better therapeutic strategies, understanding the mechanistic underpinnings of tumor immune evasion and tumor microenvironment factors that contribute to treatment resistance is important. We previously demonstrated that local radiation to the tumor can transform the immune landscape and render poorly immunogenic murine orthotopic HNSCC tumors sensitive to PD-L1 inhibition (16). However, here we determined that the response to combined RT and PD-L1 inhibition is only transient. We therefore sought to characterize the immune landscape of HNSCC tumors during RT and PD-L1 treatment and interrogate mechanisms of resistance. We hypothesized that compensatory mechanisms of immune evasion are activated in response to RT + anti–PD-L1. We show that expression of the checkpoint receptor TIM-3 is upregulated on CD8 T cells and regulatory T cells (Treg) in tumors treated with RT and PD-L1 blockade. Treatment with anti–TIM-3 concurrently with anti–PD-L1 and RT led to a significant tumor growth delay, enhanced T-cell cytotoxicity, decreased Tregs, and improved survival. However, despite dual checkpoint blockade and RT, the response was still not durable and tumors relapsed. Analysis of relapsed tumors reveals decreased CD8 T-cell infiltration and repopulation of Tregs. Targeted depletion of Tregs with anti-CD25 antibody restores antitumor immunity in tumor-bearing mice treated with RT and dual immune checkpoint blockade and results in rejection of established tumors. These findings shed light on potential mechanisms of resistance to immunotherapy (IT) in combination with RT.
Materials and Methods
Cell lines and cell culture
Murine MOC2 and LY2 squamous cell carcinoma cells were used in our studies. The MOC2 cell line obtained from the laboratory of Dr. Ravindra Uppaluri (Dana-Farber Cancer Institute) was derived from a C57Bl/6 mouse that developed SCC after exposure of the oral cavity to DMBA over 25 weeks (17). The LY2 cell line obtained from the laboratory of Dr. Nadarajah Vigneswaran (University of Texas Health Science Center) was derived from lymph node metastases that developed in BALB/c mice after inoculation of PAM 212 squamous cell carcinoma cells (18). Both cell lines are wild-type for TP53 and EGFR. Cells were cultured at 37°C and 5% CO2 in appropriate media (DMEM-F12 for LY2 and IMDM for MOC2) supplemented with 10% FBS and 1% primocin.
Animal tumor model
MOC2 and LY2 tumor models were established as previously described (16). Briefly, cell suspensions were mixed with equal volumes of Matrigel (10 mg/mL; BD Biosciences) and injected submucosally via the intraoral route into the buccal mucosa at a final concentration of 1 × 10⁶/0.1 mL per animal for LY2 cells and 1 × 10⁵/0.1 mL per animal for MOC2 cells. Fifty mice per cell line were inoculated at a single site in the right buccal mucosa. Mice were randomized to receive IgG control (10 mg/kg; BioXcell), anti–PD-L1 (10 mg/kg; BioXcell,), anti–TIM-3 (10 mg/kg; BioX-Cell), anti–PD-L1+anti–TIM-3, RT+IgG, RT+anti–PD-L1, RT+anti–TIM-3, or RT+ anti–PD-L1+ anti–TIM-3. Antibodies were administered i.p. 3 days before RT and maintained twice per week for 3 weeks. Local RT was delivered directly under image guidance to the tumor. Treatment was started when average tumor size reached 100 mm3 (6 days after inoculation). For depletion of Tregs, anti-CD25 (2.5 mg/dose; BioXcell) and the corresponding rat IgG1 isotype were administered i.p. to the respective groups. Dosing began 1 week after RT and maintained for 4 weeks at 1x/ week. Confirmation of Treg depletion was performed in each mouse using flow cytometry on blood samples and gating for live CD45+CD3+CD4+CD25+FoxP3+ cells (see flow cytometry methods section). Tumor size was measured weekly with digital calipers, and tumor volumes were estimated using the formula (V = A × B2/2 mm3), where A and B are the longer and shorter diameters of the tumor. In addition, mice were assessed by CT imaging to visualize tumor burden. Mice exhibiting signs of morbidity according to the guidelines set by the Institutional Animal Care and Use Committee (IACUC) were sacrificed immediately. Primary tumors, regional lymph nodes, spleens, and lungs were harvested upon sacrifice. Experiments were repeated 2 to 3 times. All protocols for animal tumor models were approved by the IACUC of the University of Colorado Denver.
Irradiation
Irradiation was performed at the Image-Guided Monitoring and Precision Radiotherapy Shared Resource at the University of Colorado Denver using the PXi-225Cx image-guided irradiator (Precision X-Ray Inc.) at 225 kVp, 13 mA with 0.3 mm Cu filter. For animal experiments, mice were positioned in the prone orientation, and a CT scan was acquired. Treatment planning was performed using Monte Carlo algorithm, and radiation was delivered using AP-PA beams. Dose-volume histogram analysis showed that all mice received 95% to 105% of the dose to the target volume. Radiation was delivered at a dose rate of 5.6 Gy/min.
Flow cytometry
For flow cytometric analysis of tumor tissue, tumors were digested into single-cell suspension as previously reported (19). Briefly, tumors were finely cut and placed in HBSS solution containing 200 U of Collagenase III (Worthington) for 40 minutes with gentle shaking every 15 minutes. After the incubation period, tumor pieces were passed through a 70-μm nylon mesh. The resulting cell suspension was centrifuged and resuspended in red blood cell lysis buffer for 2 minutes. HBSS was added to inactivate RBC lysis buffer, and cell suspensions were centrifuged, resuspended, and counted using an automated cell counter. Draining lymph nodes and spleens were also collected and processed into single-cell suspensions through mechanical separation. Trypan blue was used to determine cell viability. For flow cytometric analysis, 1 × 10⁶ live cells were plated in 24-well plates and cultured for 5 hours in the presence of monensin to prevent release of cytokines and PMA and ionomycin to stimulate cytokine production. After the incubation period, cells were plated in a 96-well plate and blocked with anti-CD16/32 antibody. For analysis of immune cells, the following conjugated antibodies were used: APC-eFluor780-CD8 (Clone 53–6.7; eBioscience), eFluor450-CD4 (Clone RM4–5; eBioscience), AlexaFluor700-CD45 (Clone 30-F11; eBioscience), DyLight350-CD3 (Clone 145–2C11; Novus), FITC-CD44 (Clone IM7; eBioscience), PE-PD-1 (Clone RMP1–30; eBioscience), PECyanine7-IFNγ (Clone XMG1.2; eBioscience), Ki-67-BV605 (Clone 16A8; eBioscience), and PE-CD25 (Clone 3C7; BioLegend). For proper compensation of flow cytometry channels, beads and single-stain samples were used. For gating, isotype controls and fluorescence minus-one (FMO) controls were applied. Both mean fluorescence intensity (MFI) and proportion of positively stained cells were analyzed. Stained cells were run on the Yeti Cell Analyzer at the University of Colorado Denver Cancer Flow Cytometry Core. Data were analyzed using FlowJo Analysis software.
Mass cytometry (CyTOF)
For CyTOF experiments, 6 to 10 tumors per group were harvested and digested as described in the flow cytometry section. Cells were stained with heavy-metal tagged antibodies according to the manufacturer’s instructions (Fluidigm). The following heavy-metal tagged antibodies were used: CD45-Y89, CD3e-Sm152, CD274-Eu153, CD152-Sm154, FoxP3-Gd158, CD366-Dy162, CD4–172Yb, CD8a-Nd146, CD11b-Nd148, CD278-Yb176, Intercalator Ir-191/Ir-193, and Cisplatin-Pt-195. Stained cells were run on the Helios Mass Cytometer at the University of Colorado Denver Cancer Center Flow Cytometry Core. Gating was performed on nucleated live cells (positive for Ir-191 and Ir-193 and negative for Pt-195). Data were analyzed using FlowJo Analysis software.
Patient tissue samples
Excess, nondiagnostic fresh tumor tissue was collected from HNSCC patients before and after salvage surgery with informed consent at the University of Colorado Hospital in accordance with the protocol approved by the Colorado Multiple Institutional Review Board (COMIRB # 08–0552). Following tumor resection, tumor tissues were examined by a clinical pathologist, and non-necrotic sections were utilized for research purposes. Tissue was paraffin-embedded, and 4-μm-thick sections were cut using standard protocol.
Multiplex immunofluorescence staining
Multispectral imaging of patient tissue samples was performed at the Human Immune Monitoring Shared Resource at the University of Colorado School of Medicine using the Perkin Elmer Vectra 3 instrument. Slides were deparaffinized, heat treated in antigen retrieval buffer, blocked, and incubated with primary antibody (CD3, CD4, CD8, FoxP3, and cytokeratin), followed by horseradish peroxidase (HRP)–conjugated secondary antibody polymer, and HRP-reactive OPAL fluorescent reagents. To prevent further deposition of fluorescent dyes in subsequent staining steps, slides were stripped in between each stain with heat treatment in antigen retrieval buffer. DAPI was used to stain nucleated cells. Slides were scanned using the 10x objective, and multispectral images of each region of interest were collected using the 20x objective with a 0.5 mm resolution. Color images were analyzed with inForm software to unmix adjacent fluorochromes, subtract autofluorescence, segment the tissue, compare the frequency and location of cells, segment cellular membrane, cytoplasm, and nuclear regions, and phenotype infiltrating immune cells according to morphology and cell marker expression.
RNA extraction and RNA sequencing
Total RNA was isolated from LY2 tumors either untreated or treated with RT+αPD-L1. RNA was collected at 1 week and 3 weeks after initiation of treatment along with equivalent controls (n = 3 per group). RNA quality and quantity were analyzed using a NanoDrop and Bioanalyzer. RNA-seq library preparation and sequencing were conducted at the Genomics and Microarray Core at the University of Colorado Denver–Anschutz Medical Campus. Libraries were constructed using a NuGen Ovation human formalin-fixed paraffin embedded (FFPE) RNA-seq multiplex system kit customized with mouse-specific oligonucleotides for rRNA removal. Directional mRNA-seq was conducted using the Illumina HiSeq 2000 system, using the single-read 100-cycle option.
Bioinformatics analysis
RNA-seq reads were obtained using Illumina HiSeq analysis pipeline. Reads quality was checked using FastQC (https://www.bioinformatics.babraham.ac.uk/projects/fastqc). The median number of reads per condition was 24 million. Reads were then processed and aligned to the University of California Santa Cruz Mus musculus reference genome (build mm10) using TopHat v2 (20). TopHat incorporates the Bowtie v2 algorithm to perform the alignment (21). TopHat initially removes a portion of reads based on quality information accompanying each read and then maps reads to the reference genome. The aligned read files were processed by Cufflinks v2.0.2 (22). Reads were assembled into transcripts, and their abundance was estimated. Cufflinks uses the normalized RNA-seq fragment counts to measure the relative abundance of transcripts. The unit of measurement is transcripts per kilobase of exon per million fragments mapped (TPM). Confidence intervals for TPM estimates were calculated using a Bayesian inference method (22). EdgeR is a Bioconductor software package for examining differential expression of replicated count data (23). Briefly, it used an overdispersed Poisson model to account for both biological and technical variability. In addition, it used empirical Bayes methods to moderate the degree of overdispersion across transcripts, thereby improving the reliability of inference. Default parameters for EdgeR were used.
Cibersort analysis
For analysis of leucocyte populations from RNA-seq data, a set of 547 genes previously validated to represent leucocyte gene signatures was filtered and input into the online analytical tool CIBERSORT (Cell type identification by estimating relative subsets of known RNA transcripts). The matrix was constructed according to instructions provided by the developers (https://cibersort.stanford.edu/; ref. 24). The CIBERSORT LM22 matrix transforms gene-expression data into relative fractions of hematopoietic cells phenotypes. CIBERSORT implements Monte Carlo sampling to generate an empirical P value for the deconvolution. Only cases with a P value < 0.05, which indicated a reliable estimation of immune cell infiltration, were used for further analysis.
Statistical analysis
Two-way ANOVA was performed to assess differences in the expression of markers across treatment groups. The Student t test was used for analysis of flow cytometry data. For survival analysis, Kaplan–Meier curves were analyzed based on the Log-rank (Mantel–Cox) test for comparison of all groups. HRs were generated between pairs of groups. For assessment of tumor growth differences, two-way ANOVA was performed. All statistical analyses were performed in Prism software.
Results
TIM-3 is upregulated in response to RT and PD-L1 inhibition
To model the clinical phenotype of poorly immunogenic tumors and assess the response to immune modulatory therapy, we used two murine orthotopic models of HNSCC. LY2 tumor cells were derived from a nodal metastatic tumor from the squamous cell carcinoma cell line Pam212 (25). MOC2 tumor cells were derived from normal oral keratinocytes that were transformed to malignant cells through carcinogen exposure (26). Both cell lines were confirmed to retain keratin and integrin markers of squamous epithelial origin including Desmoglein3 (16).
We previously demonstrated using LY2 cells, that a single RT dose of 10 Gy can recruit and activate effector T cells, induce PD-L1 upregulation on cancer cells, and render anti–PD-L1 refractory tumors sensitive to combination of RT and anti–PD-L1 in an orthotopic murine model of HNSCC (16). The response to single-dose RT and anti–PD-L1, however, is not durable (Fig. 1A). In this study, we hypothesized that increasing the dose and employing a hypofractionated RT regimen comprised of 3 doses of 8 Gy can provide durable tumor response when combined with anti–PD-L1. Although hypofractionated RT + anti–PD-L1 slightly improved the response compared with single-dose RT, it did not provide a durable response to anti–PD-L1, and all tumors relapsed (Fig. 1A). We therefore chose the single 10 Gy dose for subsequent experiments.
Figure 1.
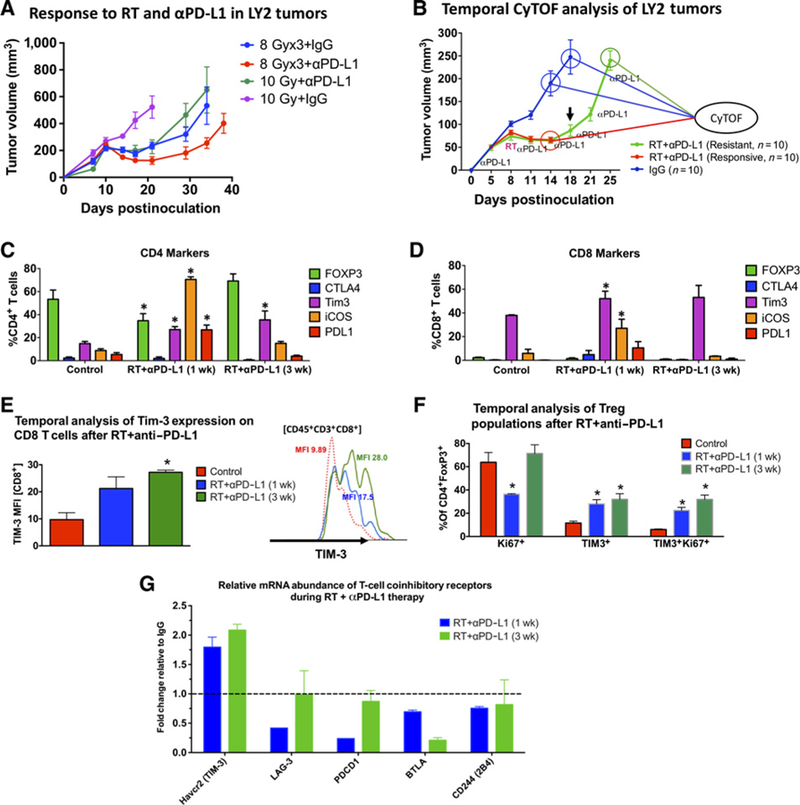
Temporal analysis of the T-cell immune landscape in HNSCC tumors in response to RT and anti–PD-L1 therapy. A, Tumor response to RT and anti–PD-L1 in LY2 tumors treated with single-dose 10 Gy or 3 doses of 8 Gy delivered 3 days apart. Anti–PD-L1 was started on day 7 and maintained for 2 weeks at 2 doses per week. RT commenced on day 10. Black arrow shows time point at which tumor regrowth was observed. Each group contained 7 mice. B, Tumor growth analysis showing timeline at which tumors were harvested for CyTOF analysis. Ten mice per group were included in the analysis. C and D, CyTOF analysis of markers expressed on CD4 and CD8 T cells. Gating was performed on live, CD45+ CD3+ cells. The Y axis shows the percentage of CD4 or CD8 T cells expressing the respective markers. E, Temporal analysis of the phenotype and proliferation status of Tregs (gated on live CD45+CD3+CD4+FoxP3+) in response to RT anti–PD-L1. F, Temporal analysis of TIM-3 expression based on MFI on CD8 T cells in response to RT+anti–PD-L1. Two-way ANOVA was performed to assess significance between each group relative to the control IgG group. Asterisks denote P < 0.05. G, Analysis of gene expression of T-cell coinhibitory receptors from orthotopic LY2 tumors obtained 1 week and 3 weeks after RT and anti–PD-L1 treatment. Data are presented as fold change relative to gene expression from untreated tumors.
To elucidate mechanisms leading to tumor regrowth after RT + anti–PD-L1, we performed mass cytometry (CyTOF) on tumors harvested at early (1 week) and late (3 weeks) time points after treatment with appropriate controls at each time point (Fig. 1B). Temporal analysis of control tumors at both time points did not show significant differences in expression of T-cell markers. In contrast, analysis of tumors harvested at early and late time points after RT+anti–PD-L1 therapy revealed several important changes in the tumor T-cell landscape. We observed a significant increase in ICOS+ CD4 and CD8 T cells (8-fold and 4.6-fold, respectively) at the early time point, which returned to baseline levels at the late time point after RT + anti–PD-L1 therapy (Fig. 1C). Concomitant with an increase in the T-cell activation marker ICOS (27), we also observed a significant increase in PD-L1 on CD8 T cells at the early time point (11-fold increase), consistent with T-cell activation (refs. 28, 29; Fig. 1D). Expression of CTLA4 on CD4 and CD8 T cells was below 4% in all tumors and remained unchanged between groups. Importantly, we observed a significant increase in the proportion of TIM-3–expressing CD4 T cells and a significant increase in the mean fluorescence intensity (MFI) of TIM-3 on CD8 T cells. The proportion of CD4+TIM3+ cells increased by 1.83-fold and 2.40-fold in tumors harvested early and late after RT+anti–PD-L1, respectively(Fig. 1C). The MFI of TIM3 on CD8T cells, on the other hand increased by 2.19-fold and 2.80-fold in early and late tumors, respectively (Fig. 1E). Furthermore, when gated on Tregs (CD4+FoxP3+), the proportion of TIM-3+ Tregs increased by a respective 2.4-fold and 2.8-fold in the early and late phases of RT+anti–PD-L1 therapy (Fig. 1F). Of these Tregs, 50% were Ki67+ in control tumors, 80% were Ki67+ in early-phase RT+anti–PD-L1-treated tumors, and 99.9% were Ki67+ in late-phase RT anti–PD-L1-treated tumors (Fig. 1F).
RNA sequencing of LY2 tumors during the course of RT+anti–PD-L1 treatment (1 week and 3 weeks after RT) further confirmed our CyTOF findings. Analysis of relative mRNA abundance of the T-cell coinhibitory receptors TIM-3, LAG3, PD-1, PD-L1, PD-L2, BTLA, and 2B4 showed that TIM-3 was the only receptor that is upregulated after RT+anti–PD-L1 treatment (Fig. 1G). Other receptors including CTLA-4 were not expressed. Taken together, our findings show transient activation of T cells in response to RT+anti–PD-L1 and rapid upregulation of the T-cell coinhibitory receptor, TIM-3.
Dual immune checkpoint blockade in combination with RT suppresses tumor growth
Given our findings of TIM-3 upregulation, we hypothesized that dual blockade of PD-L1 and TIM-3 in combination with RT would provide durable antitumor immune response. To test our hypothesis, we employed the LY2 and MOC2 HNSCC tumor cell lines. Cibersort analysis of RNA-seq data on LY2 and MOC2 tumors revealed similar levels of Treg infiltration and minimal levels of intratumoral CD8 T cells when compared with MOC1 tumors (Supplementary Fig. S1). In addition, both LY2 and MOC2 tumors have been shown to be refractory to anti–PD-L1 (16, 30), whereas MOC1 tumors are sensitive to single-agent anti–PD-L1 treatment (30). Treatment with anti–PD-L1, anti–TIM-3, or respective IgG control was initiated when average tumor volume reached 100 mm3 (days 6–7 after inoculation). Both LY2 and MOC2 tumor-bearing mice were resistant to single-agent PD-L1 and TIM-3 checkpoint blockade (Fig. 2). Combined PD-L1 and TIM-3 targeting led to a slight reduction in tumor growth that did not reach significance in either the LY2 or MOC2 mice when compared with single-agent or IgG control arms (Fig. 2). RT resulted in slightly reduced tumor growth that did not reach significance compared with IgG, single-agent αPD-L1, αTIM-3, or combined αPD-LI and αTIM-3 in both models. Combinations of RT αPD-L1, RT αTIM-3, and RT αPD-L1 αTIM-3 significantly reduced tumor growth compared with IgG, single-agent IT, double-agent IT, and RT (Fig. 2B and C; Supplementary Fig. S2). Within the RT combination groups, RT+αPD-L1+αTIM3 was significantly superior to all other groups (P < 0.05; Fig. 2D). In LY2 tumor-bearing mice, the average tumor volume in the RT+αPD-L1+αTIM3 group on day 19 when all mice were still alive was 130.3 ± 2.12 mm3 compared with 206.9 ± 4.25 mm3 and 278.0 ± 4.83 mm3 in RT aPD-L1 and RT aTIM3 groups, respectively (Fig. 2D). In MOC2 tumor-bearing mice, the average tumor volume in the RT+αPD-L1+αTIM3 on day 20 when all mice were alive was 102.9 ± 10.5 mm3 compared with 165.3 ± 30.4 mm3 and 377.1 ± 51.2 mm3 in RT aPD-L1 and RT aTIM3 groups, respectively (Fig. 2D and E). Taken together, these data demonstrate that rational targeting of immune checkpoints in combination with RT significantly limits tumor growth.
Figure 2.
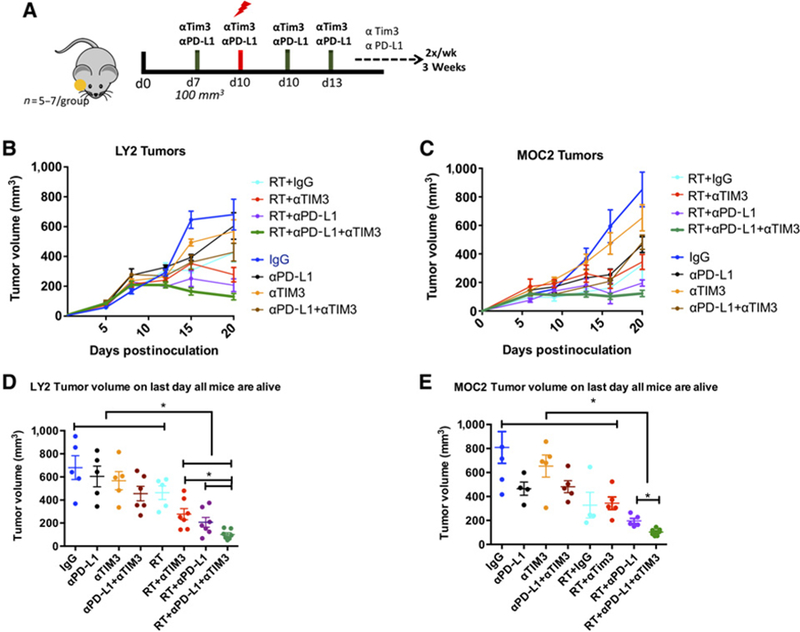
Response of LY2 and MOC2 tumors to treatment with RT, αPD-L1, and αTIM-3 alone and in combination. A, Schematic illustration of treatment schedule. B and C, Tumor growth analysis of LY2 (Balb/c) and MOC2 (C57Bl/6) tumor-bearing mice. Mice received mAb against PD-L1, TIM-3, or IgG on day 7 and 10 Gy RT on day 10. Antibodies were delivered 2×/week for 2 weeks. D and E, Statistical analysis was performed on day 19 when mice from all groups were alive using two-way ANOVA. Asterisk denotes significance (P < 0.05).
Dual immune checkpoint blockade in combination with RT induces T-cell cytotoxicity and limits Treg infiltration
We previously demonstrated that combination therapy with RT and anti–PD-L1 results in increased IFNγ production by intratumoral CD4 and CD8 T cells compared with control tumors. Here, we sought to investigate if dual-checkpoint blockade with RT further enhances effector T cells. Using flow cytometry, we analyzed T cells in LY2 tumors harvested 72 hours after administration of combined RT and anti–PD-L1 and anti–TIM-3 antibodies (Fig. 3A). Tumors irradiated with 10 Gy had significantly increased IFNγ+CD8+ T cells compared with nonirradiated tumors (Fig. 3B). Importantly, the addition of anti–TIM-3 to RT and anti–PD-L1 resulted in a significant increase in functional effector (CD44+IFNγ+) CD8 and CD4 T cells compared with IgG and RT+IgG arms (Fig. 3B). The proportion of CD44+IFNγ+ CD8 T cells in the RT+αPD-L1+αTIM3 group increased by 3.9-fold relative to IgG, 1.7-fold relative to RT, and 1.5-fold relative to RT+αPD-L1. The proportion of CD44+IFNg+ CD4 T cells in the RT+αPD-L1+αTIM3 increased by 3.0-fold relative to IgG, 1.9-fold relative to RT, and 1.4-fold relative to RT+αPD-L1. In addition to increasing effector T cells, dual checkpoint blockade when combined with RT resulted in significantly decreased intratumoral Treg populations. We observed a 4.1-fold decrease relative to IgG, 2.6-fold decrease relative to RT, and 2.8-fold decrease relative to RT+αPD-L1 in mice that received RT+αPD-L1+αTIM3. These data show that addition of anti–TIM-3 significantly reduces intratumoral Treg populations and increases CD8 and CD4 T-cell effector function compared with RT and anti–PD-L1 (Fig. 3C).
Figure 3.
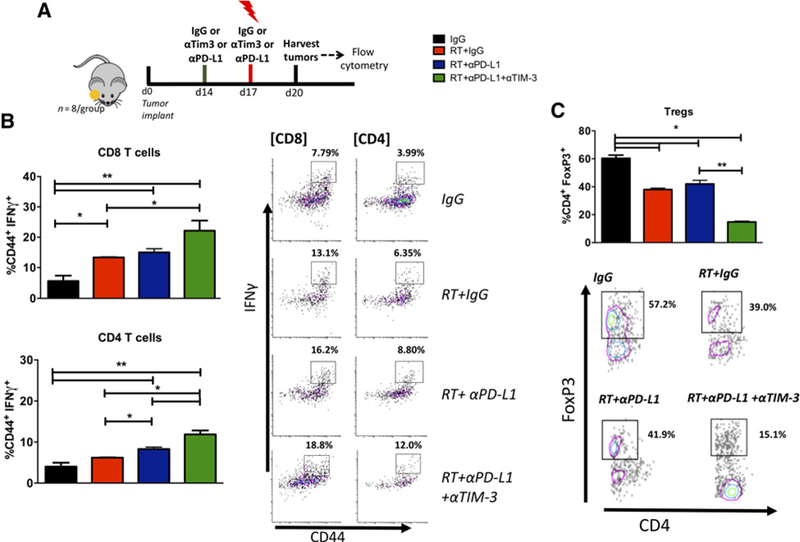
Effect of addition of αTIM3 to RT+αPD-L1 in orthotopic HNSCC. A, Treatment schedule for flow experiments. Tumors were allowed to grow for 2 weeks before administration of mAbs and RT. Tumors were harvested 72 hours after 10 Gy RT and subjected to enzymatic digestion. B, Flow cytometric analysis for T cell activation (CD44) and cytotoxicity (IFNγ) in CD4 and CD8 T cells harvested from tumors treated with RT, RT+αPD-L1, RT+αPD-L1+αTIM3, or IgG. Gating was performed on CD45+, CD3+, live, single cells. Gate assignment was based on FMO and isotype controls. C, Flow cytometric analysis of the Treg population (CD4+FoxP3+). Bars represent SEM from 3 to 5 independent tumor samples. Two-way ANOVA was performed to assess significance between groups (*, P < 0.05 and **, P < 0.01).
Efficacy of dual immune checkpoint blockade in combination with RT is lost over time
We analyzed survival in all treatment arms as an endpoint for assessing efficacy of RT and dual immune checkpoint blockade. Survival analysis demonstrated a statistically significant increase in median survival in the RT+αPD-L1+αTIM-3 therapy over RT+single-agent IT (Fig. 4C and D). In LY2 tumor-bearing mice, median survival with RT+αPD-L1+αTIM3 was 38.0 days compared with 26.0 days with RT, 28.0 days with RT+αTIM-3, and 33.0 days with RT+αPD-L1. In MOC2 tumor-bearing mice, median survival with RT+αPD-L1+αTIM3 was 50.0 days compared with 36.0 days with RT, 30.0 days with RT+αTIM-3, and 42.5 days with RT+αPD-L1 (Supplementary Table S1). Although we observed a significant improvement in survival in the RT+αPD-L1+αTIM-3 arm compared with RT+αPD-L1, all tumors eventually regrew and mice died of local disease progression (Fig. 4A and B). These findings showed that targeting TIM-3 in addition to PD-L1 can result in additional tumor growth delay and improved survival, but the response is not durable and alternative mechanisms of immune evasion are likely at play.
Figure 4.
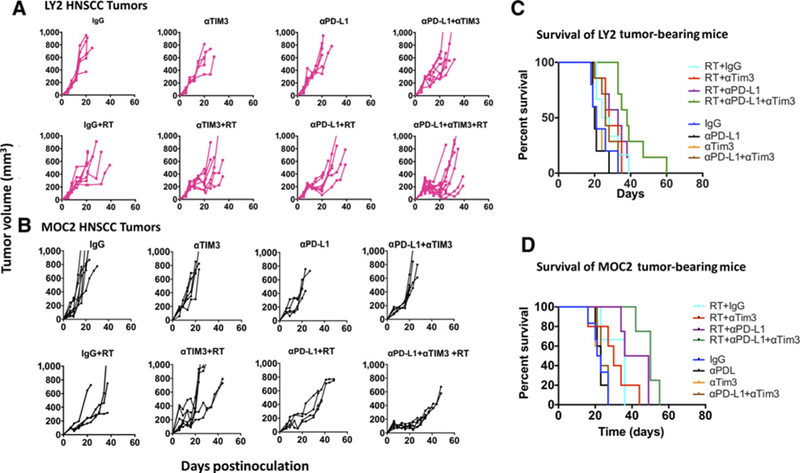
Long-term analysis of tumor growth and mouse survival. A and B, Individual tumor growth curves from LY2 and MOC2 tumors treated with IgG, αTIM3, αPD-L1, αPD-L1+αTIM3, RT+IgG, RT+αPD-L1, RT+αTIM3, and RT+αPD-L1+αTIM3. C and D, Survival analysis of LY2 and MOC2 tumor-bearing mice in each group.
Antitumor immunity in response to dual immune checkpoint blockade and RT is lost due to reemergence of Tregs
To determine if tumor regrowth after RT+αPD-L1+αTIM3 treatment is associated with loss of T cell immunity, we performed flow cytometry on LY2 tumors harvested during the tumor regrowth phase and assessed intratumoral infiltration of effector CD8 T cells and CD4 T cells and Tregs (Fig. 5). To confirm Treg activation and proliferation, we further gated on Ki67+ Tregs. Our data are concordant with the transient tumor growth delay observed early after RT+αPD-L1+αTIM-3. During the tumor regrowth phase, we observed a significant increase in the proportion of Tregs (3.9-fold increase relative to the early phase of treatment, Fig. 5A). Notably, the proportion of Ki67+ Tregs was >80% during early and late phases of response to RT+αPD-L1+αTIM3 (Fig. 5B). In addition, we observed a significant decrease in activated CD44+IFNγ+ CD4 and CD8 T cells (Fig. 5C and D). These data demonstrate that RT and dual immune checkpoint blockade transiently decrease the intratumoral Treg population, and this may contribute to the temporary nature of the antitumor response observed. RNA-seq analysis of tumors harvested during the responsive and resistant phases of RT+anti–PD-L1 treatment showed upregulation of TGFB1, IL10rb, and Id3 by 4.0-, 1.96-, and 5.10-fold, respectively, during the resistant phase relative to control tumors (Supplementary Fig. S3). In addition, an increase in the Treg chemokine, CCL20, was observed during the early phase of response to RT+anti–PD-L1 (3.52-fold increase) and which was further increased during the resistant phase of treatment (8.94-fold increase; Supplementary Fig. S3). In addition to upregulation of factors involved in Treg accumulation and differentiation, we observed a decrease in IFNγ-related genes involved in antitumor immunity including Stat1 (3.10-fold decrease), Gzmb (5.43-fold decrease), Cxcl9 (3.10-fold decrease), and Cxcl10 (2.43-fold decrease). These data highlight multiple mechanisms by which Tregs are enriched in HNSCC tumors and which can negatively influence response to RT+anti–PD-L1.
Figure 5.
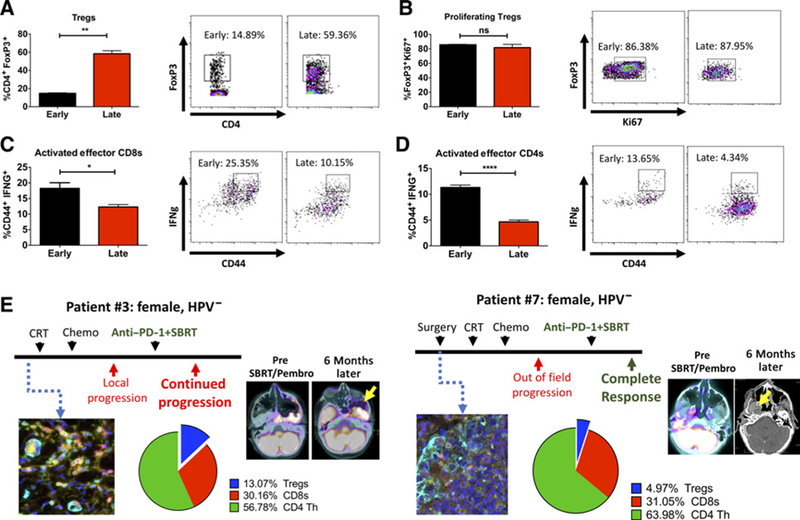
Temporal analysis of cytotoxic T cell activity and Treg infiltration in LY2 tumors treated with RT+αPD-L1+αTIM3. A, Proportion of intratumoral Tregs in tumors harvested during the early (1 week after RT) and late (3 weeks after RT) phases of treatment. B, Proportion of proliferating Tregs as measured with Ki-67+ staining on flow cytometry. C and D, Proportion of activated effector CD8 and CD4 T cells was assessed with CD44+ and IFNγ+ by flow cytometry. Bars represent SEM from 3 to 5 independent tumor samples. Unpaired t test was performed to assess significance between groups (*, P < 0.05; **, P < 0.01; ***, P < 0.0001; and ****, P < 0.0001). E, Analysis of patient samples with the Vectra immunofluorescence platform. Two patients with similar disease course but different outcomes were selected for analysis of immune cell profile (CD3, CD8, CD4, FoxP3, and DAPI). Proportion of positively stained immune cells relative to all cells is depicted in pie charts. (Color code: yellow = CD4; magenta = FoxP3; cyan = CK; green = CD3; red = CD8; blue = DAPI).
Because Tregs have been correlated with a negative prognosis across different disease sites including HPV-negative HNSCC (31), we histologically examined if Treg infiltration differed in two HPV-negative patients with similar disease presentation but different response rates to combination therapy with hypofractionated RT and anti–PD-1 (Fig. 5E). Both patients presented with locally recurrent disease in the skull base and were treated with 35 Gy in 5 fractions with anti–PD-1 (Pembrolizumab) therapy initiated 2 weeks following RT. Multiplex immunofluorescence staining with the Vectra platform of patient tumor tissue samples showed higher proportion of Tregs in the patient with no response to therapy (patient 3; 13.1% Tregs) compared with the patient with complete response (patient 7; 5% Tregs). Representative scans before and after treatment with RT and anti–PD-1 are shown (Fig. 6E). Similarly, examination of tissue from 2 other patients who underwent conventional chemoradiation followed by anti–PD-1 therapy also showed increased Treg infiltration in the 1 patient without response to treatment (patient 5) compared with the patient with partial response (patient 2; Supplementary Fig. S3). These data corroborate published literature on the immunuosuppressive role that Tregs play in the context of IT treatment (32, 33).
Figure 6.
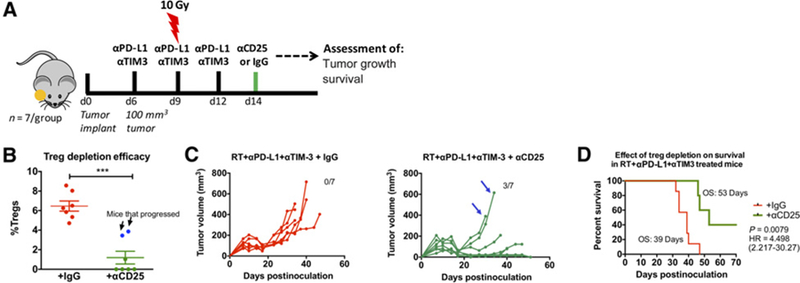
Effect of Treg depletion on tumor response to RT and dual immune checkpoint blockade. A, Schematic illustration of dosing timeline. Mice were treated with RT+αPD-L1+αTIM3 similar to previous experiments. Anti-CD25 was administered at the time point at which tumors were regressing (1 week after initiation of RT+αPD-L1+αTIM3) and maintained at 1 dose per week. B, Depletion of Tregs was confirmed with flow cytometric analysis of blood samples 4 days after the first dose of anti-CD25. Arrows show data points for mice that had high proportion of Tregs despite anti-CD25 administration. Unpaired t test was used to assess significance. C, Individual tumor growth analysis of mice treated with anti-CD25 (green) or IgG (red) and RT+αPD-L1+αTIM3. Arrows show tumor growth profile of the 2 mice which had high Treg proportion despite anti-CD25 administration. D, Survival analysis in mice that received anti-CD25 (green) or IgG (red) in addition to RT+αPD-L1+αTIM3. Log-rank test was used to assess significance between groups.
Depletion of Tregs restores antitumor immunity when combined with RT and dual immune checkpoint blockade
We hypothesized that repopulation of Tregs in LY2 tumors is responsible for tumor progression and resistance to therapy. To test this hypothesis, we treated mice with RT, anti–PD-L1, and anti–TIM-3 and used anti-CD25 treatment to deplete Treg populations, starting at the time point at which we found Tregs to be significantly decreased due to treatment (day 14). Day 14 is also the time point at which LY2 tumors have peak response to treatment as demonstrated by smallest average tumor volume (Fig. 3A). Mice were randomized on day 14 to receive anti-CD25 antibody or the corresponding isotype rat IgG1 antibody (Fig. 6A). Depletion of Tregs was confirmed with flow cytometry on blood, 1 week after initiation of anti-CD25 antibody administration (Fig. 6B). From the 7 mice treated with anti–CD25-depleting antibody, 5 mice demonstrated over 90% depletion of Tregs (Fig. 6B; mean ± SEM: 9.0% ± 0.86% compared with 1.4% ± 0.44%). In 2 mice that received anti-CD25 antibody, the mean Treg population was 7.2% ± 0.06%, indicating that Treg depletion in those mice was not accomplished. Analysis of tumor growth in mice treated with RT+αPD-L1+αTIM3 and with validated Treg depletion demonstrated for the first time in the LY2 tumor model complete eradication of well-established tumors in 3 of 5 mice (Fig. 6C and D). Cured mice were rechallenged by injecting the contralateral buccal with 1 × 10⁶ LY2 cells on day 51 after initial tumor inoculation. Mice were monitored for tumor growth over 6 weeks after rechallenge with no evidence of tumor take at the termination of the study indicating a sustained immunologic memory response. Taken together, our data demonstrate that targeted Treg depletion in mice treated with RT+αPD-L1+αTIM3 can result in sustained tumor response and rejection of well-established tumors.
Discussion
Immune-modulating therapy for cancer patients has emerged as a promising strategy for tumor control. However, clinical trials with immune checkpoint inhibitors have thus far only yielded a 15% to 20% response rate (34). Predictive indicators of positive response to immune therapy include the presence of tumor-infiltrating lymphocytes, expression of PD-L1 on tumor cells, and high mutation burden (3, 35, 36). Mechanisms that can induce such changes hold great potential for increasing the response to IT (37). In this study, we examined tumors generated by two cell lines, LY2 and MOC2, that are representative of approximately 80% of patients that will not respond to monotherapy with immune checkpoint inhibitors.
The goal of this work was to define changes in the tumor immune microenvironment of HNSCCs and identify mechanisms leading to immune suppression and resistance to immune checkpoint blockade.
An important aspect of our work is the clinical resemblance of the murine model to HPV-negative, smoking-driven HNSCCs which have poor survival outcome and harbor minimal TILs and minimal PD-L1 expression and are thus less likely to respond to single-modality immune therapies (6, 8, 38–42). In our previous work, we showed that single-dose RT enhances T-cell infiltration and sensitizes PD-L1–refractory tumors to IT (43). In this work, we extend our understanding of mechanisms of tumor immune evasion during RT and anti–PD-L1 therapy.
TIM-3 has emerged as an important regulator of CD8 T cell exhaustion (44). Two recent reports showed that adaptive resistance to anti–PD-1 therapy is mediated by TIM-3 upregulation in mouse models of NSCLC and HNSCC (13, 45). Mechanistically, CD8 T cells that express TIM-3 have been shown to have diminished proliferation capacity, reduced IL2 and IFNγ expression, and reduced perforin and/or granzyme B secretion compared with CD8T cells that express PD-1 (46, 47). This suggests that increased TIM-3 expression in the face of anti–PD-1/PD-L1 treatment could serve as a compensatory mechanism of T cell exhaustion (44). In addition to its role on CD8 T cells, a majority of intratumoral FoxP3+ Tregs have been shown to express TIM-3 (48). Importantly, TIM-3–positive Tregs have been shown to express higher levels of IL10 compared with TIM-3–negative Tregs and a higher capacity for inhibiting IFNγ and TNFα secretion by effector T cells (49–52). Although TIM-3 blockade significantly reduced intratumoral Tregs in our study, the remaining Tregs were highly proliferative and likely continued to expand. Thus, TIM-3 inhibition was not sufficient to eliminate Tregs, and their reemergence contributed to disease progression. Kim and colleagues demonstrated a durable response when TIM-3 inhibition was combined with stereotactic radiosurgery (SRS) and anti–PD-L1 in an orthotopic glioblastoma mouse model (53). However, in this case, the proportion of Tregs was reduced to below 10%. It is conceivable that a threshold for the presence of intratumoral Tregs determines the durability of response to RT and IT. In our case, the combination of RT and dual checkpoint blockade reduced Tregs to 15%, but more than 80% of these Tregs were Ki67+, suggesting that local Tregs were undergoing extensive proliferation. Several studies have suggested that CTLA-4 targeting acts directly to reduce the Treg population (54, 55). In our model, there was minimal expression of CTLA-4 on CD4s in general as well as Tregs (<4%). To elucidate the precise role of Tregs in our model system, we performed targeted depletion. Depletion of Tregs has been demonstrated with the PC61 clone of anti-CD25 with greater than 90% depletion efficiency for FoxP3+CD25+ CD4 T cells (56). Our results show for the first time in an orthotopic murine model of HNSCC a durable response to RT+αPD-L1+αTIM3 when Tregs are depleted leading to tumor eradication.
Clinically, FoxP3+ Tregs have been associated with tumor progression, recurrence, and treatment resistance in several cancers including NSCLC, pancreatic ductal adenocarcinoma, and HNSCC (33, 57–59). There are several mechanisms by which tumors are selectively enriched for Tregs. Coombes and colleagues suggested that tumors secrete TGFβ1 and retinoic acid which convert FoxP3-negative T cells to FoxP3+ Tregs (60). Ke and colleagues proposed a mechanism by which FoxP3 promoter demethylation leads to enhanced FoxP3 expression (61). More recently, Maj and colleagues demonstrated that tumors with high oxidative stress promote a TME that is enriched for Tregs, and this was directly implicated in resistance to immune checkpoint blockade, including PD-L1 inhibition (32). Our analysis showed increased expression of TGFB1 and IL10 receptor (IL10rb), key mediators, and targets of Treg differentiation, proliferation, and survival (62–64). We also found that the transcriptional regulator Id3 is upregulated during the resistance phase. ID3 expression has been reported to maintain FoxP3 transcription in Tregs by restricting E47 activity and controlling the maintenance and homing of Tregs (65). Furthermore, we observed an increase in the Treg chemokine, CCL20, which has been demonstrated to selectively recruit Tregs through binding to CCR6 on the surface of Tregs. In addition to signaling mechanisms that promote Treg recruitment, we observed downregulation of several key IFNγ signature-related genes (66) including CXCL9, CXCL10, STAT1, and granzyme B. IFNγ-related genes have been shown to negatively regulate the neogeneration of FoxP3+ Tregs through ROS-mediated apoptosis in the periphery (67, 68), and their absence can promote Treg expansion (69). Our clinical data support the hypothesis that Tregs can limit the response to RT and immune checkpoint blockade. Our selection of 4 patients with a similar disease course but contrasting treatment response to RT and anti–PD-1 shows that Tregs are enriched in patients who failed treatment compared with patients who responded. These data are limited by the small sample size, and additional studies are warranted to establish a correlation between response to RT+immune checkpoint blockade and Treg infiltration. To date, there are no clinical studies investigating the role of Tregs in mediating resistance to RT and immune checkpoint blockade.
One of the limitations of our murine models is the TP53 wild-type status of our HNSCC cell lines. TP53 mutations are present in 40% to 50% of HNSCCs tumors (70), and importantly, recent data suggest that TP53 loss-of-function mutations can lead to tumor immune evasion by inducing PD-L1 expression (71–74). Interestingly, patients with TP53 mutations have been shown to have better response to immune therapies (75). Therefore, lack of TP53 mutation in our cell lines is consistent with minimal baseline PD-L1 expression and intrinsic resistance to PD-L1 blockade. Our data support a model in which RT invigorates the immune response and renders them sensitive to PD-L1 blockade resulting in transient tumor regression by increasing infiltration of CD8 and CD4 effector T cells. The addition of anti–TIM-3 further augments the antitumor response but is severely limited by the reemergence of Tregs. The depletion of Tregs enhances the antitumor effect of RT and dual immune checkpoint blockade resulting in rejection of well-established tumors. Although our data underscore the critical role that Tregs play in mediating resistance to IT, we cannot exclude the involvement of other immunosuppressive populations. In particular, myeloid-derived suppressor cells have been shown to dampen the response to anti–PD-L1 therapy in murine models of HNSCC (76, 77).
In conclusion, our study provides the first evidence that targeting Tregs enhances therapeutic response to RT and dual immune checkpoint blockade. These findings have direct clinical implications for enhancing the therapeutic efficacy of IT in HNSCC patients.
Supplementary Material
Footnotes
Note: Supplementary data for this article are available at Clinical Cancer Research Online (http://clincancerres.aacrjournals.org/).
Disclosure of Potential Conflicts of Interest
D. Raben is a consultant/advisory board member for AstraZeneca, Genentech, Merck, and Nanobiotix. No potential conflicts of interest were disclosed by the other authors.
References
- 1.Parkin DM, Bray F, Ferlay J, Pisani P. Global cancer statistics, 2002. CA Cancer J Clin 2005;55:74–108. [DOI] [PubMed] [Google Scholar]
- 2.Kamangar F, Dores GM, Anderson WF. Patterns of cancer incidence, mortality, and prevalence across five continents: defining priorities to reduce cancer disparities in different geographic regions of the world. J Clin Oncol 2006;24:2137–50. [DOI] [PubMed] [Google Scholar]
- 3.Taube JM, Klein A, Brahmer JR, Xu H, Pan X, Kim JH, et al. Association of PD-1, PD-1 ligands, and other features of the tumor immune microenvironment with response to anti-PD-1 therapy. Clin Cancer Res 2014;20: 5064–74. [DOI] [PMC free article] [PubMed] [Google Scholar]
- 4.Topalian SL, Sznol M, McDermott DF, Kluger HM, Carvajal RD, Sharfman WH, et al. Survival, durable tumor remission, and long-term safety in patients with advanced melanoma receiving nivolumab. J Clin Oncol 2014;32:1020–30. [DOI] [PMC free article] [PubMed] [Google Scholar]
- 5.Li H, Chiappinelli KB, Guzzetta AA, Easwaran H, Yen RW, Vatapalli R, et al. Immune regulation by low doses of the DNA methyltransferase inhibitor 5-azacitidine in common human epithelial cancers. Oncotarget 2014;5: 587–98. [DOI] [PMC free article] [PubMed] [Google Scholar]
- 6.Concha-Benavente F, Srivastava RM, Trivedi S, Lei Y, Chandran U, Seethala RR, et al. Identification of the cell-intrinsic and -extrinsic pathways downstream of EGFR and IFNgamma that induce PD-L1 expression in head and neck cancer. Cancer Res 2016;76:1031–43. [DOI] [PMC free article] [PubMed] [Google Scholar]
- 7.Zandberg DP, Strome SE. The role of the PD-L1:PD-1 pathway in squamous cell carcinoma of the head and neck. Oral Oncol 2014;50:627–32. [DOI] [PubMed] [Google Scholar]
- 8.Lyford-Pike S, Peng S, Young GD, Taube JM, Westra WH, Akpeng B, et al. Evidence for a role of the PD-1:PD-L1 pathway in immune resistance of HPV-associated head and neck squamous cell carcinoma. Cancer Res 2013;73:1733–41. [DOI] [PMC free article] [PubMed] [Google Scholar]
- 9.Ferris R, Blumenschein G, Fayette J, Guigay J, Colevas A, Licitra L, et al. Further evaluations of nivolumab (nivo) versus investigator’s choice (IC) chemotherapy for recurrent or metastatic (R/M) squamous cell carcinoma of the head and neck (SCCHN): CheckMate 141. J Clin Oncol 2016;34 (suppl; abstr 6009). [Google Scholar]
- 10.Jenkins RW, Barbie DA, Flaherty KT. Mechanisms of resistance to immune checkpoint inhibitors. Br J Cancer 2018;118:9–16. [DOI] [PMC free article] [PubMed] [Google Scholar]
- 11.Syn NL, Teng MWL, Mok TSK, Soo RA. De-novo and acquired resistance to immune checkpoint targeting. Lancet Oncol 2017;18:e731–e41. [DOI] [PubMed] [Google Scholar]
- 12.Shrimali RK, Ahmad S, Verma V, Zeng P, Ananth S, Gaur P, et al. Concurrent PD-1 blockade negates the effects of OX40 agonist antibody in combination immunotherapy through inducing T-cell apoptosis. Cancer Immunol Res 2017;5:755–66. [DOI] [PubMed] [Google Scholar]
- 13.Koyama S, Akbay EA, Li YY, Herter-Sprie GS, Buczkowski KA, Richards WG, et al. Adaptive resistance to therapeutic PD-1 blockade is associated with upregulation of alternative immune checkpoints. Nat Commun 2016;7: 10501. [DOI] [PMC free article] [PubMed] [Google Scholar]
- 14.Wu CT, Chen WC, Chang YH, Lin WY, Chen MF. The role of PD-L1 in the radiation response and clinical outcome for bladder cancer. Sci Rep 2016;6:19740. [DOI] [PMC free article] [PubMed] [Google Scholar]
- 15.Wang X, Schoenhals JE, Li A, Valdecanas DR, Ye H, Zang F, et al. Suppression of type I IFN signaling in tumors mediates resistance to anti-PD-1 treatment that can be overcome by radiotherapy. Cancer Res 2017;77: 839–50. [DOI] [PMC free article] [PubMed] [Google Scholar]
- 16.Oweida A, Lennon S, Calame D, Korpela S, Bhatia S, Sharma J, et al. Ionizing radiation sensitizes tumors to PD-L1 immune checkpoint blockade in orthotopic murine head and neck squamous cell carcinoma. Oncoimmunology 2017;6:e1356153. [DOI] [PMC free article] [PubMed] [Google Scholar]
- 17.Judd NP, Winkler AE, Murillo-Sauca O, Brotman JJ, Law JH, Lewis JS Jr., et al. ERK1/2 regulation of CD44 modulates oral cancer aggressiveness. Cancer Res 2012;72:365–74. [DOI] [PMC free article] [PubMed] [Google Scholar]
- 18.Chen Z, Smith CW, Kiel D, Van Waes C. Metastatic variants derived following in vivo tumor progression of an in vitro transformed squamous cell carcinoma line acquire a differential growth advantage requiring tumor-host interaction. Clin Exp Metastasis 1997;15:527–37. [DOI] [PubMed] [Google Scholar]
- 19.Petit V, Massonnet G, Maciorowski Z, Touhami J, Thuleau A, Nemati F, et al. Optimization of tumor xenograft dissociation for the profiling of cell surface markers and nutrient transporters. Lab Invest 2013;93: 611–21. [DOI] [PubMed] [Google Scholar]
- 20.Trapnell C, Pachter L, Salzberg SL. TopHat: discovering splice junctions with RNA-Seq. Bioinformatics 2009;25:1105–11. [DOI] [PMC free article] [PubMed] [Google Scholar]
- 21.Langmead B, Trapnell C, Pop M, Salzberg SL. Ultrafast and memory-efficient alignment of short DNA sequences to the human genome. Genome Biol 2009;10:R25. [DOI] [PMC free article] [PubMed] [Google Scholar]
- 22.Trapnell C, Hendrickson DG, Sauvageau M, Goff L, Rinn JL, Pachter L. Differential analysis of gene regulation at transcript resolution with RNA-seq. Nat Biotechnol 2013;31:46–53. [DOI] [PMC free article] [PubMed] [Google Scholar]
- 23.Robinson MD, McCarthy DJ, Smyth GK. edgeR: a Bioconductor package for differential expression analysis of digital gene expression data. Bioinformatics 2010;26:139–40. [DOI] [PMC free article] [PubMed] [Google Scholar]
- 24.Newman AM, Liu CL, Green MR, Gentles AJ, Feng W, Xu Y, et al. Robust enumeration of cell subsets from tissue expression profiles. Nat Methods 2015;12:453–7. [DOI] [PMC free article] [PubMed] [Google Scholar]
- 25.Dong G, Loukinova E, Chen Z, Gangi L, Chanturita TI, Liu ET, et al. Molecular profiling of transformed and metastatic murine squamous carcinoma cells by differential display and cDNA microarray reveals altered expression of multiple genes related to growth, apoptosis, angiogenesis, and the NF-kappaB signal pathway. Cancer Res 2001;61:4797–808. [PubMed] [Google Scholar]
- 26.Judd NP, Allen CT, Winkler AE, Uppaluri R. Comparative analysis of tumor-infiltrating lymphocytes in a syngeneic mouse model of oral cancer. Otolaryngol Head Neck Surg 2012;147:493–500. [DOI] [PMC free article] [PubMed] [Google Scholar]
- 27.Dong C, Juedes AE, Temann UA, Shresta S, Allison JP, Ruddle NH, et al. ICOS co-stimulatory receptor is essential for T-cell activation and function. Nature 2001;409:97–101. [DOI] [PubMed] [Google Scholar]
- 28.Saha A, O’Connor RS, Thangavelu G, Lovitch SB, Dandamudi DB, Wilson CB, et al. Programmed death ligand-1 expression on donor T cells drives graft-versus-host disease lethality. J Clin Invest 2016;126:2642–60. [DOI] [PMC free article] [PubMed] [Google Scholar]
- 29.Yamazaki T, Akiba H, Iwai H, Matsuda H, Aoki M, Tanno Y, et al. Expression of programmed death 1 ligands by murine T cells and APC. J Immunol 2002;169:5538–45. [DOI] [PubMed] [Google Scholar]
- 30.Moore EC, Cash HA, Caruso AM, Uppaluri R, Hodge JW, Van Waes C, et al. Enhanced tumor control with combination mTOR and PD-L1 inhibition in syngeneic oral cavity cancers. Cancer Immunol Res 2016;4:611–20. [DOI] [PMC free article] [PubMed] [Google Scholar]
- 31.Zippelius A, Schreiner J, Herzig P, Muller P. Induced PD-L1 expression mediates acquired resistance to agonistic anti-CD40 treatment. Cancer Immunol Res 2015;3:236–44. [DOI] [PubMed] [Google Scholar]
- 32.Maj T, Wang W, Crespo J, Zhang H, Wang W, Wei S, et al. Oxidative stress controls regulatory T cell apoptosis and suppressor activity and PD-L1-blockade resistance in tumor. Nat Immunol 2017;18:1332–41. [DOI] [PMC free article] [PubMed] [Google Scholar]
- 33.Jang JE, Hajdu CH, Liot C, Miller G, Dustin ML, Bar-Sagi D. Crosstalk between regulatory T cells and tumor-associated dendritic cells negates anti-tumor immunity in pancreatic cancer. Cell Rep 2017;20:558–71. [DOI] [PMC free article] [PubMed] [Google Scholar]
- 34.Postow MA, Callahan MK, Wolchok JD. Immune checkpoint blockade in cancer therapy. J Clin Oncol 2015;33:1974–82. [DOI] [PMC free article] [PubMed] [Google Scholar]
- 35.Snyder A, Makarov V, Merghoub T, Yuan J, Zaretsky JM, Desrichard A, et al. Genetic basis for clinical response to CTLA-4 blockade in melanoma. N Engl J Med 2014;371:2189–99. [DOI] [PMC free article] [PubMed] [Google Scholar]
- 36.Ribas A, Hu-Lieskovan S. What does PD-L1 positive or negative mean? J Exp Med 2016;213:2835–40. [DOI] [PMC free article] [PubMed] [Google Scholar]
- 37.Gajewski TF. The next hurdle in cancer immunotherapy: overcoming the non-T-cell-inflamed tumor microenvironment. Semin Oncol 2015;42: 663–71. [DOI] [PMC free article] [PubMed] [Google Scholar]
- 38.Herbst RS, Soria JC, Kowanetz M, Fine GD, Hamid O, Gordon MS, et al. Predictive correlates of response to the anti-PD-L1 antibody MPDL3280A in cancer patients. Nature 2014;515:563–7. [DOI] [PMC free article] [PubMed] [Google Scholar]
- 39.Oguejiofor K, Galletta-Williams H, Dovedi SJ, Roberts DL, Stern PL, West CM. Distinct patterns of infiltrating CD8+ T cells in HPV+ and CD68 macrophages in HPV-oropharyngeal squamous cell carcinomas are associated with better clinical outcome but PD-L1 expression is not prognostic. Oncotarget 2017;8:14416–27. [DOI] [PMC free article] [PubMed] [Google Scholar]
- 40.Oguejiofor K, Hall J, Slater C, Betts G, Hall G, Slevin N, et al. Stromal infiltration of CD8 T cells is associated with improved clinical outcome in HPV-positive oropharyngeal squamous carcinoma. Br J Cancer 2015; 113:886–93. [DOI] [PMC free article] [PubMed] [Google Scholar]
- 41.Balermpas P, Rodel F, Rodel C, Krause M, Linge A, Lohaus F, et al. CD8+ tumour-infiltrating lymphocytes in relation to HPV status and clinical outcome in patients with head and neck cancer after postoperative chemoradiotherapy: a multicentre study of the German cancer consortium radiation oncology group (DKTK-ROG). Int J Cancer 2016;138:171–81. [DOI] [PubMed] [Google Scholar]
- 42.Mandal R, Senbabaoglu Y, Desrichard A, Havel JJ, Dalin MG, Riaz N, et al. The head and neck cancer immune landscape and its immunotherapeutic implications. JCI Insight 2016;1:e89829. [DOI] [PMC free article] [PubMed] [Google Scholar]
- 43.Oweida A, Lennon S, Calame D, Korpela S, Bhatia S, Sharma J, et al. Ionizing radiation sensitizes tumors to PD-L1 immune checkpoint blockade in orthotopic murine head and neck squamous cell carcinoma. OncoImmunology 2017:e1356153. [DOI] [PMC free article] [PubMed]
- 44.Sakuishi K, Apetoh L, Sullivan JM, Blazar BR, Kuchroo VK, Anderson AC. Targeting Tim-3 and PD-1 pathways to reverse T cell exhaustion and restore anti-tumor immunity. J Exp Med 2010;207:2187–94. [DOI] [PMC free article] [PubMed] [Google Scholar]
- 45.Shayan G, Srivastava R, Li J, Schmitt N, Kane LP, Ferris RL. Adaptive resistance to anti-PD1 therapy by Tim-3 upregulation is mediated by the PI3K-Akt pathway in head and neck cancer. Oncoimmunology 2017;6: e1261779. [DOI] [PMC free article] [PubMed] [Google Scholar]
- 46.Li Z, Liu X, Guo R, Wang P. TIM-3 plays a more important role than PD-1 in the functional impairments of cytotoxic T cells of malignant Schwannomas. Tumour Biol 2017;39:1010428317698352. [DOI] [PubMed] [Google Scholar]
- 47.Zhou Q, Munger ME, Veenstra RG, Weigel BJ, Hirashima M, Munn DH, et al. Coexpression of Tim-3 and PD-1 identifies a CD8+ T-cell exhaustion phenotype in mice with disseminated acute myelogenous leukemia. Blood 2011;117:4501–10. [DOI] [PMC free article] [PubMed] [Google Scholar]
- 48.Sakuishi K, Ngiow SF, Sullivan JM, Teng MW, Kuchroo VK, Smyth MJ, et al. TIM3+FOXP3+ regulatory T cells are tissue-specific promoters of T-cell dysfunction in cancer. Oncoimmunology 2013;2:e23849. [DOI] [PMC free article] [PubMed] [Google Scholar]
- 49.Sun H, Gao W, Pan W, Zhang Q, Wang G, Feng D, et al. Tim3(+) Foxp3 (+) treg cells are potent inhibitors of effector T cells and are suppressed in rheumatoid arthritis. Inflammation 2017;40:1342–50. [DOI] [PubMed] [Google Scholar]
- 50.Gao X, Zhu Y, Li G, Huang H, Zhang G, Wang F, et al. TIM-3 expression characterizes regulatory T cells in tumor tissues and is associated with lung cancer progression. PLoS One 2012;7:e30676. [DOI] [PMC free article] [PubMed] [Google Scholar]
- 51.Gautron AS, Dominguez-Villar M, de Marcken M, Hafler DA. Enhanced suppressor function of TIM-3+ FoxP3+ regulatory T cells. Eur J Immunol 2014;44:2703–11. [DOI] [PMC free article] [PubMed] [Google Scholar]
- 52.Anderson AC, Joller N, Kuchroo VK. Lag-3, Tim-3, and TIGIT: co-inhibitory receptors with specialized functions in immune regulation. Immunity 2016;44:989–1004. [DOI] [PMC free article] [PubMed] [Google Scholar]
- 53.Kim JE, Patel MA, Mangraviti A, Kim ES, Theodros D, Velarde E, et al. Combination therapy with anti-PD-1, Anti-TIM-3, and focal radiation results in regression of murine gliomas. Clin Cancer Res 2017;23: 124–36. [DOI] [PMC free article] [PubMed] [Google Scholar]
- 54.Read S, Greenwald R, Izcue A, Robinson N, Mandelbrot D, Francisco L, et al. Blockade of CTLA-4 on CD4+CD25+ regulatory T cells abrogates their function in vivo. J Immunol 2006;177:4376–83. [DOI] [PMC free article] [PubMed] [Google Scholar]
- 55.Takahashi T, Tagami T, Yamazaki S, Uede T, Shimizu J, Sakaguchi N, et al. Immunologic self-tolerance maintained by CD25(+)CD4(+) regulatory T cells constitutively expressing cytotoxic T lymphocyte-associated antigen 4. J Exp Med 2000;192:303–10. [DOI] [PMC free article] [PubMed] [Google Scholar]
- 56.Setiady YY, Coccia JA, Park PU. In vivo depletion of CD4+FOXP3+ Treg cells by the PC61 anti-CD25 monoclonal antibody is mediated by FcgammaRIII+ phagocytes. Eur J Immunol 2010;40:780–6. [DOI] [PubMed] [Google Scholar]
- 57.Petersen RP, Campa MJ, Sperlazza J, Conlon D, Joshi MB, Harpole DH Jr., et al. Tumor infiltrating Foxp3+ regulatory T-cells are associated with recurrence in pathologic stage I NSCLC patients. Cancer 2006;107: 2866–72. [DOI] [PubMed] [Google Scholar]
- 58.Tang Y, Xu X, Guo S, Zhang C, Tang Y, Tian Y, et al. An increased abundance of tumor-infiltrating regulatory T cells is correlated with the progression and prognosis of pancreatic ductal adenocarcinoma. PLoS One 2014;9: e91551. [DOI] [PMC free article] [PubMed] [Google Scholar]
- 59.Ihara F, Sakurai D, Horinaka A, Makita Y, Fujikawa A, Sakurai T, et al. CD45RA(−)Foxp3(high) regulatory T cells have a negative impact on the clinical outcome of head and neck squamous cell carcinoma. Cancer Immunol Immunother 2017;66:1275–85. [DOI] [PMC free article] [PubMed] [Google Scholar]
- 60.Coombes JL, Siddiqui KRR, Arancibia-Cárcamo CV, Hall J, Sun C-M, Belkaid Y, et al. A functionally specialized population of mucosal CD103+ DCs induces Foxp3+ regulatory T cells via a TGF-β– and retinoic acid–dependent mechanism. J Exp Med 2007;204:1757–64. [DOI] [PMC free article] [PubMed] [Google Scholar]
- 61.Ke X, Zhang S, Xu J, Liu G, Zhang L, Xie E, et al. Non-small-cell lung cancer-induced immunosuppression by increased human regulatory T cells via Foxp3 promoter demethylation. Cancer Immunol Immunother 2016;65: 587–99. [DOI] [PMC free article] [PubMed] [Google Scholar]
- 62.Hsu P, Santner-Nanan B, Hu M, Skarratt K, Lee CH, Stormon M, et al. IL-10 potentiates differentiation of human induced regulatory T cells via STAT3 and foxo1. J Immunol 2015;195:3665–74. [DOI] [PubMed] [Google Scholar]
- 63.Xu L, Kitani A, Strober W. Molecular mechanisms regulating TGF-beta-induced Foxp3 expression. Mucosal Immunol 2010;3:230–8. [DOI] [PMC free article] [PubMed] [Google Scholar]
- 64.Tran DQ.TGF-beta: the sword, the wand, and the shield of FOXP3(+) regulatory T cells. J Mol Cell Biol 2012;4:29–37. [DOI] [PubMed] [Google Scholar]
- 65.Miyazaki M, Miyazaki K, Chen S, Itoi M, Miller M, Lu LF, et al. Id2 and Id3 maintain the regulatory T cell pool to suppress inflammatory disease. Nat Immunol 2014;15:767–76. [DOI] [PMC free article] [PubMed] [Google Scholar]
- 66.Ayers M, Lunceford J, Nebozhyn M, Murphy E, Loboda A, Kaufman DR, et al. IFN-gamma-related mRNA profile predicts clinical response to PD-1 blockade. J Clin Invest 2017;127:2930–40. [DOI] [PMC free article] [PubMed] [Google Scholar]
- 67.Chang JH, Kim YJ, Han SH, Kang CY. IFN-gamma-STAT1 signal regulates the differentiation of inducible Treg: potential role for ROS-mediated apoptosis. Eur J Immunol 2009;39:1241–51. [DOI] [PubMed] [Google Scholar]
- 68.Hofer MJ, Li W, Manders P, Terry R, Lim SL, King NJ, et al. Mice deficient in STAT1 but not STAT2 or IRF9 develop a lethal CD4+ T-cell-mediated disease following infection with lymphocytic choriomeningitis virus. J Virol 2012;86:6932–46. [DOI] [PMC free article] [PubMed] [Google Scholar]
- 69.Ma H, Lu C, Ziegler J, Liu A, Sepulveda A, Okada H, et al. Absence of Stat1 in donor CD4(+) T cells promotes the expansion of Tregs and reduces graft-versus-host disease in mice. J Clin Invest 2011;121:2554–69. [DOI] [PMC free article] [PubMed] [Google Scholar]
- 70.Tan M, Myers JN, Agrawal N. Oral cavity and oropharyngeal squamous cell carcinoma genomics. Otolaryngol Clin North Am 2013;46:545–66. [DOI] [PMC free article] [PubMed] [Google Scholar]
- 71.Cortez MA, Ivan C, Valdecanas D, Wang X, Peltier HJ, Ye Y, et al. PDL1 Regulation by p53 via miR-34. J Natl Cancer Inst 2016;108(1). [DOI] [PMC free article] [PubMed] [Google Scholar]
- 72.Zitvogel L, Kroemer G. CANCER. A p53-regulated immune checkpoint relevant to cancer. Science 2015;349:476–7. [DOI] [PubMed] [Google Scholar]
- 73.Munoz-Fontela C, Mandinova A, Aaronson SA, Lee SW. Emerging roles of p53 and other tumour-suppressor genes in immune regulation. Nat Rev Immunol 2016;16:741–50. [DOI] [PMC free article] [PubMed] [Google Scholar]
- 74.Wieser V, Gaugg I, Fleischer M, Shivalingaiah G, Wenzel S, Sprung S, et al. BRCA1/2 and TP53 mutation status associates with PD-1 and PD-L1 expression in ovarian cancer. Oncotarget 2018;9:17501–11. [DOI] [PMC free article] [PubMed] [Google Scholar]
- 75.Dong ZY, Zhong WZ, Zhang XC, Su J, Xie Z, Liu SY, et al. Potential predictive value of TP53 and KRAS mutation status for response to PD-1 blockade immunotherapy in lung adenocarcinoma. Clin Cancer Res 2017;23:3012–24. [DOI] [PubMed] [Google Scholar]
- 76.Davis RJ, Moore EC, Clavijo PE, Friedman J, Cash H, Chen Z, et al. Anti-PD-L1 efficacy can be enhanced by inhibition of myeloid-derived suppressor cells with a selective inhibitor of PI3Kdelta/gamma. Cancer Res 2017;77: 2607–19. [DOI] [PMC free article] [PubMed] [Google Scholar]
- 77.De Henau O, Rausch M, Winkler D, Campesato LF, Liu C, Cymerman DH, et al. Overcoming resistance to checkpoint blockade therapy by targeting PI3Kgamma in myeloid cells. Nature 2016;539:443–7. [DOI] [PMC free article] [PubMed] [Google Scholar]
Associated Data
This section collects any data citations, data availability statements, or supplementary materials included in this article.