Abstract
Many inorganic nanoparticles have been prepared and their behaviors in living systems are investigated. Yet, common electrolytes such as NaCl have been left out of this campaign. The underlying assumption is that electrolyte nanoparticles would quickly dissolve in water and behave similarly as their constituent salts. Herein, we challenge this preconception. Our study shows that NaCl nanoparticles (SCNPs) but not salts are highly toxic to cancer cells. This is because SCNPs enter cells through endocytosis, bypassing cell regulations on ion transport. When dissolved inside cancer cells, SCNPs cause a surge of osmolarity and rapid cell lysis. Interestingly, normal cells are much more resistant to the treatment due to their relatively low sodium levels. Unlike conventional chemotherapeutics, SCNPs cause immunogenic cell death or ICD. In vivo studies show that SCNPs not only kill cancer cells but also boost an anticancer immunity. Our discovery opens up a new perspective on nanoparticle-based therapeutics.
Keywords: nanoparticles, cancer, osmosis, apoptosis, immunogenic cell death
Graphical Abstract
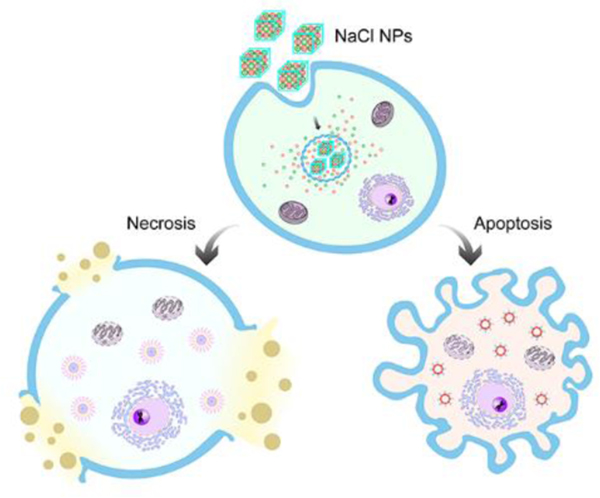
NaCl nanoparticles are exploited as a novel type of cancer therapeutics. NaCl nanoparticles are taken up by cancer cells through endocytosis and release large amounts of ions inside them. This causes a drastic increase of osmolarity, leading to cell apoptosis and necrosis. This process is highly immunogenic, stimulating an anti-cancer immunity that improves local and systemic tumor control.
Mammalian cells sustain low ratios of intracellular to extracellular sodium and chloride, and high ratios of potassium.[1] These asymmetric ionic gradients are critical to cell functions, driving essential cellular processes including the transport of amino acids, maintenance of cellular pH, and control of cell volume.[2] Lowering the extracellular concentrations of sodium and chloride, for instance by immersing cells in a hypotonic solution, causes cytoskeleton destruction, cell cycle arrest, and cell lysis.[3] Elevating intracellular osmolarity may induce similar effects, but it is difficult to achieve because ion transport is tightly regulated by live cells.
We hypothesize that sodium chloride nanoparticles (SCNPs) can be exploited as a Trojan-horse strategy to deliver ions into cells and disrupt the ion homeostasis. Each SCNP contains with it millions of sodium and chlorine atoms, but they are not checked at the ion pumps/channels for cell entry.[4] Instead, SCNPs would enter cells through endocytosis, passing through the otherwise impervious plasma membrane.[5] Due to high water solubility, SCNPs would be dissolved inside cells and release Na+ and Cl−. Because of the opposing osmotic gradients across the plasma membrane, these ions would be trapped inside cells, leading to an osmolarity increase. We postulate that this osmolarity change will tremendously affect cell functions.[6]
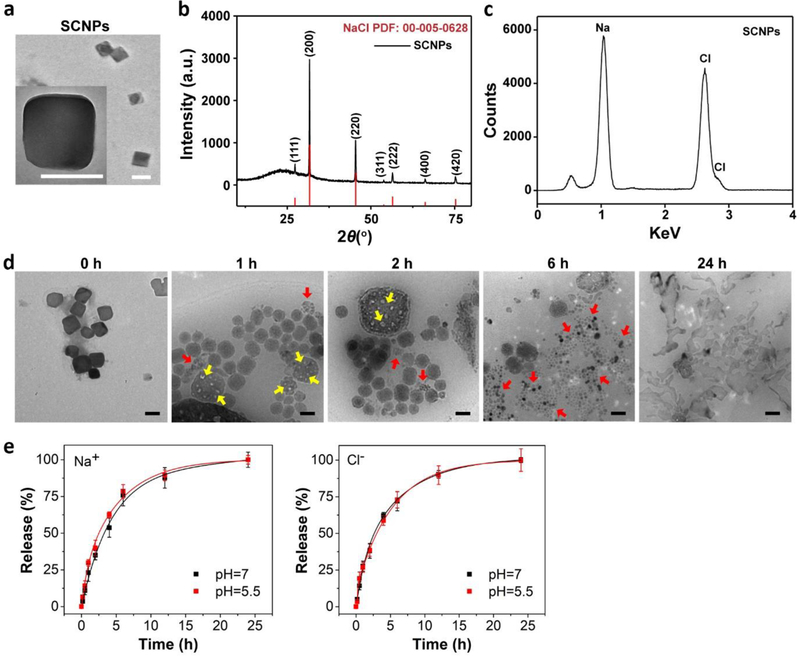
To test the hypothesis, we synthesized SCNPs through a microemulsion reaction. The reaction took place in a hexane/ethanol mixed solvent, with sodium oleate and molybdenum chloride as sodium and chloride precursors, and oleylamine as a surfactant. A typical reaction yields ~77 ± 10.6 nm SCNPs as determined by Transmission Electron Microscopy (TEM) (Figure 1a). Dynamic Light Scattering (DLS) found that their hydrodynamic size was 84.6 ± 9.8 nm with a narrow size distribution (Figure S1a). Other sizes of SCNPs (15 to 100 nm) can be prepared by tuning reaction conditions (Figure S1b). X-ray powder diffraction (XRD) found that the crystal structure of the particles was cubic phase NaCl (Fm-3m, PDF No.: 00–005-0628, Figure 1b). Energy dispersive spectroscopy (EDS) confirmed that sodium and chloride molar ratio was ~1:1 (Figure 1c, Figure S1c), with negligible impurities including molybdenum (Figure S1c).
Figure 1. Physical characterizations of SCNPs.
a, A representative TEM image of SCNPs. Inset: a zoomed-in TEM image of a single SCNP. Scale bars, 100 nm. The average of particle size was determined by measuring over 100 particles from the TEM images. b, XRD pattern of as-synthesized NaCl (black) and NaCl standard (red, PDF: 00–005-0628). c, EDS spectrum of SCNPs. d, TEM images showing the degradation of PSCNPs in water over time. The NaCl nanocrystals were gradually decomposed, manifested in the formation of cavities on the particle surface at early time points (yellow arrows) and their reduction into smaller pieces after 6 h (red arrows). Complete nanoparticle dissolution was observed at 24 h. Scale bars, 100 nm. e, Release profiles for Na+ (left) and Cl− (right), examined with PSCNPs in ammonium acetate buffer solutions with a pH value of either 7.0 or 5.5. The quantification was based on Na+ electrode and MQAE fluorescence intensity changes.
The as-synthesized SCNPs are hydrophobic (Figure S1d) because of the oleylamine coating (Fourier Transform Infrared Spectroscopy, Figure S1e). To transfer nanoparticles into aqueous solutions, we imparted a layer of PEGylated phospholipid, DSPE-PEG2000 amine, onto the nanoparticle surface. The resulting, phospholipid coated SCNPs (designated as PSCNPs, Figure S1f) can be well dispersed in aqueous solutions (Figure S1d). They bore a slightly increased hydrodynamic size (98.0 ± 13.1 nm, Figure S1a) compared to un-coated SCNPs and a positive surface charge (+9.7 mV, Figure S1g). The phospholipid coating grants the NaCl nanocrystals with extended lifetimes, but it does not stop the particles from degradation in water. TEM analysis found small cavities on the nanocrystal surface when PSCNPs were incubated in water for 1–6 h (Figure 1d). Further incubation led to particle disintegration and eventually complete dissolution at 24 h (Figure 1d). To better understand the process, we analyzed ion release from PSCNPs in sodium- and chlorine-free ammonium acetate buffers (pH = 7.0 or 5.5) using Na+ electrode and MQAE, a Cl− sensor. We observed comparable release profiles for the two ions, both reaching a plateau at ~12 h (Figure 1e).
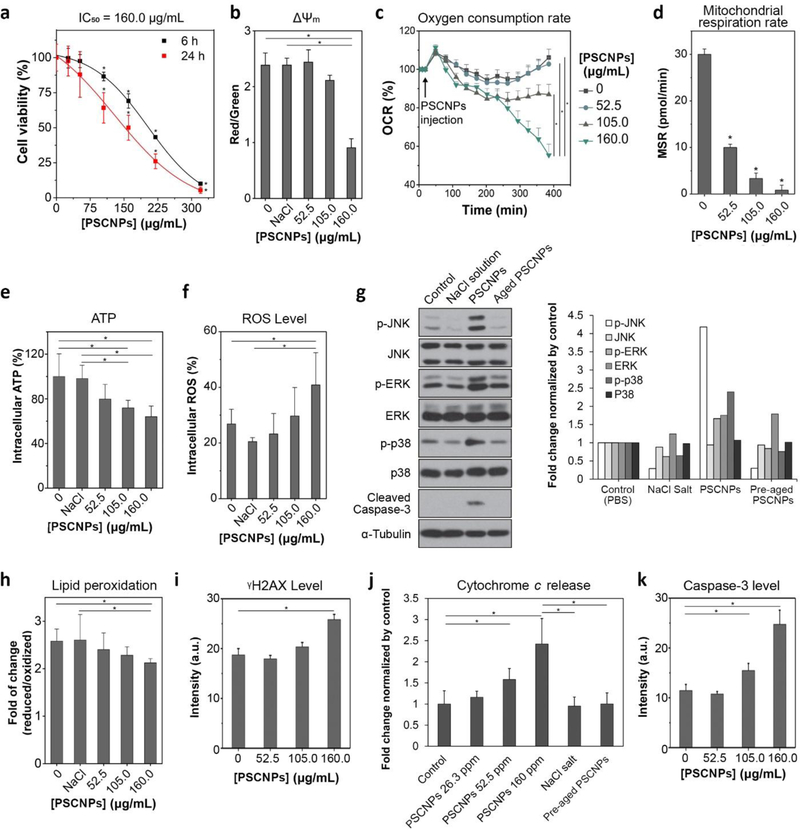
We then studied the impact of PSCNPs on cell viability. We started with PC-3 cells, which are a human prostate adenocarcinoma cell line. MTT assay found time- and dose-dependent cytotoxicity of PSCNPs (Figure 2a). A 24-h IC50 of 160 μg/mL (NaCl concentration, the same below) was determined by Origin 9 using DoseResp (Figure 2a). Similar results were observed with Calcein AM/PI live/dead assays (Figure S2). As a comparison, NaCl salt and free phospholipid showed no toxicity to PC-3 cells (Figure S3). The cytotoxicity was mitigated when PSCNPs were aged before cell incubation. For instance, when PSCNPs were incubated in PBS for 1, 3, and 8 h, before added to a culture medium, the cell viability was increased to 60.6%, 82.4%, and 89.2%, respectively. When the pre-incubation time exceeded 8 h, the particles became completely non-toxic to cells (Figure S3). These observations suggest that the cytotoxicity of PSCNPs is associated with the NaCl nanocrystals rather than the constituent electrolytes or phospholipids.
Figure 2. PSCNPs induce intrinsic apoptosis.
a, Cell viability, measured by MTT assays in PC-3 cells after 6 and 24 h incubation with PSCNPs at the concentration from 26.3 to 320 μg/mL. (* p< 0.05 compare to PBS treated control cells) b, Mitochondrial membrane potential changes (ΔΨm), assessed by JC-1 staining at 6 h. The imaging results are shown in Figure S7. JC-1 red/green (aggregate/monomer) fluorescence intensity ratio was significantly decreased when PC-3 cells were incubated with 160.0 μg/mL PSCNPs. The statistic was based on the analysis on 5000 individual cells (* p< 0.05). c, OCR changes, assessed by Seahorse Mitochondrial Stress Assay. The readings were normalized to the baseline OCR prior to PSCNPs injection. Relative to PBS treated cells, the 6 h basal was decreased by 2.3%, 18.1% and 47.9% in cells treated with 52.5, 105.0, and 160.0 μg/mL of PSCNPs, respectively (* p< 0.05). d, MSR changes, assessed in support of ATP production (i.e. oxidative phosphorylation) at 6 h. MSR was decreased from 30.0 pmol/min in normal cells to 10.0, 3.3, and 0.9 pmol/min, respectively, in cells treated with PSCNPs at 52.5, 105.0, or 160.0 μg/mL (* p< 0.05 compare to PBS treated control cells). e, Intracellular ATP levels, analyzed by Luminescent ATP Detection Assay at 6 h. The readings were normalized to PBS treated cells. A higher PSCNP concentration was associated with lower ATP production (* p< 0.05). f, Intracellular ROS levels, analyzed by DCFH-DA assay at 6 h. The readings were normalized to PBS treated cells. A dose-dependent ROS production was observed after PSCNP treatment (* p< 0.05). The staining images are shown in Figure S8. g, Impact of PSCNPs on JNK, ERK and p38 protein kinases, assessed by Western blot. PC-3 cells were incubated with PSCNPs (160 μg/mL) for 6 h before the analysis. PBS, NaCl salt (160 μg/mL), and degraded PSCNPs (aged for 24 h before experiments, 160 μg/mL) were used as controls. Quantitative analysis results were shown as histograms in the right. h, Lipid peroxidation, assessed by Lipid Peroxidation Sensor Assay at 24 h (* p< 0.05). i, DNA damage at 24 h, based on γH2AX staining results in Figure S9 (* p< 0.05). j, Cytochrome c release, analyzed by ApoTrack™ Cytochrome c Apoptosis ICC Antibody Kit at 6 h (* p< 0.05). Representative images are shown in Figure S10 and the fluorescence signals were quantified by ImageJ (n = 1000 cells). k, Caspase-3 activity, assessed by anti-caspase-3 antibody staining at 24 h (n = 5000 cells, * p< 0.05). The microscopy results were shown in Figure S9.
We next examined the uptake of PSCNPs by cells and their fate inside them. To this end, we labeled PSCNPs with rhodamine B (Supporting Information) and stained cell endosomes/lysosomes with LysoTracker. We then acquired time-relapse live cell images and analyzed the fluorescence intensities of individual cells (n = 5000 for each time point, Figure S4a). We observed time- and concentration-dependent increase of intracellular rhodamine B signals, and good spatial overlap between the rhodamine B and LysoTracker signals (Figure S4b–e). This suggests that PSCNPs were taken up by cells through endocytosis, which is consistent with observations with other phospholipid-coated nanoparticles.[7] Meanwhile, SBFI-AM and MQAE staining found a consistent increase of intracellular Na+ (Figure S5) and Cl− concentrations (Figure S6; notably, the MQAE signals are reversely correlated with Cl− concentrations[8]). Generalized linear regression analysis also showed good correlation between rhodamine B and SBFI-AM or MQAE signals (Figure S5b, S6b), indicating that PSCNPs were gradually degraded inside cells and released the constituent ions.
This increase of intracellular osmolarity would extensively affect cell functions. One of the most susceptible organelles is mitochondrion, whose membrane potential (ΔΨm) is sensitive to cytosol osmolarity changes. Indeed, JC-1 staining found that ΔΨm was largely depolarized when cells were incubated with 160.0 μg/mL PSCNPs for 6 h (Figure 2b, Figure S7). This led to a halt of the mitochondrial functions. Specifically, Seahorse mitochondrial stress assay showed that the mitochondrial oxygen consumption rate (OCR) and mitochondrial respiration rate (MSR) were reduced by 47.9% and 91.0%, respectively, when cells were incubated with 160 μg/mL PSCNPs for 6 h (Figure 2c, d). The reduced OCR and MSR in turn affect ATP and reactive oxygen species (ROS) production at the Complex I and III of the mitochondrial respiratory chain. Relative to control cells, the intracellular ATP level was decreased by 36.0% (Figure 2e), and the ROS level was increased by 22.3% at 6 h (Figure 2f, Figure S8). Western blotting found significantly increased levels of JNK, ERK, and p38 phosphorylation (Figure 2g), also confirming elevated oxidative stress.[9] This was further corroborated by the observation of increased lipid peroxidation (Figure 2h) and DNA damage (γH2AX staining, Figure 2i and Figure S9) in PSCNPs treated cells. Meanwhile, the dissipated mitochondrial membrane led to the release of cytochrome c (Figure 2j, Figure S10). All these impacts converged on the induction of cell apoptosis, indicated by elelvated caspase-3 activity (Figure 2 g & k, and Figure S9).
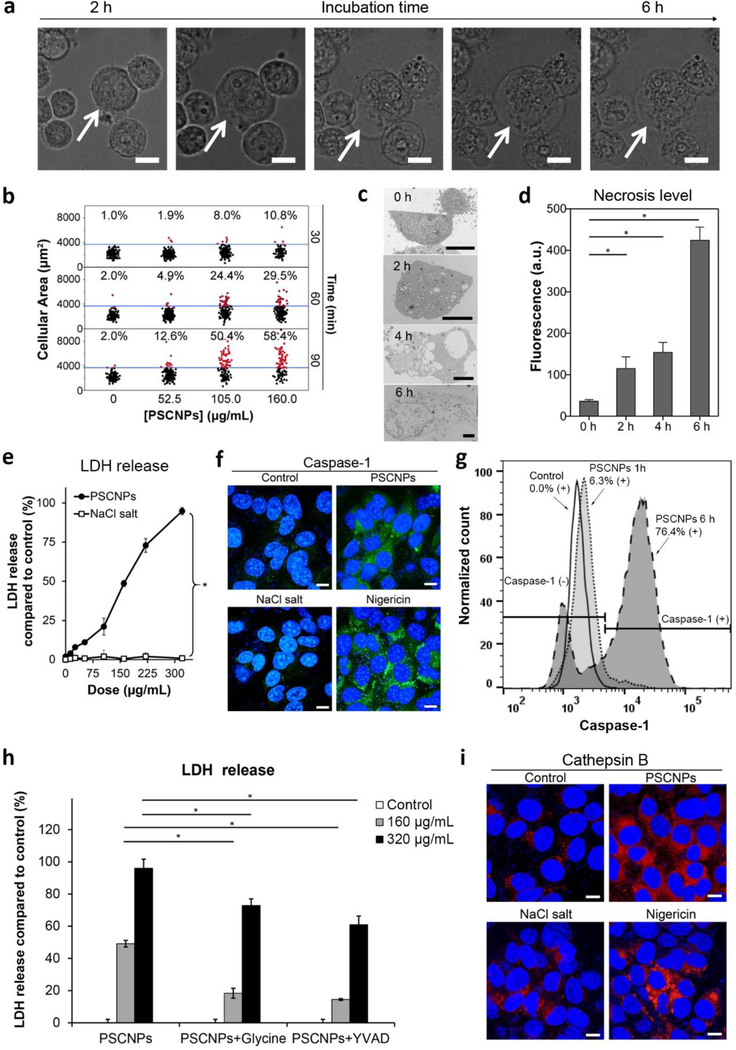
On the other hand, microscopic imaging found extensive cell swelling and giant bleb formation only a few hours after incubation with PSCNPs (Figure 3a). These are signs of necrosis rather than apoptosis. Specifically, time-lapsed imaging and pixel intensity analysis (n = 5000 cells) found that the average cell area was increased by 10.8, 29.5, and 58.4%, respectively, at 30, 60, and 90 min, when the starting PSCNP concentration was 160.0 μg/mL (Figure 3b, Figure S11). Eventually, the inflow led to cell rupture and complete osmotic lysis, which was recorded by both live cell imaging (Figure 3a, Movies S1–S4) and TEM (Figure 3c) between 2–6 h. The cell membrane breach was also confirmed by Annexin V/EthD-III double staining (Figure 3d, Figure S12) and LDH assays (Figure 3e). Impressively, 94.8% LDH release was recorded when cells were incubated with 320 μg/mL PSCNPs for 6 h (Figure 3e). To better understand the process, we established a coarse-grained liposome simulation model by a LAMMPS package (Figure S13).[10] We assessed the relationship between the change of concentration gradient across the plasma membrane (Δϲ) and the membrane tension (γ), and used it to predict the threshold at which plasma membrane starts to breach (Supporting Information). Δϲ is related to the chemical osmotic pressure difference due to the imbalance of interior and exterior ion concentrations as well as the volume of water molecules passing through the unit area of the plasma membrane. The simulation estimates that the cell rupture will occur when Δc is in the range of 50 mM – 500 mM (Figure S14). This agrees well with our experimental results, which detected a Δϲ of more than 50 mM between 4–6 h (Table S1).
Figure 3. PSCNPs induce pyroptosis.
a, Cell morphology changes over time. PC-3 cells were incubated with PSCNPs (160.0 μg/mL), and were dynamically monitored on a Cellomics® ArrayScan® VTI HCS Reader using a live cell chamber. Cell volume expansion started at 2 h and led to cell burst at 6 h. Scale bars, 50 μm. b, Cell volume changes, based on the statistics of 5000 cells. The 98% quantile of PBS treated cells (37500 pixels) was set as the threshold. Cells having areas above the threshold were marked as red dots, and those below the threshold marked black. Concentration- and time-dependent cell expansion was observed after PSCNP treatment. c, Representative TEM images of PSCNP-treated PC-3 cells at 160.0 μg/mL. Cell membrane was completely dismantled at 6 h. Scale bars, 5 μm. d, Cell necrosis analysis using EthD-III staining based on the imaging results from Figure S12. e, LDH release, assessed by LDH Assay Kit-WST. PC-3 cells were incubated with PSCNPs or NaCl salt (13.2–320 μg/mL) for 6 h. All the readings were normalized to lysing control cells (* p<0.05). f, Confocal microscopy to assess caspase-1 activation. PC-3 cells were incubated with PSCNPs (160.0 μg/mL) for 6 h and stained with FAM-FLICA® Caspase-1 Assay kit. PBS and NaCl salt (160.0 μg/mL) were used as negative controls, while Nigericin (20 μM) was used as a positive control. Blue, DAPI (nucleus); Green, caspase-1. Scale bars, 10 μm. g, Flow cytometry to evaluate caspase-1 activation after PSCNP treatment (160.0 μg/mL). h, LDH release to assess the suppression of glycine and Ac-YVAD-cmk to cell necrosis. PC-3 cells were pre-incubated with necrotic cell death inhibitor glycine or caspase-1 inhibitor Ac-YVAD-cmk for 1 h. PSCNPs (160 and 320 μg/mL) were then incubated with cells for 6 h. LDH release was measured by LDH Assay Kit-WST (* p< 0.05). i, Cathepsin B release. PC-3 cells were incubated with PSCNPs (160.0 μg/mL) for 6 h. PBS and NaCl salt (160.0 μg/mL) were used as negative controls, while Nigericin (20 μM) was used as a positive control. Blue, DAPI (nucleus); red, Magic Red (cathepsin B). Scale bars, 10 μm.
Interestingly, the cell lysis was not mere a physical process; rather, we found that it was mediated, at least in part, by pyroptosis, also known as caspase-1-depedent cell death.[11] Pyroptosis is a form of programed necrosis, and is characteristic of inflammasome induction, pro-inflammatory cytokine release, and caspase-1 activation.[12] The activated caspase-1 promotes the release of the N-terminal of gasdermin-D (GSDMD) proteins, which translocate to the plasma membrane and perforate it, causing water inflow.[13] We found that PSCNPs treatment led to significantly increased caspase-1 activity (FAM-FLICA caspase-1 staining, Figure 3f). Flow cytometry confirmed that caspase-1 activity was increased by 76.4% when cells were incubated with 160 μg/mL PSCNPs for 6 h (Figure 3g). We also assessed two necrosis inhibitors, glycine and Ac-YVAD-cmk peptide. While glycine is a general necrosis inhibitor,[14] Ac-YVAD-cmk selectively blocks the activation of caspase-1.[15] Both agents were effective at suppressing cell lysis, reducing LDH release by 72.9% and 60.9%, respectively (Figure 3h). The activation of pyroptosis pathway was also confirmed by NLRP3 inflammasome induction, GSDMD N-terminal fragment release (Figure S15), and elevated IL-1β secretion (Figure S16).
Conventionally, pyroptosis is observed in immune cells upon the detection of pathogen infection by toll-like receptors (TLR) or NOD-like receptors (NLRs).[16] How PSCNPs trigger caspase-1 activation in cancer cells is unknown. One possibility is that the osmotic pressure induced by PSCNPs causes endosomes/lysosomes to rupture, leading to the release of cathepsin B to the cytosol.[17] Cathepsin B induces the formation of NLRP3 inflammasomes,[18] which in turn activates caspase-1. This hypothesis is supported by Magic Red staining, which found a diffusive distribution pattern of cathepsin B in PSCNP treated cells (as opposed to a punctate distribution in untreated cells, Figure 3i). Moreover, live cell imaging recorded a reduced level of LysoTracker positive staining in PSCNP treated cells after 2 h, also indicating endosome/lysosome rupture (Figure S4a, b). Another possibility is that caspase-1 activation is triggered by K+ efflux. This is based on the observation that in addition to Na+ and Cl−, the intracellular K+ level was also elevated after incubation with PSCNPs (Figure S17), possibly as a result of Na+/K+ pump activities in response to an increased Na+ level. This would further exacerbate potassium charge separation, leading to a hyperpolarized plasma membrane, which was supported by DiBAC4 staining results (Figure S18). The enhanced potassium gradient would facilitate K+ efflux, a known trigger of pyroptosis.[19] Notably, mitochondrial breach and cytochrome c release does not occur in conventional pyroptosis.[20] This indicates that PSCNP treatment may simultaneously activate both pyroptosis and apoptosis pathways (Figure S19): at high PSCNP doses and early time points, cells mainly die of caspase-1-dependent pyroptosis (Figure S20), whereas at low doses and late time points, cells die of caspase-3-dependent apoptosis (Figure S20) due to cumulative oxidative stress and DNA/lipid damage (Figure 2f, i, k and Figure S9).
We next examined the cytotoxicity of PSCNPs with other cell lines (Figure 4a). We found that the viability of normal cells such as HPrECs (human primary prostate epithelial cell line) and C18–4 (mouse spermatogonial stem cell) was minimally affected by PSCNPs in the tested concentration range (13.2 to 320 μg/mL, Figure 4a). As a comparison, all cancer cells were effectively killed by PSCNPs, with IC50 values ranging from 50 to 160 μg/mL (Figure 4a). This selective toxicity is intriguing. One reason is that fast proliferating cells tend to take up more nanoparticles.[21] But this does not explain why RAW264.7 cells, a phagocytic macrophage cell line, were also relatively resistant to PSCNPs (Figure 4a). Another plausible factor is that cancer cells possess high intracellular sodium concentrations ([Na+]int), making them inherently more susceptible to PSCNPs-induced osmotic shock. In the 70s’, Cone et al. proposed that an elevated [Na+]int and a relatively depolarized plasma membrane are shared characteristics of cancer cells.[22] This was confirmed by the follow-up elemental analysis studies,[23] with some reporting that the [Na+]int/[K+]int ratio in cancer cells could be 5 times higher than normal cells.[24] Indeed, our [Na+]int analysis showed that all tested cancer cells have a higher [Na+]int than macrophages and primary cells (Figure 4b). K-means clustering clearly reveals the difference between cancer cells and primary cells with regard to cytotoxicity and its correlation with cells’ [Na+]int (Figure 4b). Among cancer cells, there is a moderate correlation between [Na+]int and IC50, with a Pearson correlation coefficient R2 of 0.31 (Figure 4b). These results support [Na+]int as an important factor for relative sensitivity of cancer cells to PSCNPs. It is believed that cancer cells adopt a high [Na+]int as an anti-apoptotic measure (apoptosis is characteristic of cell shrinkage), which makes them intrinsically susceptible to PSCNP induced cell necrosis.
Figure 4. In vivo therapy with PSCNPs.
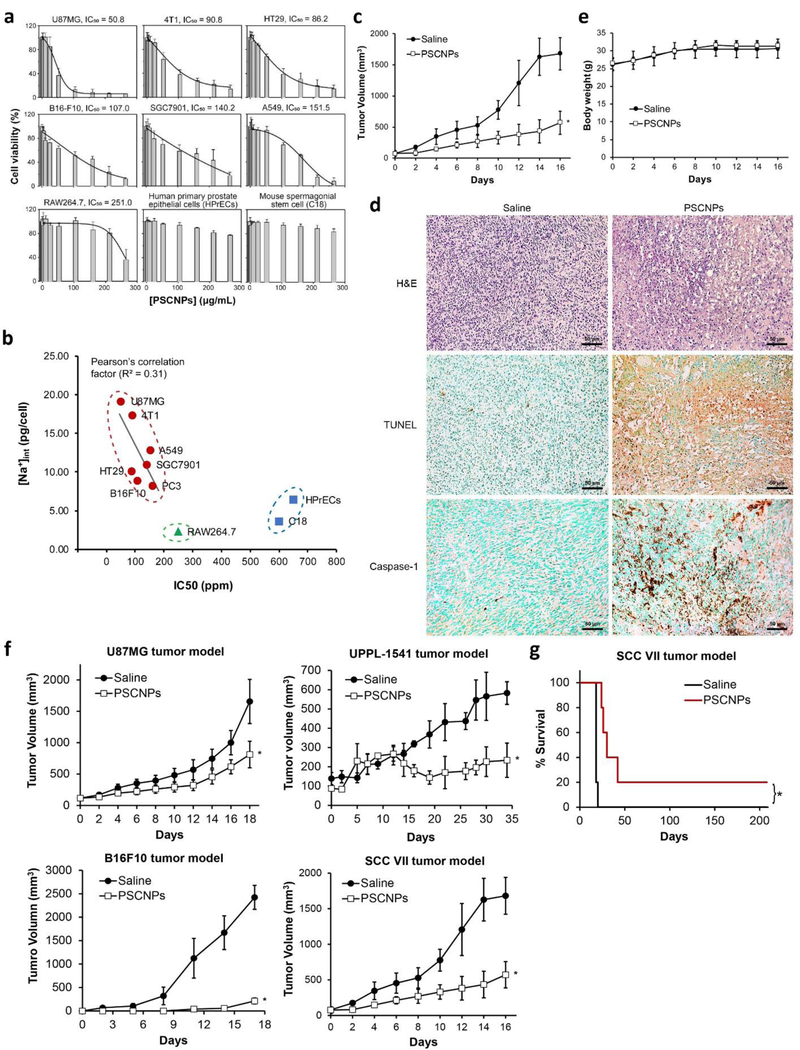
a, cytotoxicity against a panel of cell lines, measured by MTT assays. While cancer cells were effectively killed by PSCNPs, normal cells were highly resistant. IC50 values were determined by DoseResp of Origin 9. b, The correlation between intracellular sodium content [Na+]int and IC50. [Na+]int of each cell line was determined using a Na+ electrode. K-means clustering algorithm was used to evaluate the correlation between [Na+]int and IC50. c-e, In vivo PC-3 tumor therapy outcomes. PSCNPs or saline with the same NaCl dose (9 mg/mL, 50 μL) were i.t. injected into PC-3 tumor xenografts (n = 5). Tumors were dissected 16 days after the treatment. c, Tumor growth curves (* p < 0.05 compared to saline group). d, Post-mortem histopathology on tumor tissues by H&E, TUNEL, and caspase-1 staining. Scale bars, 50 μm. e, Animal body weight changes. f, In vivo tumor therapy and tumor growth curves for other tumor models, including U87MG, UPPL-1541, B16F10, and SCC VII (* p < 0.05 compared to saline group). g, Animal survival curves in SCC VII tumor model (* p < 0.05).
We further tested PSCNPs as a potential cancer therapeutic in vivo. We started with a subcutaneous tumor model established with PC3 cells on male nude mice (n = 5). When the tumor size reached 100 mm3, we intratumorally (i.t.) injected PSCNPs (50 μL, 9 mg/mL, in PBS) to the animals every other day for a total of 3 injections. For control, we i.t. injected NaCl saline (9 mg/mL) at the same NaCl dose. Relative to the control, PSCNP treatment suppressed tumor growth by 66% on Day 16 (Figure 4c, Figure S21). Post-mortem hematoxylin/eosin (H&E) staining exhibited large areas of nuclear shrinkage and fragmentation in tumor tissues (Figure 4d). Both TUNEL and anti-caspase-1 assays found extensive positive staining in PSCNP treated tumors, suggesting cell death through both apoptosis and pyroptosis (Figure 4d). Meanwhile, there was no body weight drop throughout the study (Figure 4e) and no sign of toxicity to major organs (Figure S22). Similar treatment outcomes were observed with other subcutaneous tumor models, including U87MG (human glioblastoma), UPPL-1541 (mouse bladder cancer), B16F10 (mouse melanoma), and SCC VII (mouse head and neck squamous carcinoma) (Figure 4f, Figure S23).
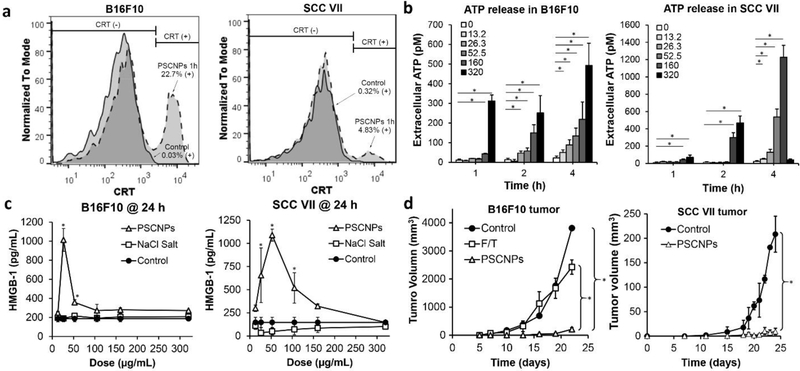
One interesting observation is that overall, much better treatment outcomes were seen in syngeneic tumor models (UPPL-1541, B16F10 and SCC VII) than xenograft tumor models (PC-3, U87MG). Taking SCC VII tumors for instance, 20% of the mice became tumor free after PSCNP treatment and survived for more than 8 months (Figure 4g). These results indicate that in immunocompetent mice, PSCNPs may not only kill cancer cells, but also stimulate an anticancer immunity. This is not surprising because necrosis is a highly immunogenic process.[25] In addition, we found that cancer cells succumbing to PSCNPs showed increased surface presentation of calreticulin (CRT) (Figure 5a), as well as elevated secretion of adenosine triphosphate (ATP) (Figure 5b), and high mobility group box 1 (HMGB-1) (Figure 5c), all of which are established hallmarks of immunogenic cell death or ICD.[26] It was noted from previous studies that CRT, HMGB-1 and ATP can bind to pattern recognition receptors (PRRs) on dendritic cells (DCs) (e.g. CD91 [27] and SR-A [27b, 28] for CRT, RAGE, TLR2/4/9 for HMGB-1,[25a] and P2RX7/P2RY2 for ATP [25a, 27c]). This promotes DC migration, maturation and antigen cross presentation to T cells, and in turn boosts cellular immunity against tumors.[27c, 29] To further investigate, we performed a vaccination study with PSCNPs. We killed B16F10 cells by either PSCNPs or freeze thaw (F/Z) treatment (a common method in vaccine preparation), and subcutaneously inoculated the dead cells to healthy C57BL/6 mice. On Day 7, we injected live B16F10 cells to the contralateral flank of the animals. Mice vaccinated with PSCNP-killed cancer cells showed much greater resistance to a subsequent live cancer cell challenge, with all animals remaining tumor-free for more than 2 weeks (Figure 5d). Similar results were observed with SCC VII cells in C3H mice (Figure 5d).
Figure 5. PSCNPs induce ICD.
a, Histograms of CRT presentation on dying B16F10 and SCC VII cells. Cells were treated with 160 μg/mL PSCNPs for 2 h. b, Time- and dose-dependent ATP release from B16F10 and SCC VII cells treated by PSCNPs (13.2–320 μg/mL; * p < 0.05) for 1, 2 and 4 h. c, HMGB-1 release from B16F10 and SCC VII cells after PSCNP treatment (13.2–320 μg/mL) at 24 h. NaCl salt and PBS were studied as controls. Reduced HMGB-1 secretion at very high concentration were due to extensive cell death at 24 h. (* p < 0.05 compared to PBS treated control cells) d, In vivo vaccination approach induced by NaCl NPs treatment. A line graph shows tumor growth of B16F10 or SCC VII in the contralateral flank (* p < 0.05). One time vaccination of dying B16F10 cells (2×10⁵) was generated by Freeze and Thaw (F/T) or PSCNPs treatment, followed by subcutaneous (SC) injecting live B16F10 cells (2×10⁵) on the contralateral side. 2 rounds of dying SCC VII cells (2×10⁵) vaccination were generated by NaCl NPs treatment, with 6 days apart, followed by SC injecting live SCC cells (2×10⁵) on the contralateral side.
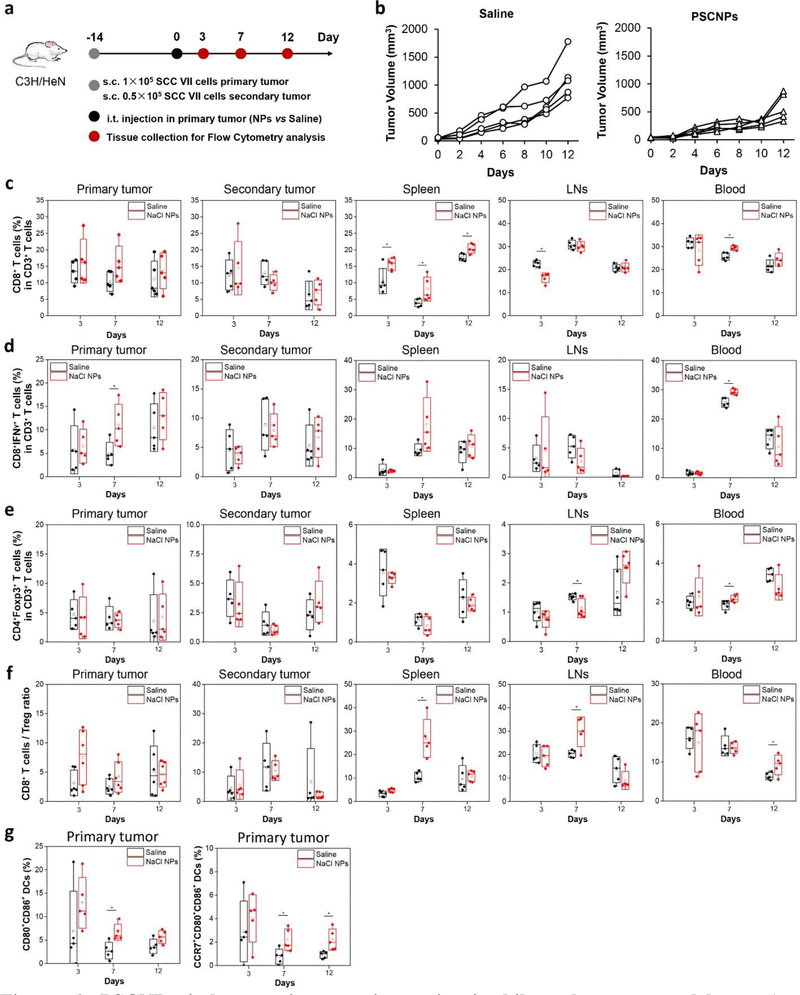
Next, we examined the anticancer immunity in a syngenic bilateral tumor model established with SCC VII cells (Figure 6). Briefly, we intratumorally injected PSCNPs or saline into the primary tumors, but left the contralateral tumor (secondary tumor) untreated (Figure 6a). We found that the secondary tumors in the PSCNP group grew at a much lower speed than the saline control, showing a tumor inhibition rate of 53% on Day 12 (Figure 6b and Figure 24a). Meanwhile, there was no body weight drop throughout the study (Figure S24b). In a separate study, we euthanized animals on Day 3, 7, and 12 post particle/saline injection, harvested tumors, spleen, blood, and tumor-draining lymph nodes (TDLNs), and analyzed leucocyte profiles by flow cytometry. Relative to the saline control, PSCNP injection led to increased CD8+ T cell frequencies, which was the most significant in the spleen samples at all three time points (Figure 6c). In particular, effector T cell (CD8+IFN-γ+) population was increased in the primary tumor and blood on Day 7 (Figure 6d). The CD8+/Treg (CD4+Foxp3+) ratio was also increased in the primary tumor, spleen, TDLNs, and blood on Day 7 and 12 (Figure 6f). Interestingly, blood B cell (B220+CD19+) frequency was also elevated relative to the saline control on Day 7 and 12, suggesting the possibility of enhanced humoral immunity (Figure S25). One main factor behind the boosted adaptive immune response was ICD promoted DC infiltration and maturation.[27c] Indeed, we observed increased numbers of activated DCs (CD80+CD86+) and TDLN-homing DCs (CD80+CD86+CCR7+) in the primary tumors on Day 7 and 12 (Figure 6g). Collectively, the results suggest that PSCNPs killed cancer cells and converted the dying cancer cells to an in situ vaccine. It was noted that the treatment did not lead to significant increase of CD8/Treg ratios in the secondary tumors. This suggests that the efficiency of the treatment may be further improved when used in combination with an immune checkpoint inhibitor such as anti-CTLA-4 or anti-PD-1/PD-L1 antibodies. These possibilities will be pursued in future studies.
Figure 6. PSCNPs induce anti-cancer immunity in bilateral tumor models.
a, A schematic illustration showing the experimental design. Bilateral tumor-bearing C3H mice (n = 5) were i.t. injected with one dose of saline or PSCNPs (27 mg/mL, 50 μL) in the primary tumor 14 days after tumor inoculation. The tumors, spleen, tumor-draining lymph nodes (TDLNs) and blood were collected on Day 3, 7, and 12 for flow cytometry analysis. b, Tumor growth curves for the secondary tumors. c-g, Flow cytometry analysis of leucocyte profiles in blood and tissue samples on Day 3, 7 and 12, including c) CD8+ T cells, d) CD8+IFN-γ+ T cells, e) CD4+Foxp3+ T cells (Tregs), f) CD8+ T cells/Treg ratio, and g) CD80+CD86+ DCs and CCR7+CD80+CD86+ DCs in the primary tumors (* p < 0.05).
In summary, we have demonstrated a novel, nanoparticle approach to alter intracellular osmolarity of cancer cells and kill them. This mechanism may apply to other electrolayte-based nanoparticles, such as KCl and CaCl2. Unlike molecular ionophores that shuttle one ion at a time,[30] PSCNPs deliver millions of sodium and chloride ions into cells. This overwhelms cellular protection mechanism, inducing not only cell apoptosis but also highly immunogenic necrosis, as a result boosting an anticancer immunity. Previously, Menger et al. screened 1,040 distinct FDA-approved drugs, and found that cardiac glycosides are particularly efficient ICD inducers.[31] This is intriguing because cardiac glycosides work by inhibiting the cellular sodium-potassium ATPase pump and increasing [Na+]int,[32] and in that they resemble PSCNPs. This ICD property adds to the potential of PSCNPs as a novel cancer therapeutic. While inorganic nanoparticles have been extensively investigated as imaging probes,[33] delivery vehicles,[34] or radiation transducers,[35] few of them have made it to the clinic. The primary concerns are their toxicity, slow clearance, and unpredictable long-term impact to the hosts.[36] PSCNPs are unique because they are made of a benign material and their toxicity is entirely hinged on the nanoparticle form. Considering a relatively short half-live in aqueous solutions, PSCNPs in the current form are best suited for local ablation rather than systemic therapy. The treatment will cause immediate and immunogenic cancer cell death. After the treatment, the nanoparticles are reduced to salts, which are merged with body’s fluid system and cause no systematic or accumulative toxicity. Indeed, we observed no sign of systematic toxicity with i.t. injected PSCNPs at high doses (Figure S22). We expect this technology to find wide applications in treatment of cancer types such as bladder, prostate, head and neck, and liver cancer.
Supplementary Material
Acknowledgements
We would like to thank Julie Nelson in CTEGD Cytometry Shared Resource Laboratory at University of Georgia (UGA) for helping us plan the flow studies. We also want to thank Georgia Electron Microscopy for the TEM and SEM analysis. This work was supported by the National Science Foundation (CAREER grant no. NSF1552617 to J.X.), the National Institute of Biomedical Imaging and Bioengineering (grant no. R01EB022596 to J.X.), the National Heart, Lung, and Blood Institute (grant no. R01NS093314 to J.X.), the National Institute for Occupational Safety and Health (grant no. R21OH010473 to X.Y), the National Institute of Environmental Health Sciences (grant no. R43ES027374 to L.Y.), the Alternatives Research & Development Foundation (ARDF to X.Y), and the National Institute of Arthritis and Musculoskeletal and Skin Diseases (grant no. R01AR070178 to H.Y.). We also thank the National Key Research and Development Program of China (2018YFA0107301), the National Science Foundation of China (81771977), the Fundamental Research Funds for the Central Universities of China (20720180054), and Xiamen Science and Technology Plan Project (3502Z20183017).
Footnotes
Supporting Information
Supporting Information is available from the Wiley Online Library or from the author. It includes abbreviation list, materials and methods, Figures S1–S25, Tables S1, Movies S1–S4.
Conflict of interests
The authors declare no conflict of interest. The data that support the findings of this study are available from the corresponding author upon reasonable request.
Contributor Information
Wen Jiang, Department of Chemistry, University of Georgia, Athens, Georgia 30602, USA..
Lei Yin, Department of Environmental Health Science, University of Georgia, Athens, Georgia 30602, USA..
Hongmin Chen, Department of Chemistry, University of Georgia, Athens, Georgia 30602, USA.; State Key Laboratory of Molecular Vaccinology and Center for Molecular Imaging and Translational Medicine, School of Public Health, Xiamen University, Fujian 361102, China
Amy Victoria Paschall, Department of Biochemistry and Molecular Biology, University of Georgia, Athens, Georgia 30602, USA.
Liuyang Zhang, State Key Laboratory for Manufacturing Systems Engineering, Xi’an Jiaotong University, Xi’an, Shanxi 710049, China.
Wenyan Fu, Center for Molecular Medicine, Department of Biochemistry and Molecular Biology, University of Georgia, Athens, Georgia 30602, USA.
Weizhong Zhang, Department of Chemistry, University of Georgia, Athens, Georgia 30602, USA..
Trever Todd, Department of Chemistry, University of Georgia, Athens, Georgia 30602, USA..
Kevin Shengyang Yu, Department of Environmental Health Science, University of Georgia, Athens, Georgia 30602, USA..
Shiyi Zhou, Department of Chemistry, University of Georgia, Athens, Georgia 30602, USA..
Zipeng Zhen, Department of Chemistry, University of Georgia, Athens, Georgia 30602, USA..
Michael Bultler, Department of Chemistry, University of Georgia, Athens, Georgia 30602, USA..
Li Yao, Science Education, Howard Hughes Medical Institute, Chevy Chase, Maryland 20815, USA.
Feng Zhang, Department of Epidemiology and Biostatistics, University of Georgia, Athens, GA 30602, USA.
Ye Shen, Department of Epidemiology and Biostatistics, University of Georgia, Athens, GA 30602, USA.
Zibo Li, Department of Radiology, University of North Carolina at Chapel Hill, Chapel Hill, North Carolina 27599, USA.
Amelia Yin, Center for Molecular Medicine, Department of Biochemistry and Molecular Biology, University of Georgia, Athens, Georgia 30602, USA.
Hang Yin, Center for Molecular Medicine, Department of Biochemistry and Molecular Biology, University of Georgia, Athens, Georgia 30602, USA.
Xianqiao Wang, College of Engineering, University of Georgia, Athens, Georgia 30602, USA.
Fikri Avci, Department of Biochemistry and Molecular Biology, University of Georgia, Athens, Georgia 30602, USA.
Xiaozhong Yu, Department of Environmental Health Science, University of Georgia, Athens, Georgia 30602, USA..
Jin Xie, Department of Chemistry, University of Georgia, Athens, Georgia 30602, USA.; Bio-Imaging Research Center, University of Georgia, Athens, Georgia 30602, USA
References
- [1].Milo R, Phillips R, Cell biology by the numbers, Garland Science, 2015. [Google Scholar]
- [2].a) Okada Y, Cell Biochem. Biophys. 2004, 41, 233; [DOI] [PubMed] [Google Scholar]; b) Hoffmann EK, Pedersen SF, Acta Physiol. 2011, 202, 465. [DOI] [PubMed] [Google Scholar]
- [3].Galvez A, Morales MP, Eltit JM, Ocaranza P, Carrasco L, Campos X, Sapag-Hagar M, Diaz-Araya G, Lavandero S, Cell Tissue Res. 2001, 304, 279. [DOI] [PubMed] [Google Scholar]
- [4].a) Gadsby DC, Nat. Rev. Mol. Cell Biol. 2009, 10, 344; [DOI] [PMC free article] [PubMed] [Google Scholar]; b) Yu FH, Catterall WA, Genome Biol. 2003, 4, 207. [DOI] [PMC free article] [PubMed] [Google Scholar]
- [5].Oh N, Park JH, Int. J. Nanomedicine 2014, 9 Suppl 1, 51. [DOI] [PMC free article] [PubMed] [Google Scholar]
- [6].Pedersen SF, Kapus A, Hoffmann EK, J. Am. Soc. Nephrol. 2011, 22, 1587. [DOI] [PubMed] [Google Scholar]
- [7].Oh N, Park JH, Int. J. Nanomedicine 2014, 9, 51. [DOI] [PMC free article] [PubMed] [Google Scholar]
- [8].Kim S, Ma L, Unruh J, McKinney S, Yu CR, BMC Neurosci. 2015, 16, 90. [DOI] [PMC free article] [PubMed] [Google Scholar]
- [9].a) Benhar M, Engelberg D, Levitzki A, EMBO Rep. 2002, 3, 420; [DOI] [PMC free article] [PubMed] [Google Scholar]; b) Mates JM, Segura JA, Alonso FJ, Marquez J, Arch. Toxicol. 2012, 86, 1649. [DOI] [PubMed] [Google Scholar]
- [10].Plimpton S, J. Comput. Phys. 1995, 117, 1. [Google Scholar]
- [11].a) Labbe K, Saleh M, Inflammasomes 2011, 17; [Google Scholar]; bMiao EA, Rajan JV, Aderem A, Immunol. Rev. 2011, 243, 206. [DOI] [PMC free article] [PubMed] [Google Scholar]
- [12].Man SM, Karki R, Kanneganti TD, Immunol. Rev. 2017, 277, 61. [DOI] [PMC free article] [PubMed] [Google Scholar]
- [13].a) Liu X, Zhang ZB, Ruan JB, Pan YD, Magupalli VG, Wu H, Lieberman J, Nature 2016, 535, 153; [DOI] [PMC free article] [PubMed] [Google Scholar]; b) Shi JJ, Zhao Y, Wang K, Shi XY, Wang Y, Huang HW, Zhuang YH, Cai T, Wang FC, Shao F, Nature 2015, 526, 660. [DOI] [PubMed] [Google Scholar]
- [14].Weinberg JM, Bienholz A, Venkatachalam MA, Cell. Mol. Life Sci. 2016, 73, 2285. [DOI] [PMC free article] [PubMed] [Google Scholar]
- [15].Zhang F, Wang L, Wang JJ, Luo PF, Wang XT, Xia ZF, Sci. Rep. 2016, 6. [DOI] [PMC free article] [PubMed] [Google Scholar]
- [16].a) Bergsbaken T, Fink SL, Cookson BT, Nat. Rev. Microbiol. 2009, 7, 99; [DOI] [PMC free article] [PubMed] [Google Scholar]; b) Bortoluci KR, Medzhitov R, Cell. Mol. Life Sci. 2010, 67, 1643. [DOI] [PMC free article] [PubMed] [Google Scholar]
- [17].Szabo G, Csak T, Journal of Hepatology 2012, 57, 642. [DOI] [PubMed] [Google Scholar]
- [18].Mirshafiee V, Sun BB, Chang CH, Liao YP, Jiang W, Jiang JH, Liu XS, Wang X, Xia T, Nel AE, Acs Nano 2018, 12, 3836. [DOI] [PMC free article] [PubMed] [Google Scholar]
- [19].a) Munoz-Planillo R, Kuffa P, Martinez-Colon G, Smith BL, Rajendiran TM, Nunez G, Immunity 2013, 38, 1142; [DOI] [PMC free article] [PubMed] [Google Scholar]; b) Bergsbaken T, Fink SL, Cookson BT, Nat. Rev. Microbiol. 2009, 7, 99. [DOI] [PMC free article] [PubMed] [Google Scholar]
- [20].a) Jesenberger V, Procyk KJ, Yuan JY, Reipert S, Baccarini M, J. Exp. Med. 2000, 192, 1035; [DOI] [PMC free article] [PubMed] [Google Scholar]; b) Cervantes J, Nagata T, Uchijima M, Shibata K, Koide Y, Cell. Microbiol. 2008, 10, 41. [DOI] [PubMed] [Google Scholar]
- [21].Chaves NL, Estrela-Lopis I, Bottner J, Lopes CAP, Guido BC, de Sousa AR, Bao SN, Int. J. Nanomedicine 2017, 12, 5511. [DOI] [PMC free article] [PubMed] [Google Scholar]
- [22].a) Cone CD Jr., J Theor Biol 1971, 30, 151; [DOI] [PubMed] [Google Scholar]; b) Cone CD Jr., Ann N Y Acad Sci 1974, 238, 420; [DOI] [PubMed] [Google Scholar]; c) Cone CD Jr., , Cone CM, Science 1976, 192, 155. [DOI] [PubMed] [Google Scholar]
- [23].Cameron IL, Smith NK, Pool TB, Sparks RL, Cancer Res. 1980, 40, 1493. [PubMed] [Google Scholar]
- [24].Zsnagy I, Zsnagy V, Lustyik G, Zarandi B, Bertonifreddari C, Cell Biol J. 1981, 90, 769. [DOI] [PMC free article] [PubMed] [Google Scholar]
- [25].a) Inoue H, Tani K, Cell Death Differ. 2014, 21, 39; [DOI] [PMC free article] [PubMed] [Google Scholar]; b) Zhang Y, Chen X, Gueydan C, Han J, Cell Res. 2018, 28, 9. [DOI] [PMC free article] [PubMed] [Google Scholar]
- [26].Kroemer G, Galluzzi L, Kepp O, Zitvogel L, Annu. Rev. Immunol. 2013, 31, 51. [DOI] [PubMed] [Google Scholar]
- [27].a) Pawaria S, Binder RJ, Nat. Commun. 2011, 2; [DOI] [PMC free article] [PubMed] [Google Scholar]; b) Berwin B, Hart JP, Rice S, Gass C, Pizzo SV, Post SR, Nicchitta CV, EMBO J. 2003, 22, 6127; [DOI] [PMC free article] [PubMed] [Google Scholar]; c) Gardner A, Ruffell B, Trends Immunol. 2016, 37, 855. [DOI] [PMC free article] [PubMed] [Google Scholar]
- [28].Hu YL, Cheng SCS, Chan KT, Ke Y, Xue BF, Sin FWY, Zeng CJ, Xie Y, Biochem. Biophys. Res. Commun. 2010, 392, 329. [DOI] [PubMed] [Google Scholar]
- [29].McDonnell AM, Robinson BWS, Currie AJ, Clin. Dev. Immunol. 2010, 2010, 9. [DOI] [PMC free article] [PubMed] [Google Scholar]
- [30].Busschaert N, Park SH, Baek KH, Choi YP, Park J, Howe ENW, Hiscock JR, Karagiannidis LE, Marques I, Felix V, Namkung W, Sessler JL, Gale PA, Shin I, Nature Chemistry 2017, 9, 667. [DOI] [PMC free article] [PubMed] [Google Scholar]
- [31].Menger L, Vacchelli E, Adjemian S, Martins I, Ma YT, Shen SS, Yamazaki T, Sukkurwala AQ, Michaud M, Mignot G, Schlemmer F, Sulpice E, Locher C, Gidrol X, Ghiringhelli F, Modjtahedi N, Galluzzi L, Andre F, Zitvogel L, Kepp O, Kroemer G, Sci. Transl. Med. 2012, 4. [DOI] [PubMed] [Google Scholar]
- [32].Schoner W, Scheiner-Bobis G, Am. J. Physiol. Cell Physiol. 2007, 293, C509. [DOI] [PubMed] [Google Scholar]
- [33].Kim D, Kim J, Park YI, Lee N, Hyeon T, ACS Cent. Sci. 2018, 4, 324. [DOI] [PMC free article] [PubMed] [Google Scholar]
- [34].Tonga GY, Moyano DF, Kim CS, Rotello VM, Curr. Opin. Colloid Interface Sci. 2014, 19, 49. [DOI] [PMC free article] [PubMed] [Google Scholar]
- [35].Mi Y, Shao Z, Vang J, Kaidar-Person O, Wang AZ, Cancer Nanotechnol. 2016, 7, 11. [DOI] [PMC free article] [PubMed] [Google Scholar]
- [36].a) Chen HM, Zhang WZ, Zhu GZ, Xie J, Chen XY, Nat. Rev. Mater. 2017, 2; [DOI] [PMC free article] [PubMed] [Google Scholar]; b) Smolkova B, Dusinska M, Gabelova A, Food Chem. Toxicol. 2017, 109, 780; [DOI] [PubMed] [Google Scholar]; c) Matteis V. De, Toxics 2017, 5. [Google Scholar]
Associated Data
This section collects any data citations, data availability statements, or supplementary materials included in this article.


