Abstract
Systemic lupus erythematosus (SLE) is a chronic, remitting, and relapsing, inflammatory disease involving multiple organs, which exhibits abnormalities of both the innate and adaptive immune responses. A limited number of transcriptomic studies have characterized the gene pathways involved in SLE in an attempt to identify the key pathogenic drivers of the disease. In order to further advance our understanding of the pathogenesis of SLE, we used a novel Bayesian network algorithm to hybridize knowledge- and data-driven methods, and then applied the algorithm to build an SLE gene network using transcriptomic data from 1,760 SLE patients’ RNA from the two tabalumab Phase III trials (ILLUMINATE-I & -II), the largest SLE RNA dataset to date. Further, based on the gene network, we carried out hub- and key driver-gene analyses for gene prioritization. Our analyses identified that the JAK-STAT pathway genes, including JAK2, STAT1, and STAT2, played essential roles in SLE pathogenesis, and reaffirmed the recent discovery of pathogenic relevance of JAK-STAT signaling in SLE. Additionally, we showed that other genes, such as IRF1, IRF7, PDIA4, FAM72C, TNFSF10, DHX58, SIGLEC1, and PML, may be also important in SLE and serve as potential therapeutic targets for SLE. In summary, using a hybridized network construction approach, we systematically investigated gene-gene interactions based on their transcriptomic profiles, prioritized genes based on their importance in the network structure, and revealed new insights into SLE activity.
Introduction
SLE is a prototypic, systemic autoimmune disease characterized by inflammation of multiple organ systems and dysregulation of both innate and adaptive immunity. Genetic studies have identified more than 80 SLE-associated gene loci that contribute to disease susceptibility [1]. After decades of many unsuccessful trials, several new drugs have reported success in Phase II and III clinical trials of lupus. However, despite this success, the central drivers and key molecular targets that drive the activity of SLE remain unclear [2–5].
Using gene expression profiling, the cytokine class of type I interferon (IFN) responsive genes was shown to be elevated in SLE. These genes are collectively known as the IFN response gene signature and comprise a large group of IFN proteins that regulate the function of immune system. Subsequently, this led to clinical trials that focused on characterizing the IFN signature [6]. Approximately 50% to 75% of SLE patients enrolled in industry-sponsored Phase II and III SLE trials that characterized IFN responsive gene profiles were found to be type I IFN-signature positive (IFN-positive) [7–9]. The high prevalence of the IFN signature in SLE, particularly among clinical trial patients, supported the concept that identification of subgroups of patients with high IFN gene expression and targeting type I IFN could be an effective strategy for the treatment of SLE. However, Phase II and III studies targeting type I IFN demonstrated variable results [7, 10]. These results instigated research to identify new and more relevant targets for drug therapy.
Statistical methods have been developed to infer gene-gene interactions (GGI) and gene regulatory relationships using large amounts of transcriptomic data. Such inferred GGIs can be represented by a graph or network, in which nodes are genes and edges represent GGIs. Rather than providing a list of putative disease-relevant genes, a gene network approach provides a systematic view of the interplay between multiple genes and pathways, helps to understand how genes contribute to disease pathogenesis, and prioritizes key driver genes for drug development. There are three popular gene network construction methods [11]. The most popular method is correlation-based (also known as co-expression-based), which uses correlation to connect genes [12]. However, the drawback of this method is the inability to distinguish direct and indirect interactions. In practice, this method is often used as a clustering method to identify modules of genes with similar expression profiles. The second method is the Markov method, which is based on conditional dependence detection to describe a set of random variables with Markov properties. In theory, the Markov property ensures only direct connections remain in the network. The third method is the Bayesian method, which describes a set of random variables using their conditional dependence in an acyclic directed graph. The edges in a Bayesian network are directed, and under proper assumptions, can be viewed as causal relationships [13]. Despite the appealing theoretical properties, the Bayesian network method is challenging with limited sample sizes because the number of possible network topologies increases super-exponentially with the number of genes.
In this study, we developed a novel computational method to construct a Bayesian gene network to tackle the high-dimensionality issue and applied this method to SLE. Although type I INFs have been implicated in the pathogenesis of SLE, our Bayesian gene network revealed that some JAK-STAT pathway genes (e.g. JAK2, STAT1, and STAT2) may also be central to SLE. This is consistent with the recent discovery of the pathogenic and therapeutic relevance of JAK-STAT signaling in SLE [14, 15]. Our network construction and analysis in SLE demonstrated the value of these genes in the understanding of the disease and in the identification of new therapeutic targets.
Materials and methods
Gene expression data
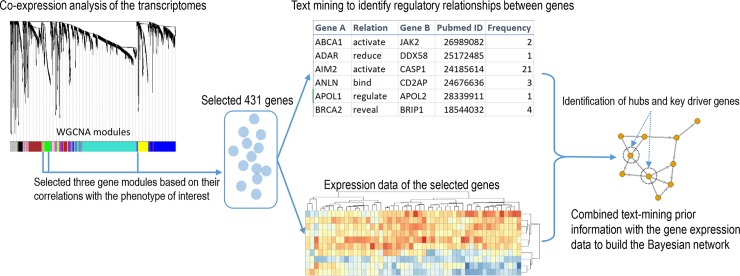
Gene expression data were obtained from 1,760 SLE patients in two Phase III, 52-week, randomized, placebo-controlled, double-blind studies (ILLUMINATE-1 and -2) [16, 17]. Blood samples were collected in Tempus tubes (Thermo Fisher Scientific) at baseline, Week 16, and Week 52. Transcriptomic results for each individual sample were analyzed using the Affymetrix Human Transcriptome Array 2.0 (HTA2). Other details of transcriptomic data collection, processing, and statistical analysis have been previously described [7]. The dataset is publicly available in the Gene Expression Omnibus repository (accession IDs: GSE88884 and GSE88887). For our analysis, only baseline transcriptomic data from 1,760 SLE patients were used for network construction. Additionally, the results of analyses to test differential expression (SLE vs. healthy controls) were used as additional input for key driver gene analysis. The overall analysis workflow for candidate gene selection, gene network construction, and analysis is illustrated in Fig 1.
Fig 1. Overall analysis workflow.
Candidate gene selection
A co-expression network using all SLE patient baseline samples was built and has been previously described [7]. Briefly, transcripts with a coefficient of variation less than 25% were considered as ‘uninformative’ and removed. Five samples were removed based on weighted gene co-expression network analysis (WGCNA) outlier detection [12]. The remaining transcripts were clustered into 14 co-expression modules using WGCNA [7, 12]. The IFN signature, the first principal component derived from 34 of the 164 pre-selected IFN response genes that were the highest covariates, was an independent predictor of time to severe flare events [7]. As we were interested to investigate the function of these genes in relation to both IFN signature and disease flare, we selected three gene modules (Tan, Yellow, and Green) from the co-expression network [7] as candidates for the following Bayesian gene network construction. The expression of these three gene modules significantly correlated with the IFN signature and was associated with time to disease flare (Table 1).
Table 1. Three selected WGCNA modules.
| Module | Gene (transcript cluster) number | Correlation with IFN signature (P-value) |
Association with time to flare* | Top 5 enriched gene ontology terms | False discovery rate of the enrichment test |
|---|---|---|---|---|---|
| Yellow | 229 (264) |
0.90 (0.00E+00) |
1.00E-05 | cellular response to type I interferon | 1.16E-32 |
| response to type I interferon | 1.16E-32 | ||||
| type I interferon signaling pathway | 1.13E-31 | ||||
| defense response to virus | 8.43E-26 | ||||
| defense response | 1.40E-24 | ||||
| Tan | 64 (64) |
0.42 (3.00E-48) |
0.00E+00 | nuclear division | 4.23E-23 |
| organelle fission | 4.43E-23 | ||||
| cell cycle | 6.20E-23 | ||||
| mitotic cell cycle | 2.79E-22 | ||||
| mitotic nuclear division | 7.84E-22 | ||||
| Green | 138 (138) |
0.34 (3.00E-48) |
0.00E+00 | humoral immune response | 1.48E-06 |
| complement activation, classical pathway | 1.58E-06 | ||||
| humoral immune response mediated by circulating immunoglobulin | 2.28E-06 | ||||
| immune response-regulating cell surface receptor signaling pathway involved in phagocytosis | 2.28E-06 | ||||
| Fc-gamma receptor signaling pathway involved in phagocytosis | 2.28E-06 |
* The association was measured by Cox proportional hazards model λ(t|xi) = λ0(t) exp(xi⋅β), and P-values from the models were shown in the table.
Prior information
Prior information of GGIs can be obtained using multiple methods (e.g. text-mining, existing pathway databases, protein-protein interactions, and genetic interactions). Here we used text-mining to retrieve gene regulation information from the literature using I2E [18]. There is a vast corpus of molecular biology literature available in MEDLINE (PubMed), and I2E utilizes advanced natural language processing techniques, such as information extraction, to process abstracts from MEDLINE and produce a structured representation of the knowledge of interest. Specifically, we used the gene ontologies in I2E to find all relevant synonyms for a gene and used a comprehensive biological relationship query to find all available gene-gene relationships. This I2E search strategy provided a rigorous and extensive analysis of MEDLINE to identify high-quality gene-regulation relationships. The species, disease, tissue, and cell type were not restricted in the search query. The GGIs retrieved from I2E can be represented as a prior network, in which nodes are genes and directed edges represent their potential regulatory relationships. Multiple documents may describe the same GGI, and we used the number of documents to score the strength of GGIs. Therefore, the number of documents describing the same GGI was assigned as edge weight in the prior network, representing the confidence of the prior information.
Bayesian network construction algorithm
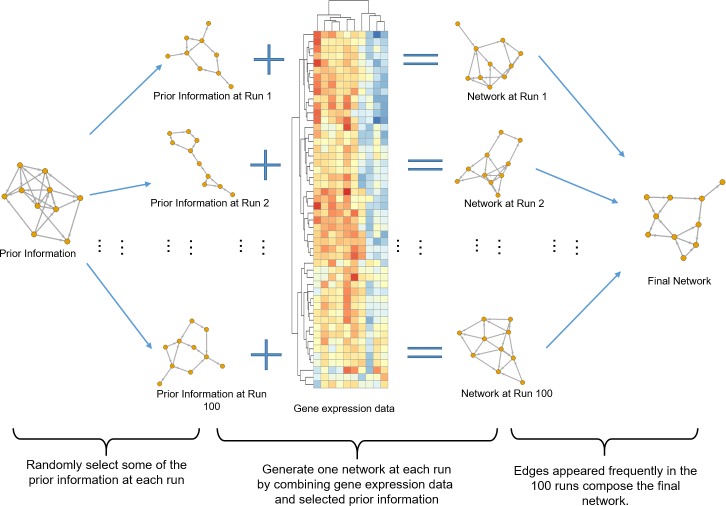
With a limited sample size, structure learning in a Bayesian network is a challenging high-dimension problem. Motivated by Zhang et al’s work [19], we proposed a flexible approach to utilize known information as prior information, and integrate it with transcriptome data to generate the potential causal network. Here, the prior information was derived from text-mining results and it was integrated with the transcriptomic data of baseline patients from the ILLUMINATE-1 and -2 trials. The algorithm is illustrated in Fig 2 and described as follows.
Fig 2. Algorithm workflow.
Prior edges (i.e. GGIs from text-mining) were randomly sampled based on the text-mining results. The selection probability of each edge in the prior network was based on exponential distribution, 0.85(1−e−x) where x was the edge weight (i.e. the number of documents that supported the GGI). Because the prior network contained a few loops and bi-directional edges, once a set of edges was selected, this ‘mini prior network’ was further pruned to generate a directed acyclic graph, in which the feedback arc set (i.e. the bi-directional or loop-forming edges) was removed. The minimum feedback arc set, which had minimal total weight among all possible feedback arc sets, was removed using the integer programming algorithm implemented by the igraph package [20].
A network was built based on the gene expression data using R package bnlearn [21], but keeping the selected prior edges in Step 1 in the network structure. The learned structure would include two types of edges: edges selected in Step 1 and edges derived using the gene expression data. A score-based approach was used to learn the Bayesian network structure, which assigned each candidate structure a score that measured how well the structure describes the data and then found the structure that maximizes the score, formally expressed as maxG,θ L(〈G,θ〉;D), i.e. to find a graph structure G with parameter θ that maximizes the likelihood given the data set D [22]. Here, we used the hill-climbing algorithm. It was a score-based heuristic search algorithm to iteratively perform a single-edge change for attempting to find a higher score at each step.
The two steps shown above were repeated 100 times.
Once the 100 runs were finished, edges from all runs were aggregated and counted. The frequency range for all the edges was integers from 1 to 100 and defined as ‘aggregated weight’. The edges with high frequency were considered stable and reliable interactions and vice versa. Subsequently, a reliability cutoff would be needed to filter out low weight edges to generate the final network. Many real-world networks (e.g. social network, the worldwide web, airline network, protein-protein interaction network) are scale-free [23], which means the node degrees follow a power-law distribution. Therefore, we used the scale-free topology criterion [12] to select the reliability cutoff. At each cutoff, the degrees of nodes were fitted to a power-law distribution using a linear model after log transformation. R2 from the fitted linear model was considered as a measure of scale-free topology. Usually, the R2 increases when the cutoff increases. The cutoff was chosen once the R2 first achieved above 0.8.
Simulation
Simulations were carried out to test the influence of prior information on the accuracy and variability of network construction. We considered a 46-gene network (http://www.bnlearn.com/bnrepository/gaussian-medium.html) as the ‘true’ network structure, and generated gene expression data with 300 samples using the forward sampling method in bnlearn [21]. We also simulated multiple sets of prior information with different precisions (e.g. 0.8, 0.6, 0.4, and 0.2). For example, 0.8 precision meant the 80% prior edges were correct and 20% prior edges were wrong. The prior edge number was equal to 70, i.e. the edge number in the “true” network. We also tested the null prior (precision = 0), which meant the final network was totally data-driven. We repeated the algorithm 20 times for each precision value. At each time, the prior information was randomly generated based on the precision value.
Key driver genes
Key driver genes, or master regulator genes are defined as those which have a significant effect on the expression of neighbor genes. Depending on which neighbors were included, we defined two types of key driver genes. First, key driver genes are genes whose ‘direct children’ tend to be differentially-expressed for SLE versus healthy controls. Second, key driver genes can be those whose ‘Markov blanket genes’ tend to be differentially-expressed genes. In a Bayesian network, the Markov blanket of a node includes its parents, children, and the other parents of its children. Mathematically, the rest of the network is conditionally independent of that node given the Markov blanket. Key driver genes were those genes which have not only relatively more neighbors, but also most of those neighbors are differentially-expressed in SLE versus healthy controls. We assumed key driver genes should have relatively more neighbor genes such that only the top 20 genes based on the number of neighbors, either children or Markov blanket, were selected for the key driver gene analyses. Then genes were ranked based on the average Z-scores of their neighbors; Z-scores were derived using the P-values from differential gene expression analysis.
Results
Simulation demonstrated the high stability and accuracy of the algorithm
Our algorithm utilized a model-averaging strategy and integrated the prior information in order to handle the high-dimensionality issue and to achieve high stability and accuracy. Due to high-dimensionality, the hill-climbing method is very sensitive to the start point and easily falls into local minima. Based on our algorithm, the final network results from aggregating and filtering of 100 individual networks. Only the common edges from the 100 individual networks are kept. This model-averaging method is a common practice to reduce the model variance [24]. Accurate prior information is able to restrict the search space or guide the search path to be close to the global minimum. Accurate prior information can increase both the accuracy and the stability of a model, and we used simulation to test the hypothesis. Twenty final networks were generated based on the simulated gene expression data and prior information at each prior precision setting, as described above.
If a model has low variance (i.e. high stability), the individual networks from 100 runs would be relatively similar. The similarity between two networks can be measured by Hamming distance, i.e. the number of addition/deletion operations required to turn the edge set of one network into that the other network. Therefore, we calculated the Hamming distances between pairs of the 100 individual networks in the 100 runs. The mean of the Hamming distances can be used to assess the stability and a lower value indicates higher stability, which means the 100 individual networks are generally more similar to each other. The stabilities of the networks without prior information were significantly lower than those with prior information, and more importantly, increasing the accuracy of prior led to higher network stability (Fig 3A). In addition, we used the Hamming distance between the true network and the generated network to assess the accuracy of the algorithm. A shorter distance meant more similarity between the two networks. As shown in Fig 3B, the accuracy of the generated network was significantly improved with more accurate prior information.
Fig 3. Stability and accuracy assessment using the simulation.
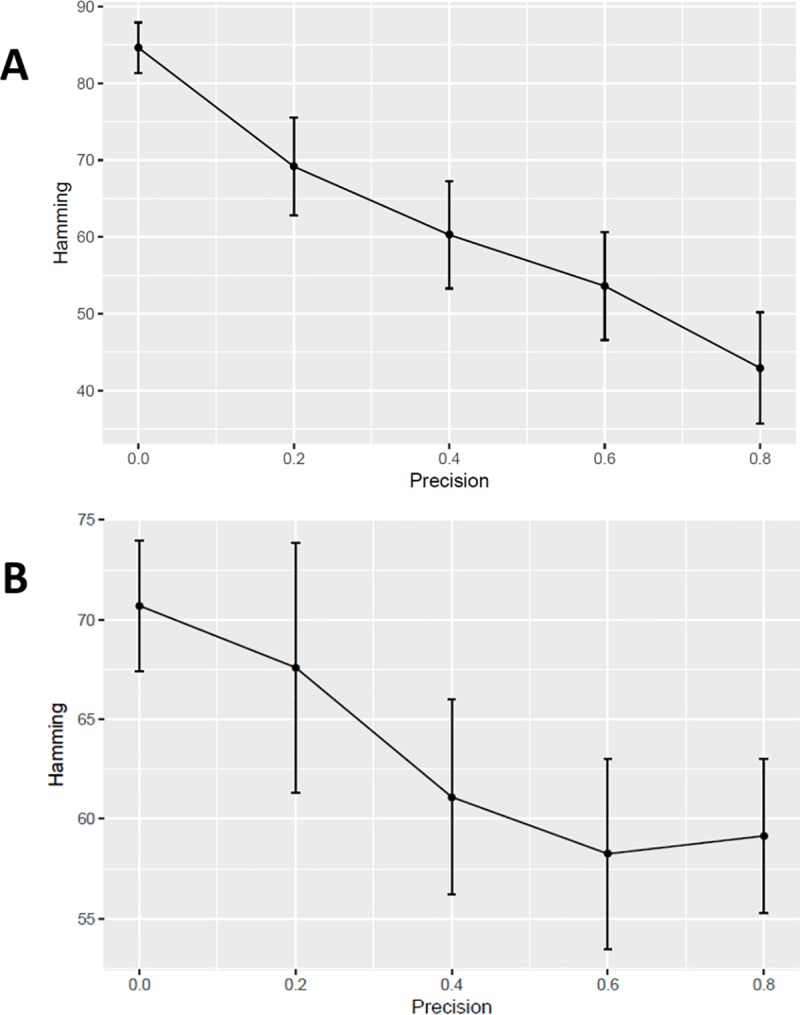
The stability (A) is measured by the mean of Hamming distances between pairs of 100 individual networks in 100 runs for each final network. The accuracy (B) is measured by the Hamming distance between the synthetic true network and a predicted network. The simulation was repeated 20 times for each precision setting. Precision represents the accuracy of the prior information, except precision 0, which means no prior information. The error bar is +/-1 standard deviation.
Three WGCNA modules had significantly high correlations with IFN signature
We focused on the set of genes whose expression significantly associated with IFN signature and time to flare. Three WGCNA modules from the previous analysis, Yellow, Tan, and Green, met the criteria [7]. Based on a gene ontology enrichment test, these modules could be annotated as type I interferon module, cell cycle module, or humoral immune response module, respectively (Table 1). The IFN signature was calculated using the expression profiles of the 34 IFN response genes. The Yellow module had all the 34 genes and expectedly had the highest correlation with the IFN signature. 108 out of the 164 pre-defined IFN response genes were found the in Yellow module, while none were found in the Tan and Green modules. This suggested that factors other than the IFN signature contribute to the SLE disease activity. We were interested to identify the regulatory pathways among genes in the Yellow module and their crosstalk with genes in the Tan and Green modules. Therefore, we selected all the 466 transcript clusters and 431 corresponding genes in the three modules for the following Bayesian network analyses (S1 Table).
Prior information
17 histone cluster and 112 immunoglobulin genes were removed to reduce complexity. Removing these was not felt to impact the analysis due to the fact that their presence was interpreted to reflect the expression of house-keeping genes and high levels of autoantibody activity [7]. The remaining 302 genes were used to query the text-mining tool, I2E. We retrieved a total of 1,904 hits (S2 Table). Among the 1,904 hits, there were 595 distinct gene pair relationships. One unique gene pair relationship meant that gene A has an effect on gene B. The number of hits was recorded as the weight for that gene pair relationship. A prior network with 167 nodes and 595 edges excluding singletons was constructed using the text-mining result, in which nodes were genes and edges were unique gene pair relationships with assigned weights (Fig 4 and S3 Table).
Fig 4. The prior network.
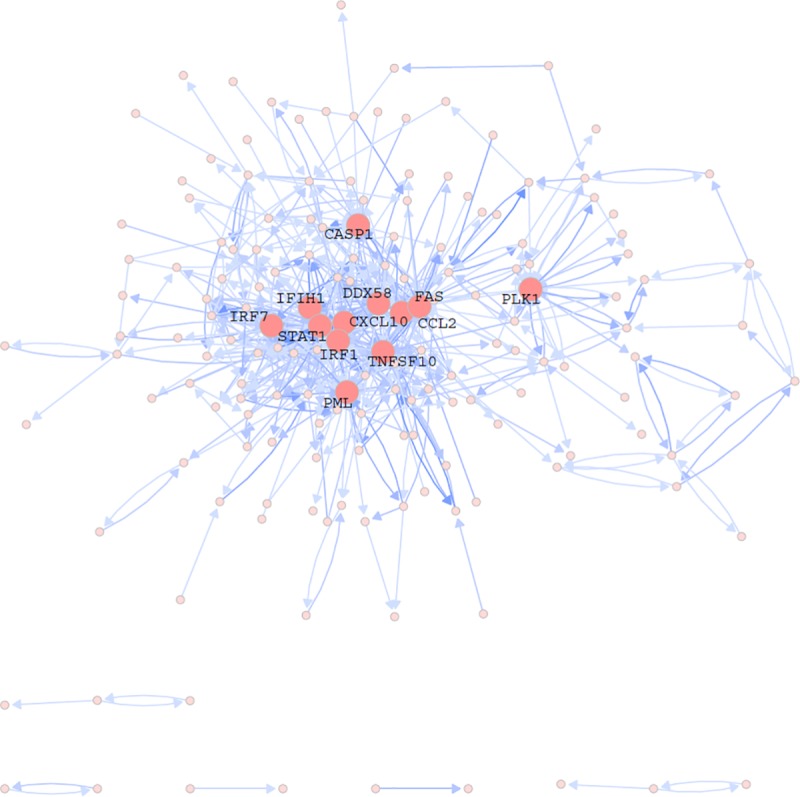
The node represents the gene, the edge is the regulatory relationship between two genes, and the color darkness of the edge corresponds to the edge weight, i.e. the number of documents showing the regulatory relationship. The top 12 hub genes are highlighted.
The Bayesian gene network
The reliability cutoff was set to 90, as an edge should appear at least 90 times out of the 100 random runs. Usually, the network becomes sparser and more like a scale-free network when the reliability cutoff increases (Fig 5A). We selected the cutoff, 90, at which the network first achieved above a 0.8 scale-free criterion when increasing the reliability cutoff from 50 to 100 (Fig 5). The final network had 277 nodes and 598 edges, excluding singletons (Fig 6 and S4 Table).
Fig 5. Reliability cutoff selection and the degree distribution of the final network.
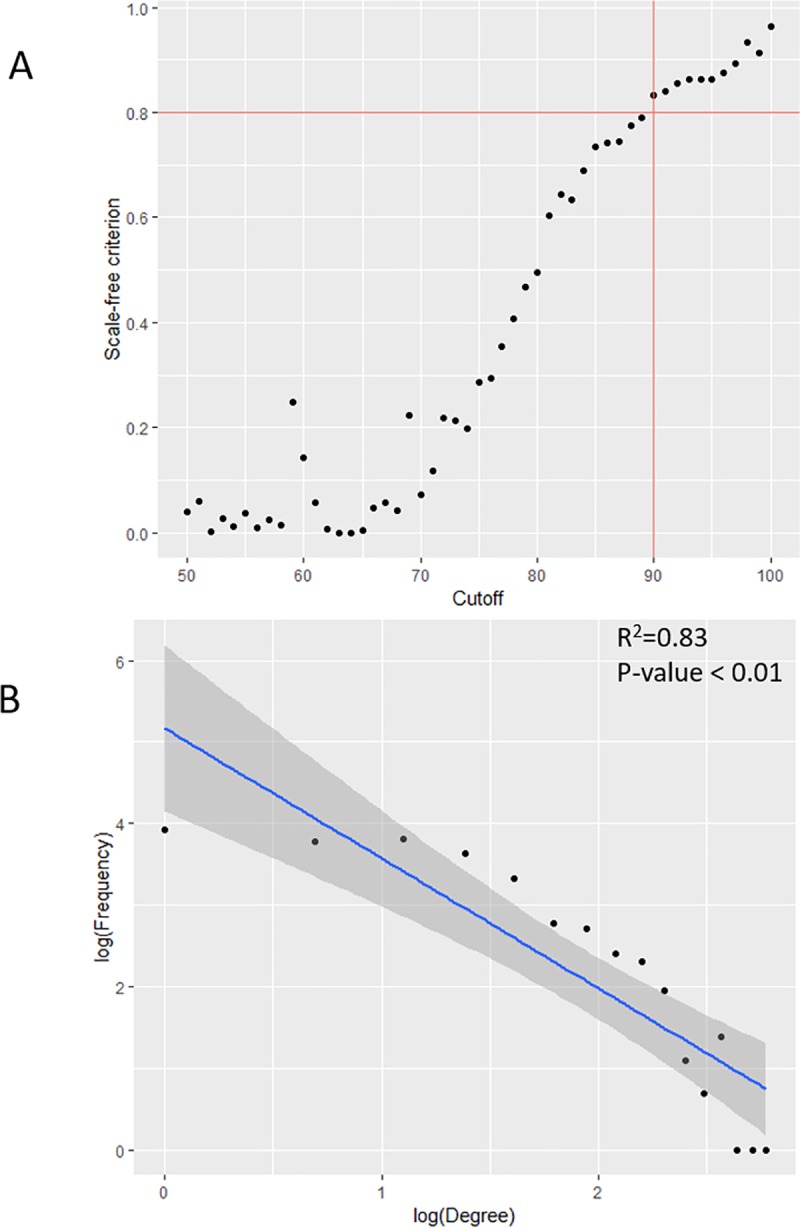
(A) The reliability cutoff selection was based on a scale-free criterion and the cutoff was set to 90, where the scale-free criterion first achieved above 0.8 when increasing the cutoff from 50 to 100. (B) For the degree distribution of the final network, the distribution was log-transformed to show it generally fitted the power-law distribution.
Fig 6. The final network.
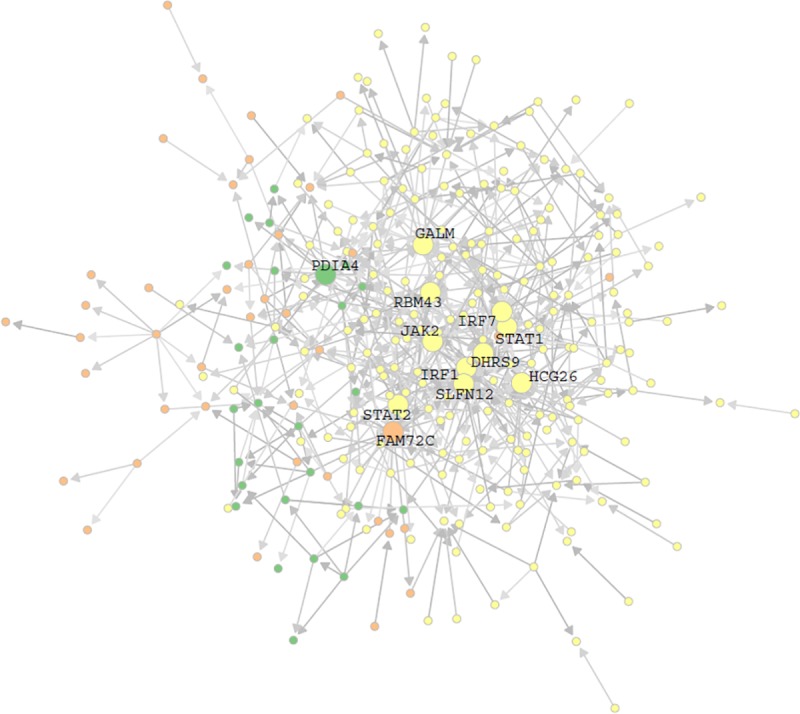
The node represents gene and the edge is the regulatory relationship between two genes. The color of a node represents one of the WGCNA modules, Yellow, Green or Tan, and the color darkness of the edge corresponds to the edge weight, i.e. the edge frequency in the 100 runs. The top 12 hub genes are highlighted.
During the network construction process, the probability that one prior edge was selected was based on the exponential distribution (1–e−x) multiplied by a ceiling parameter 0.85, where x was the edge weight (i.e. counts of documents supporting the GGI). A higher weight meant a higher probability of being selected at each run, and thus remaining in the final network. The selection probability ranged from 0.537 to close to 0.85 for each edge at each run (Table 2). These selection probabilities seemed high, but we used 90 as the reliability cutoff, such that any edge in the final network would need to be present in at least 90 out of 100 runs. Thus, most of the prior edges were highly unlikely to remain in the final network if they were random noise (Table 2). This was supported by the 50 prior edges that remained in the final network, which was much higher than expected based on binomial distribution (11.31 edges). At most weight levels, the numbers of prior edges remaining in the final network were significantly higher than expected (Table 2). This indicated that many of these prior edges were supported by both existing knowledge and gene expression data. Nevertheless, both the ceiling parameter 0.85 and the scale-free criterion of 0.8 were empirical settings. Further simulations and studies will be necessary to find a more systematic way to set the parameters.
Table 2. The impact of prior weight.
| Prior weight | Number of prior edges | Selection probability per edge in one run+ | Probability of one prior edge remaining in final network by chance++ | Expected number of prior edges remaining in final network by chance | Number of prior edges remaining in final network | P-value |
|---|---|---|---|---|---|---|
| 1 | 269 | 0.537 | 4.67E-15 | 1.26E-12 | 14 | 9.98E-178* |
| 2 | 122 | 0.735 | 3.85E-05 | 4.69E-03 | 4 | 1.92E-11* |
| 3 | 67 | 0.808 | 9.39E-03 | 6.29E-01 | 6 | 4.19E-05* |
| 4 | 42 | 0.834 | 4.53E-02 | 1.90 | 10 | 1.41E-05* |
| 5 | 20 | 0.844 | 7.53E-02 | 1.50 | 4 | 5.90E-02 |
| 6 | 16 | 0.848 | 8.99E-02 | 1.43 | 4 | 4.94E-02* |
| 7 | 6 | 0.849 | 9.59E-02 | 5.75E-01 | 0 | 1 |
| > = 8 | 53 | ≈0.850 | ≈9.81E-02 | ≈5.20 | 8 | ≈1.44E-01 |
+ Selection probability per edge in one run = 0.85(1-e—prior weight).
++ Assuming the reliability cutoff is 90, which means one prior network should be appear at least 90 times out of 100 runs. The probability is calculated based on binomial distribution.
* Statistical significance (P-value <0.05).
As demonstrated by our simulations, the network without prior information had low stability and accuracy. Previously, we used the mean of Hamming distances between pairs of the 100 individual networks in the 100 runs to assess the stability of the networks. The value from the networks without prior information was 6962.83 ± 169.59, higher than that with prior information (6462.59 ± 176.02). It had 364 edges, which was also lower than that with prior information (598). The higher mean Hamming distance and fewer edges indicated the individual networks from 100 runs were quite different from each other if no prior information was provided, i.e. the model without prior information had low stability. Another way of assessing stability was to rerun the whole algorithm with the same setting and compare the two results (Fig 7). With prior information, the two networks had 598 and 536 edges, respectively, and had 467 overlapped edges (78.1% and 87.1% of edges overlap with each other, respectively). Without prior information, only 65.7% and 66.0% of edges overlapped with each other, respectively. The node degree distributions from two networks with prior information were more similar than those from two networks without prior information (Fig 7).
Fig 7. The relationship of node degrees for two networks.
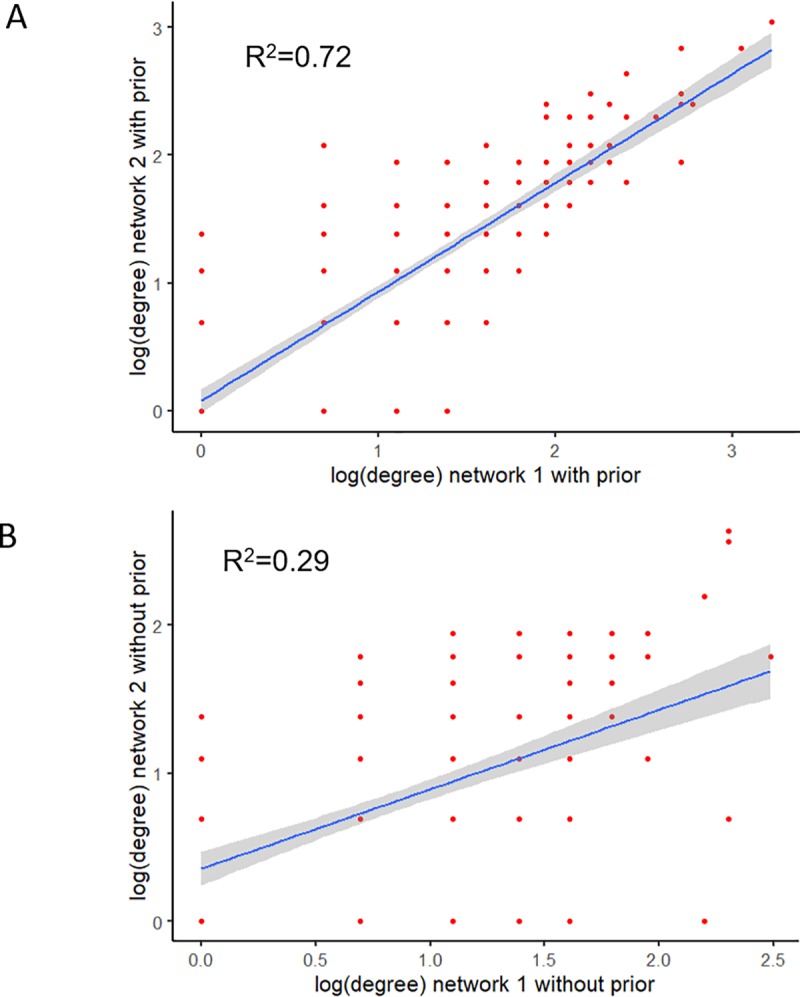
(A) with prior information and (B) without prior information.
Hub genes
The hub gene is an important concept in network analysis. It is defined as a gene that is over-connected compared with an ‘average’ gene. Such genes are important because knockdown of these genes will potentially perturb more genes or pathways. Thus, understanding of their functions could improve our understanding of the disease mechanism.
We compared the hub genes from the prior network and the final network in the setting of SLE pathogenesis. Given that the prior network was generated based only on current knowledge about GGIs, the hub genes in the network were biased towards genes that were of research interest. Although these genes were immune function-focused due to the selection criteria, they may not be SLE specific. Table 3 shows the lists of top hub genes from the prior network and the final network. As a comparison, STAT1, IRF1, and IRF7 were overlapping genes, suggesting the importance of these well-studied genes in SLE; all three genes were critical in the type I interferon and JAK-STAT pathways [25]. In contrast to the prior network, the final network identified more JAK-STAT pathway genes (JAK2 and STAT2).
Table 3. Top hub genes in prior and final networks.
| Prior network* | Final network | ||||||
|---|---|---|---|---|---|---|---|
| Gene | No. of direct neighbors | No. of children** | No. of parents** | Gene | No. of direct neighbors | No. of children | No. of parents |
| STAT1** | 59 | 34 | 25 | IRF1 | 25 | 25 | 0 |
| IRF1 | 53 | 30 | 23 | FAM72C | 21 | 0 | 21 |
| DDX58 | 40 | 17 | 23 | PDIA4 | 16 | 15 | 1 |
| FAS | 38 | 11 | 27 | JAK2 | 15 | 15 | 0 |
| PML | 32 | 21 | 11 | SLFN12 | 15 | 1 | 14 |
| CXCL10 | 31 | 11 | 20 | GALM | 15 | 1 | 14 |
| TNFSF10 | 30 | 17 | 13 | DHRS9 | 15 | 0 | 15 |
| CCL2 | 28 | 8 | 20 | STAT1 | 13 | 13 | 0 |
| IRF7 | 28 | 15 | 13 | HCG26 | 13 | 0 | 13 |
| CASP1 | 25 | 10 | 15 | STAT2 | 11 | 10 | 1 |
| PLK1 | 24 | 13 | 11 | IRF7 | 11 | 4 | 7 |
| IFIH1 | 22 | 10 | 12 | RBM43 | 11 | 0 | 11 |
Genes are sorted based on the number of direct neighbors
* Prior information includes bi-directed edges.
** The common genes in both lists are in bold.
Subsequently, we examined the GGIs among these JAK-STAT pathway genes and IFN regulatory genes, STAT1, STAT2, JAK2, IRF1 and IRF7, and their first-degree neighbors (Fig 8). Some of our findings were consistent with the literature. For example, IRF1 and STAT1 can upregulate IRF7 gene expression [26, 27]. FAS is downstream of many JAK-STAT pathway genes, indicating its crucial role in regulating cell death in SLE [28, 29]. Some known interactions were not found in the final network, e.g. the interactions between STAT1, STAT2, and IRF1 [30], reflecting some limitations of the method and data. Nevertheless, the network successfully detected the central roles of JAK-STAT pathway in SLE, and many interactions may be novel and worth further validation.
Fig 8. The subnetwork of IFR1, IFR7, STAT1, STAT2, JAK2 and their neighbors.
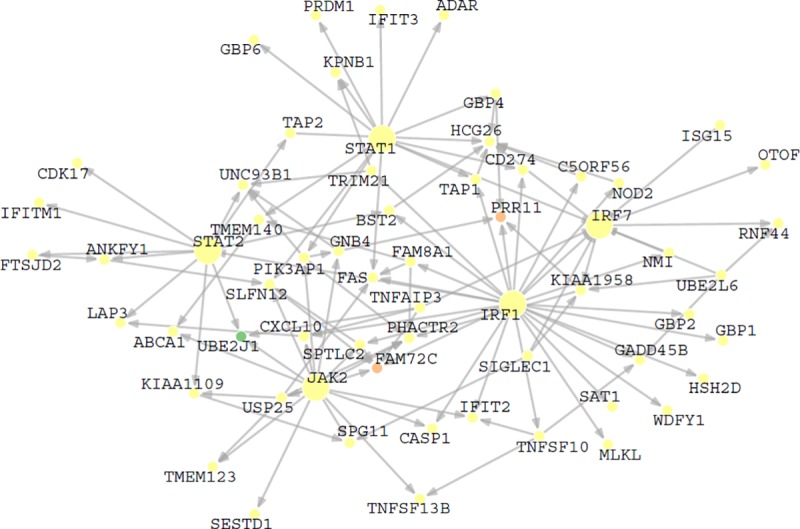
The color of a node represents one of the WGCNA modules, Yellow, Green or Tan.
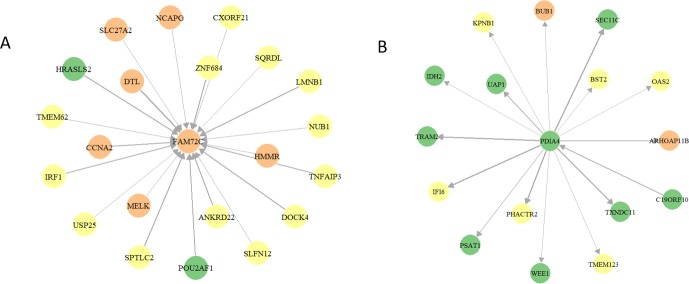
Other identified hub genes in the final network could also play important roles in SLE. Some of them are still novel and further experiments may be needed to elucidate their roles in SLE. For example, DHRS9 encodes a protein known as dehydrogenase/reductase (SDR family) member 9. In a recent study, evidence showed that the expression of DHRS9 changed significantly with the addition of SLE immune complexes in peripheral blood mononuclear cells, indicating the potential regulatory role of this gene in SLE [31]. Notably, ten out of the top 12 hub genes were from the Yellow module, and the other two hubs genes are FAM72C and PDIA4, from the Tan and Green modules, respectively. FAM72C encodes a neuronal progenitor cell self-renewal supporting protein and is involved with cellular proliferation in cancerous cells [32], but its function in blood and SLE is unknown. The Tan module was enriched by many cell cycle related genes. In addition, many genes from the three modules ‘regulated’ FAM72C (Fig 9A). Therefore, we hypothesized that FAM72C may play a role when the INF and JAT-STAT pathways trigger the abnormal cell cycle of some peripheral cells, e.g. the abnormal activation of B cells in SLE [33]. In contrast, many genes, including some INF pathway genes, e.g. OAS2, BST2, IFI6, were ‘regulated by’ PDIA4, an endoplasmic reticulum-stress pathway gene (Fig 9B). Some studies found that endoplasmic reticulum-stress regulates some INF pathway genes [34, 35]. The interactions between PDIA4 and INF pathway genes require further investigation.
Fig 9.
The first-degree neighbors of (A) FAM72C and (B) PDIA4 genes. The color of a node represents one of the WGCNA modules, Yellow, Green or Tan, and the width of an edge corresponds to the edge weight, i.e. the edge frequency in the 100 runs.
Key driver genes
We identified multiple key driver genes by integrating the network structure and differential expression analysis (Table 4). Differential expression analysis usually focuses on genes with relatively large fold changes to overcome the false positive issues. However, this approach could overlook some essential genes with small fold changes, especially when such genes are often located on the upstream side of a pathway, and activation of such genes could lead to downstream gene changes in the pathway (e.g. signal transduction). Upon binding of a chemical or physical signal to the receptor, a series of events will occur (e.g. protein phosphorylation), leading to a cell response [36]. In our analyses, we tried to fill in such gaps. If a large proportion of the neighbors of the target gene were significant differentially-expressed genes, such genes should be carefully studied even if the genes themselves were not significant differentially-expressed genes.
Table 4. Key diver genes.
| Gene | Number of children | Average Z-score of children | Gene | Number of Markov blanket genes | Average Z-score of the Markov blanket |
|---|---|---|---|---|---|
| DHX58* | 9 | 7.45 | TNFSF10 | 42 | 6.52 |
| USP18 | 7 | 7.11 | DHX58 | 43 | 6.34 |
| TNFSF10 | 8 | 6.92 | SIGLEC1 | 55 | 6.33 |
| UBE2L6 | 7 | 6.20 | JAK2 | 59 | 5.90 |
| IRF1 | 25 | 5.86 | PNPT1 | 53 | 5.71 |
| STAT1 | 13 | 5.62 | PML | 38 | 5.65 |
| STAT2 | 10 | 5.61 | IRF1 | 72 | 5.50 |
| JAK2 | 15 | 5.36 | STAT1 | 39 | 5.44 |
| SIGLEC1 | 10 | 5.35 | TNFAIP3 | 49 | 5.43 |
| PML | 8 | 5.30 | IFI35 | 38 | 5.24 |
* The common genes in both lists are in bold.
We used two separate methods to define the neighbors that a key driver gene could affect. One was restricted to the ‘children’ and the other one was restricted to the ‘Markov blanket’. Usually, the Markov blanket could be viewed as the ‘maximum boundary’ of one gene effect. Therefore, the Markov blanket neighbor definition was relatively more liberal than the children definition. Table 4 lists the top 10 key driver genes for each definition.
Many of the key driver genes shared in both definitions, e.g. TNFSF10, DHX58, SIGLEC1, JAK2, IRF1, and PML. As discussed previously, JAK2 and IRF1 were critical for the IFN and JAK-STAT pathways. TNFSF10 (TRAIL) encodes a tumor necrosis factor (ligand) superfamily member and is transcriptionally regulated by IRF1 [37]. Similarly, cytosolic nucleic acid sensors, including DHX58 which is regulated by IRF1 [38], could stimulate type I IFN production and may serve as potential therapeutic targets for SLE [39, 40]. SIGLEC1 was discovered as a biomarker of disease activity in SLE and could serve as a negative regulator of type I IFN production [41, 42]. It is known that PML transcription can be introduced by IFN, but it is unclear how PML mediates downstream signaling in SLE. [43, 44] In summary, the key driver-gene analysis suggested that JAK-STAT and IFN pathways played important roles in SLE. Furthermore, key driver-gene analysis is supplemental to hub gene analysis for gene prioritization. For example, PDIA4 and JAK2 have the same number of children (15), but the mean Z-score of the children of JAK2 (5.36) is much higher than that of PDIA4 (3.62). This indicates JAK2 may have a higher functional impact than PDIA4.
Discussion
In summary, we developed a novel way to build a Bayesian network based on transcriptomic data and literature mining for prior information. As an example, the method was implemented using transcriptomic data of pre-selected gene modules from SLE patients. Both hub gene and key driver-gene analyses suggested that the broad immunomodulatory effects mediated by the JAK-STAT pathway were critical for SLE. As a validation of our analysis, baricitinib, a JAK1/JAK2 inhibitor, showed success in a double-blind, randomized, placebo-control Phase 2 trial [4].
Despite interesting and novel findings, our methods have limitations. First, during the final network derivation, prior information was important. There are only limited ways that we could obtain gene-gene regulatory relations. We used text-mining because we believe it is the most comprehensive way to collect cumulatively all gene-gene regulatory relationships from potential all experiments conducted and assign confidence scores to control how that information can be used during the Bayesian network construction. Alternatively, curated databases with regulatory relationships, e.g. MetaBase (https://portal.genego.com/), RegNetwork [45], and TRRUST [46], can also be used as prior information. However, these databases are often biased due to the higher criteria for a regulatory relationship to enter the database, and the availability, accuracy, and update frequency highly depend on the research group maintaining the database. As a sensitivity analysis, we tested MetaBase as prior information. Interestingly, IFR1, STAT1, and STAT2 are among the top four hub genes. Although JAK2 was not identified as one of the top hub genes, the results indicated the essence of JAK-STAT pathway for SLE, consistent with that from using I2E text-mining as prior. Additionally, new GGI results could be incorporated into prior information, and a new network derived reiteratively. This would help to incorporate all different layers of data dynamically and could be viewed as a multivariate version of ‘meta-analysis’. Second, although evidence has suggested that blood was a reasonable tissue to profile the disease, a debate may arise whether whole blood is the best tissue to characterize SLE [47]. Additionally, as blood is a mixture of different cell types, there is a lack of single-cell transcriptome profiling. Therefore, our network may not reflect GGI for a particular cell type, but an average of the mixed cell types. Third, due to the computational limitations, only a subset of genes was included and GGIs of some relevant genes (e.g. JAK1) could not be inferred. Last but not least, a Bayesian network could not accommodate feedbacks or loops, which are critical components for biological mechanisms. Despite these limitations, our network can still provide valuable information for scientists to understand SLE. Additionally, the methods of constructing a Bayesian network and identifying key driver genes could be easily applicable to other diseases with a suitable dataset.
Supporting information
The table lists the modules (Module), transcript clusters (TC), gene symbol (geneSymbol) and gene name (geneName).
(XLSX)
Each row corresponds one regulatory relationship (“Gene A”, “Relation”, “Gene B”), PubMed ID, and the original text describing the relationship (Hit).
(XLSX)
(XLSX)
Color represents the WGCNA module name and weight is the edge frequency in 100 runs.
(XLSX)
Acknowledgments
This manuscript contains data from studies listed on the US Government Clinical Trial Registry at http://clinicaltrials.gov/ as NCT01205438 and NCT01196091. The authors are indebted to the patients who participated in this study, and their families, as well as all the physicians, nurses, and study coordinators who cared for the patients. The authors thank Dr. Eric Wen Su for his help and suggestion on text-mining, and Mark Stead and Dr. Bochao Jia for reading the paper and providing constructive suggestions.
Data Availability
Unprocessed files containing raw data and the corresponding metadata that are not provided in the supplementary material have previously been deposited in the GEO database repository (GEO accession no. GSE88884 and GSE88887) (online at http://www.ncbi.nlm.nih.gov/geo/).
Funding Statement
This work was funded by Eli Lilly and Company.
References
- 1.Chen L, Morris DL, Vyse TJ. Genetic advances in systemic lupus erythematosus: an update. Curr Opin Rheumatol. 2017;29(5):423–33. 10.1097/BOR.0000000000000411 . [DOI] [PubMed] [Google Scholar]
- 2.Furie R, Khamashta M, Merrill JT, Werth VP, Kalunian K, Brohawn P, et al. Anifrolumab, an Anti-Interferon-alpha Receptor Monoclonal Antibody, in Moderate-to-Severe Systemic Lupus Erythematosus. Arthritis Rheumatol. 2017;69(2):376–86. Epub 2017/01/29. 10.1002/art.39962 [DOI] [PMC free article] [PubMed] [Google Scholar]
- 3.van Vollenhoven RF, Hahn BH, Tsokos GC, Wagner CL, Lipsky P, Touma Z, et al. Efficacy and safety of ustekinumab, an IL-12 and IL-23 inhibitor, in patients with active systemic lupus erythematosus: results of a multicentre, double-blind, phase 2, randomised, controlled study. Lancet. 2018;392(10155):1330–9. Epub 2018/09/27. 10.1016/S0140-6736(18)32167-6 . [DOI] [PubMed] [Google Scholar]
- 4.Wallace DJ, Furie RA, Tanaka Y, Kalunian KC, Mosca M, Petri MA, et al. Baricitinib for systemic lupus erythematosus: a double-blind, randomised, placebo-controlled, phase 2 trial. Lancet. 2018;392(10143):222–31. 10.1016/S0140-6736(18)31363-1 . [DOI] [PubMed] [Google Scholar]
- 5.A Study of Ustekinumab in Participants With Active Systemic Lupus Erythematosus [cited 2019 06-17-2019]. Available from: https://clinicaltrials.gov/ct2/show/NCT03517722.
- 6.Mahieu MA, Strand V, Simon LS, Lipsky PE, Ramsey-Goldman R. A critical review of clinical trials in systemic lupus erythematosus. Lupus. 2016;25(10):1122–40. Epub 2016/08/09. 10.1177/0961203316652492 [DOI] [PMC free article] [PubMed] [Google Scholar]
- 7.Hoffman RW, Merrill JT, Alarcon-Riquelme MM, Petri M, Dow ER, Nantz E, et al. Gene Expression and Pharmacodynamic Changes in 1,760 Systemic Lupus Erythematosus Patients From Two Phase III Trials of BAFF Blockade With Tabalumab. Arthritis Rheumatol. 2017;69(3):643–54. 10.1002/art.39950 . [DOI] [PMC free article] [PubMed] [Google Scholar]
- 8.Bennett L, Palucka AK, Arce E, Cantrell V, Borvak J, Banchereau J, et al. Interferon and granulopoiesis signatures in systemic lupus erythematosus blood. J Exp Med. 2003;197(6):711–23. Epub 2003/03/19. 10.1084/jem.20021553 [DOI] [PMC free article] [PubMed] [Google Scholar]
- 9.Kirou KA, Lee C, George S, Louca K, Peterson MG, Crow MK. Activation of the interferon-alpha pathway identifies a subgroup of systemic lupus erythematosus patients with distinct serologic features and active disease. Arthritis Rheum. 2005;52(5):1491–503. Epub 2005/05/10. 10.1002/art.21031 . [DOI] [PubMed] [Google Scholar]
- 10.Lauwerys BR, Ducreux J, Houssiau FA. Type I interferon blockade in systemic lupus erythematosus: where do we stand? Rheumatology (Oxford). 2014;53(8):1369–76. Epub 2013/12/18. 10.1093/rheumatology/ket403 . [DOI] [PubMed] [Google Scholar]
- 11.Marbach D, Costello JC, Kuffner R, Vega NM, Prill RJ, Camacho DM, et al. Wisdom of crowds for robust gene network inference. Nat Methods. 2012;9(8):796–804. 10.1038/nmeth.2016 [DOI] [PMC free article] [PubMed] [Google Scholar]
- 12.Langfelder P, Horvath S. WGCNA: an R package for weighted correlation network analysis. BMC Bioinformatics. 2008;9:559 10.1186/1471-2105-9-559 [DOI] [PMC free article] [PubMed] [Google Scholar]
- 13.Pearl J. Causality: Models, Reasoning, and Inference: Cambridge University Press; 2000. [Google Scholar]
- 14.Mok CC. The Jakinibs in systemic lupus erythematosus: progress and prospects. Expert Opin Investig Drugs. 2019;28(1):85–92. 10.1080/13543784.2019.1551358 . [DOI] [PubMed] [Google Scholar]
- 15.Alunno A, Padjen I, Fanouriakis A, Boumpas DT. Pathogenic and Therapeutic Relevance of JAK/STAT Signaling in Systemic Lupus Erythematosus: Integration of Distinct Inflammatory Pathways and the Prospect of Their Inhibition with an Oral Agent. Cells. 2019;8(8):898 10.3390/cells8080898 [DOI] [PMC free article] [PubMed] [Google Scholar]
- 16.Isenberg DA, Petri M, Kalunian K, Tanaka Y, Urowitz MB, Hoffman RW, et al. Efficacy and safety of subcutaneous tabalumab in patients with systemic lupus erythematosus: results from ILLUMINATE-1, a 52-week, phase III, multicentre, randomised, double-blind, placebo-controlled study. Ann Rheum Dis. 2016;75(2):323–31. 10.1136/annrheumdis-2015-207653 . [DOI] [PubMed] [Google Scholar]
- 17.Merrill JT, van Vollenhoven RF, Buyon JP, Furie RA, Stohl W, Morgan-Cox M, et al. Efficacy and safety of subcutaneous tabalumab, a monoclonal antibody to B-cell activating factor, in patients with systemic lupus erythematosus: results from ILLUMINATE-2, a 52-week, phase III, multicentre, randomised, double-blind, placebo-controlled study. Ann Rheum Dis. 2016;75(2):332–40. Epub 2015/08/22. 10.1136/annrheumdis-2015-207654 . [DOI] [PubMed] [Google Scholar]
- 18.Bandy J, Milward D, McQuay S. Mining protein-protein interactions from published literature using Linguamatics I2E. Methods Mol Biol. 2009;563:3–13. 10.1007/978-1-60761-175-2_1 . [DOI] [PubMed] [Google Scholar]
- 19.Zhang B, Gaiteri C, Bodea LG, Wang Z, McElwee J, Podtelezhnikov AA, et al. Integrated systems approach identifies genetic nodes and networks in late-onset Alzheimer's disease. Cell. 2013;153(3):707–20. 10.1016/j.cell.2013.03.030 [DOI] [PMC free article] [PubMed] [Google Scholar]
- 20.Csardi G, Nepusz T. The igraph software package for complex network research. InterJournal, Complex Systems. 2006;1695(5):1–9. [Google Scholar]
- 21.Scutari M. Learning Bayesian networks with the bnlearn R package. Journal of Statistical Software. 2010;35(3):1–22. Epub 2010-07-16.21603108 [Google Scholar]
- 22.Margaritis D. Learning Bayesian network model structure from data: Carnegie Mellon University; 2003. [Google Scholar]
- 23.Barabasi AL. Scale-free networks: a decade and beyond. Science. 2009;325(5939):412–3. 10.1126/science.1173299 . [DOI] [PubMed] [Google Scholar]
- 24.Friedman J, Hastie T, Tibshirani R. The elements of statistical learning: Springer series in statistics; New York; 2001. [Google Scholar]
- 25.Tamura T, Yanai H, Savitsky D, Taniguchi T. The IRF family transcription factors in immunity and oncogenesis. Annu Rev Immunol. 2008;26:535–84. 10.1146/annurev.immunol.26.021607.090400 . [DOI] [PubMed] [Google Scholar]
- 26.Kochupurakkal BS, Wang ZC, Hua T, Culhane AC, Rodig SJ, Rajkovic-Molek K, et al. RelA-Induced Interferon Response Negatively Regulates Proliferation. PLoS One. 2015;10(10):e0140243 Epub 2015/10/16. 10.1371/journal.pone.0140243 [DOI] [PMC free article] [PubMed] [Google Scholar]
- 27.Wang F, Gao X, Barrett JW, Shao Q, Bartee E, Mohamed MR, et al. RIG-I mediates the co-induction of tumor necrosis factor and type I interferon elicited by myxoma virus in primary human macrophages. PLoS Pathog. 2008;4(7):e1000099 Epub 2008/07/12. 10.1371/journal.ppat.1000099 [DOI] [PMC free article] [PubMed] [Google Scholar]
- 28.Mistry P, Kaplan MJ. Cell death in the pathogenesis of systemic lupus erythematosus and lupus nephritis. Clin Immunol. 2017;185:59–73. Epub 2016/10/25. 10.1016/j.clim.2016.08.010 [DOI] [PMC free article] [PubMed] [Google Scholar]
- 29.Cousens LP, Goulette FA, Darnowski JW. JAK-mediated signaling inhibits Fas ligand-induced apoptosis independent of de novo protein synthesis. J Immunol. 2005;174(1):320–7. Epub 2004/12/22. 10.4049/jimmunol.174.1.320 . [DOI] [PubMed] [Google Scholar]
- 30.Li X, Leung S, Qureshi S, Darnell JE Jr., Stark GR. Formation of STAT1-STAT2 heterodimers and their role in the activation of IRF-1 gene transcription by interferon-alpha. J Biol Chem. 1996;271(10):5790–4. Epub 1996/03/08. 10.1074/jbc.271.10.5790 . [DOI] [PubMed] [Google Scholar]
- 31.Santer DM, Wiedeman AE, Teal TH, Ghosh P, Elkon KB. Plasmacytoid dendritic cells and C1q differentially regulate inflammatory gene induction by lupus immune complexes. J Immunol. 2012;188(2):902–15. 10.4049/jimmunol.1102797 [DOI] [PMC free article] [PubMed] [Google Scholar]
- 32.Kutzner A, Pramanik S, Kim PS, Heese K. All-or-(N)One—an epistemological characterization of the human tumorigenic neuronal paralogous FAM72 gene loci. Genomics. 2015;106(5):278–85. Epub 2015/07/25. 10.1016/j.ygeno.2015.07.003 . [DOI] [PubMed] [Google Scholar]
- 33.Hara M, Kitani A, Harigai M, Hirose T, Norioka K, Hirose W, et al. Differential abnormality in cell-cycle stage of peripheral B cells from patients with systemic lupus erythematosus. Rheumatol Int. 1987;7(2):83–7. Epub 1987/01/01. 10.1007/bf00270312 . [DOI] [PubMed] [Google Scholar]
- 34.Liu YP, Zeng L, Tian A, Bomkamp A, Rivera D, Gutman D, et al. Endoplasmic reticulum stress regulates the innate immunity critical transcription factor IRF3. J Immunol. 2012;189(9):4630–9. Epub 2012/10/03. 10.4049/jimmunol.1102737 [DOI] [PMC free article] [PubMed] [Google Scholar]
- 35.Meares GP, Liu Y, Rajbhandari R, Qin H, Nozell SE, Mobley JA, et al. PERK-dependent activation of JAK1 and STAT3 contributes to endoplasmic reticulum stress-induced inflammation. Mol Cell Biol. 2014;34(20):3911–25. Epub 2014/08/13. 10.1128/MCB.00980-14 [DOI] [PMC free article] [PubMed] [Google Scholar]
- 36.Bradshaw RAD, Edward A. Handbook of Cell Signaling 2009. [Google Scholar]
- 37.Papageorgiou A, Dinney CP, McConkey DJ. Interferon-alpha induces TRAIL expression and cell death via an IRF-1-dependent mechanism in human bladder cancer cells. Cancer Biol Ther. 2007;6(6):872–9. Epub 2007/07/10. 10.4161/cbt.6.6.4088 . [DOI] [PubMed] [Google Scholar]
- 38.Shi L, Perin JC, Leipzig J, Zhang Z, Sullivan KE. Genome-wide analysis of interferon regulatory factor I binding in primary human monocytes. Gene. 2011;487(1):21–8. Epub 2011/08/02. 10.1016/j.gene.2011.07.004 [DOI] [PMC free article] [PubMed] [Google Scholar]
- 39.Tsokos GC, Lo MS, Costa Reis P, Sullivan KE. New insights into the immunopathogenesis of systemic lupus erythematosus. Nat Rev Rheumatol. 2016;12(12):716–30. Epub 2016/11/23. 10.1038/nrrheum.2016.186 . [DOI] [PubMed] [Google Scholar]
- 40.Oon S, Wilson NJ, Wicks I. Targeted therapeutics in SLE: emerging strategies to modulate the interferon pathway. Clin Transl Immunology. 2016;5(5):e79 Epub 2016/06/29. 10.1038/cti.2016.26 [DOI] [PMC free article] [PubMed] [Google Scholar]
- 41.Biesen R, Demir C, Barkhudarova F, Grun JR, Steinbrich-Zollner M, Backhaus M, et al. Sialic acid-binding Ig-like lectin 1 expression in inflammatory and resident monocytes is a potential biomarker for monitoring disease activity and success of therapy in systemic lupus erythematosus. Arthritis Rheum. 2008;58(4):1136–45. Epub 2008/04/03. 10.1002/art.23404 . [DOI] [PubMed] [Google Scholar]
- 42.Rose T, Grutzkau A, Hirseland H, Huscher D, Dahnrich C, Dzionek A, et al. IFNalpha and its response proteins, IP-10 and SIGLEC-1, are biomarkers of disease activity in systemic lupus erythematosus. Ann Rheum Dis. 2013;72(10):1639–45. Epub 2012/11/03. 10.1136/annrheumdis-2012-201586 . [DOI] [PubMed] [Google Scholar]
- 43.Regad T, Chelbi-Alix MK. Role and fate of PML nuclear bodies in response to interferon and viral infections. Oncogene. 2001;20(49):7274–86. 10.1038/sj.onc.1204854 . [DOI] [PubMed] [Google Scholar]
- 44.Zhou W, Bao S. PML-mediated signaling and its role in cancer stem cells. Oncogene. 2014;33(12):1475–84. 10.1038/onc.2013.111 . [DOI] [PubMed] [Google Scholar]
- 45.Liu ZP, Wu C, Miao H, Wu H. RegNetwork: an integrated database of transcriptional and post-transcriptional regulatory networks in human and mouse. Database (Oxford). 2015;2015 Epub 2015/10/02. 10.1093/database/bav095 [DOI] [PMC free article] [PubMed] [Google Scholar]
- 46.Han H, Cho JW, Lee S, Yun A, Kim H, Bae D, et al. TRRUST v2: an expanded reference database of human and mouse transcriptional regulatory interactions. Nucleic Acids Res. 2018;46(D1):D380–D6. Epub 2017/11/01. 10.1093/nar/gkx1013 [DOI] [PMC free article] [PubMed] [Google Scholar]
- 47.Becker AM, Dao KH, Han BK, Kornu R, Lakhanpal S, Mobley AB, et al. SLE peripheral blood B cell, T cell and myeloid cell transcriptomes display unique profiles and each subset contributes to the interferon signature. PloS one. 2013;8(6):e67003 10.1371/journal.pone.0067003 [DOI] [PMC free article] [PubMed] [Google Scholar]
Associated Data
This section collects any data citations, data availability statements, or supplementary materials included in this article.
Supplementary Materials
The table lists the modules (Module), transcript clusters (TC), gene symbol (geneSymbol) and gene name (geneName).
(XLSX)
Each row corresponds one regulatory relationship (“Gene A”, “Relation”, “Gene B”), PubMed ID, and the original text describing the relationship (Hit).
(XLSX)
(XLSX)
Color represents the WGCNA module name and weight is the edge frequency in 100 runs.
(XLSX)
Data Availability Statement
Unprocessed files containing raw data and the corresponding metadata that are not provided in the supplementary material have previously been deposited in the GEO database repository (GEO accession no. GSE88884 and GSE88887) (online at http://www.ncbi.nlm.nih.gov/geo/).


