. 2019 Dec 2;8:e49494. doi: 10.7554/eLife.49494

Figure 1. NGF induces a rapid bout of fission followed by maintenance of a new steady state of mitochondria length and density.

(A) Example of mitochondria labeled by expression of mitochondrially targeted DsRed (DsRed-mito) undergoing fission and subsequent transport during the first 5–10 min of NGF treatment (40 ng/mL throughout). By 4’ the mitochondrion labeled m1 undergoes fission giving rise to m2 and m3. The two emergent mitochondria move away from each other and at 16’ m3 fissions again to give rise to m4 and m5, and again both move away from each other. (B) Determination of the percentage of mitochondria that underwent fission or fusion during an initial 10 min treatment with NGF. Each data point reflects one axon (n = 95 and 100 mitochondria from 15 and 16 axons for no NGF and NGF groups respectively; Mann-Whitney test). Arrowheads to the right of data points denote the median. (C) Mitochondria length and densities in distal 50 μm of axons, excluding growth cones, after multiple durations of NGF treatment (sample sizes shown below bars using an x(y) format where x and y denote the number of mitochondria and axons respectively). Mean and SEM shown, Bonferroni posthoc tests. (D) Percentage of mitochondria that underwent fission or fusion during a 10 min period after a 1 hr treatment with NGF (n = 110 and 126 mitochondria from 14 axons/group for no NGF and NGF respectively; Mann-Whitney test). Arrowheads to the right of data points denote the median. (E) A 45 min treatment with either BDNF or NT3 (40 ng/mL for both) decreases mitochondria length and increases density (n shown in bars using the same format as panel C; Mean and SEM shown; Welch t-test for densities, Mann-Whitney test for length). (F) Removal of NGF with inclusion of a function blocking NGF antibody after a 30 min treatment (NGF withdraw) restores mitochondria length and density to no NGF treatment levels (no NGF) by 3.5 hr. In contrast, in the continued presence of NGF (NGF) mitochondria exhibit the same trends as expected based on the data in panel C. (n shown in bars using the same format as panel C; Bonferroni posthoc tests for density and Dunn’s posthoc tests for length). (G) Percentage of mitochondria that underwent fission or fusion during a 10 min period starting at 10 min or 40 min after NGF withdraw (NGF w) following an initial 30 min treatment with NGF. The time matched control groups (NGF) underwent similar medium exchanges as the NGF w group but the medium contained NGF. Mann-Whitney tests.

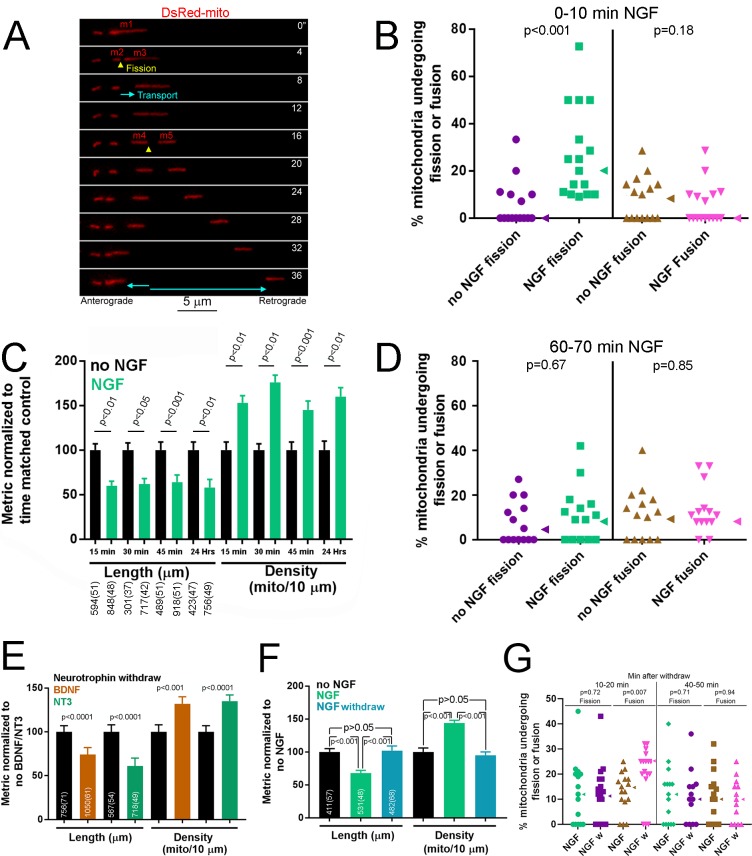
Figure 1.

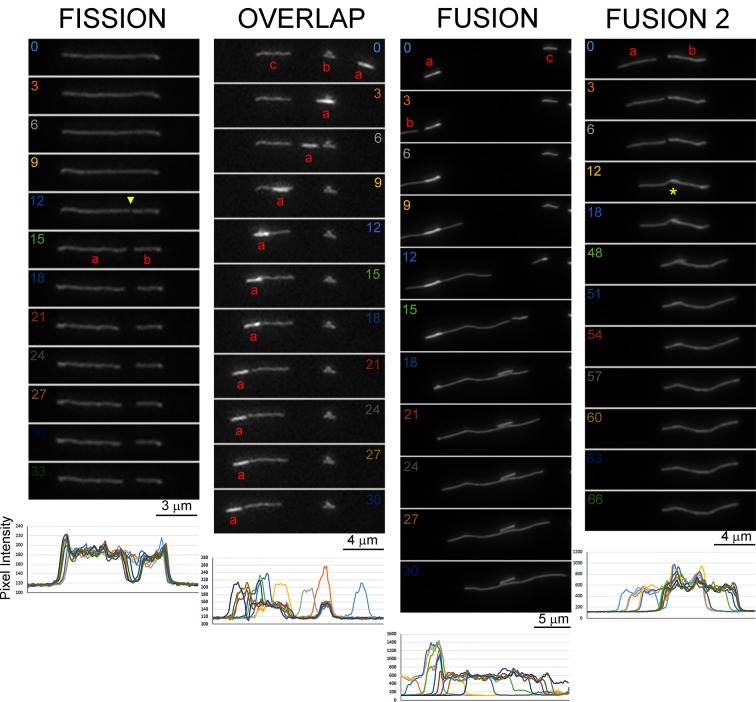
Figure 1—figure supplement 1. Examples of mitochondria fission, fusion and overlap without subsequent fusion.

Figure 1—figure supplement 1.

In all cases lines scans color coded for time (seconds), as in the panels, are shown below the time lapse sequences. Fission: At 12 s a separation along the mitochondrion becomes evident (yellow arrowhead) and is reflected in the line scan as a drop in intensity to baseline levels at this and subsequent time points. During the fission the two ends of the emergent mitochondria (a and b) separate as the ends contract away from each other. In this example the fission did not coincide with subsequent transport of either of the emergent mitochondria, although there is a slight sub-micron movement of the left end of mitochondrion a between 12–15 s. Overlap: The mitochondrion labeled ‘a’ in red moves from right to left of the panel. At 3 s it overlaps with the mitochondrion labeled ‘b’ but moves past it by 6 s. Between 9–15 s a overlaps with c. At 21–30 s a stalls adjacent to c but does not fuse as indicated by (1) no equalization of fluorescence between the two mitochondria (a is brighter; compared to the fusion examples that follow) and (2) background level intensities between the two mitochondria as shown in the line scans. Fusion: Between 0–3 s mitochondrion b enters the field to the left of a. Mitochondrion b undergoes movement to the right of the panel between 3–15 s, during which there is overlap of a and b but no apparent change in the morphology or intensity of a. At 15 s the left end of b overlaps with a. Between 18–24 s a decrease in size and by 24 s a is no longer detectable as distinct from b. The emergent mitochondrion a+b is now of uniform intensity and there is no detectable overlap in fluorescence between a and b. This is interpreted as a and b having fused and the higher intensity initially apparent for a having redistributed over the longer length of a+b (in contrast to the preceding overlap sequence). During the sequence mitochondria c and b move toward each other but do not overlap and they remain adjacent to one another without any evidence of fusion or interaction. Furthermore, the length of mitochondria a and b at 12 s, during overlap, were 2.14 and 10.66 μm respectively. At 24 s and later the length of the fused mitochondrion (a+b) was 12.82 μm. Fusion 2: Between 0–12 s mitochondria a and b come into end-to-end contact. Between 12–18 s the ends overlap (denoted by yellow *). Between 18–54 s, when fusion is considered to have occurred and there is the loss of detectable overlap, the emergent mitochondrion undergoes rightward movement at both ends. Furthermore, while a and b initially exhibited differences in intensities, a having lower intensity that b at 0 s, by 54 s the intensity along the emergent mitochondrion (a+b) is uniform and there is no evidence of overlap as would be expected if a had migrated on top of b. Furthermore, at 0 s the summed length of a and b is 7.59 μm, and the length of the emergent mitochondrion a+b by 54 s and later is 7.52 μm.
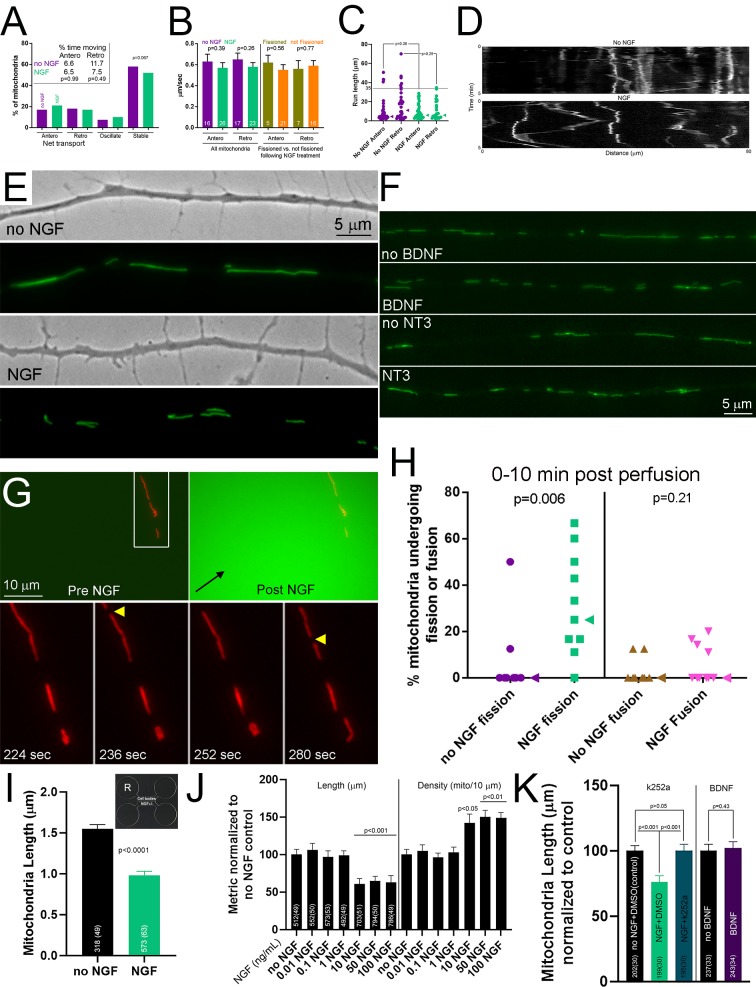
Figure 1—figure supplement 2. Net mitochondria transport and examples of neurotrophin treated axonal mitochondria.

Figure 1—figure supplement 2.

(A) During the first 5–10 min post NGF treatment there was no detectable difference in individual behavioral categories of the entire population of axonal mitochondria as reflected by the proportions undergoing net anterograde (antero), retrograde (retro), oscillatory movements without net displacement (oscillatory) or exhibiting no detectable movement (stable) (n = 95 and 100 mitochondria from 15 and 16 axons for no NGF and NGF). However, analysis of the proportion undergoing any transport relative to those stalled approached significance (p=0.067; Fisher’s exact test) with a slight trend toward more transport in the NGF treatment group (38% and 34% for NGF and no NGF, respectively). The inset shows the values for the percent of time that mitochondria spent moving in the anterograde and retrograde directions (Fisher’s exact test, no NGF versus NGF within direction of movement). (B) Transport rates of mitochondria. No effects of NGF were noted on the net transport rate considering all mitochondria regardless of whether they underwent fission, and similarly there was no detectable difference in the rates of transport for mitochondria having undergone fission or not (n = mitochondria shown in bars, Welch t-tests). (C) Graph of the lengths of ‘runs’, periods of continuous transport, classed by NGF or no NGF treatment and whether the total length of the run was net anterograde or retrograde. Each datum is a mitochondrion. NGF did not affect the median (arrowhead) length of runs. The line demarcating the 35 μm length is intended to show that runs above this length were only detected in the no NGF group. (D) Kymographs showing the behavior of mitochondria undergoing runs. In the NGF group there are multiple instances of reversal of direction by mitochondria undergoing a run (55%), which are rare in the non NGF group wherein most mitochondria (85%) undergo continuous movement in only one direction during the run. (E) Examples of mitotracker green labeled mitochondria in axons treated with NGF for 30 min and no NGF treatment axons. (F) Examples of mitotracker green-labeled mitochondria in axons treated with either BDNF or NT3 for 45 min or no neurotrophin treatment. (G) Example of an axon being perfused by NGF and the ensuing fission of mitochondria. The top left panel shows the imaging field prior to commencing perfusion from the pipette located just outside of the field of view. The top right panel shows the perfusion with medium containing NGF and Cell Tracker Green (green), and the black arrow denotes the direction of perfusion. The bottom panels show two instances of mitochondria fission (yellow arrowheads) occurring at the shown seconds after initiation of NGF perfusion. (H) Graph showing the percentage of mitochondria undergoing fission or fusion in response to perfusion with NGF containing medium or control medium in all cases containing Cell Tracker Green to monitor perfusion. Median is denoted by arrowheads to the right of data points. (I) Graph showing the length of mitochondria in axons growing into the distal compartment of microfluidic chambers containing either no NGF or NGF (labeled NGF+/-). The cell body compartment contained no NGF. The inset shows an example of the microfluidic chambers used (R = reservoir). 49 and 63 axons were sampled from 13 and 6 chambers for the no NGF and NGF groups respectively. Mann-Whitney test. (J) Concentration response to NGF treatment (1 Hr). Dunn’s multiple comparison tests within metric relative to the no NGF group. (K) Graph showing the effects of k252a (100 nM 15 min pretreatment) on the NGF-induced decrease in mitochondria lengths (30 min NGF treatment) and the lack of an effect of treatment with 100 ng/mL BDNF (1 Hr) on the length of mitochondria in axons of neurons cultured in no NGF. Dunn’s multiple comparison tests for the k252a related data sets and Mann-Whitney test for the BDNF experiment.