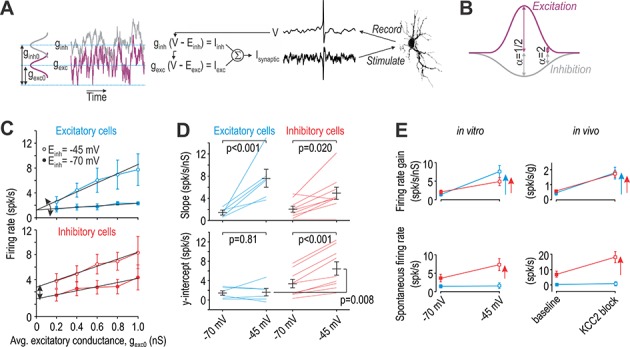
Figure 6. Excitatory and inhibitory neurons are differentially affected by virtual disinhibition.
(A) Cartoon depicts dynamic clamp experiments: noisy excitatory and inhibitory conductances were generated through separate Ornstein-Uhlenbeck processes, converted to currents based on recorded voltage, and applied to the neuron. Average excitatory conductance, gexc0, was systematically varied to plot input-output (i–o) curves. (B) Average inhibitory conductance, ginh0, was co-varied with gexc0 according to α = ginh0/gexc0, where α = 0.5 for virtual stimulation in the RF center and α = 2 for virtual stimulation in the RF surround. (C) Average i-o curves (± sem) for excitatory cells (blue, n = 6) and inhibitory cells (red, n = 8) for α = 2; see Figure 6—figure supplement 1 for results with α = 0.5. Each neuron was tested with normal inhibition (Einh = −70 mV) and again after virtual disinhibition (Einh = −45 mV). Disinhibition affected the i-o curve slope of both cell types but shifted the i-o curve only in inhibitory cells. (D) Einh had a significant effect on slope (F1,13 = 28.12, p<0.001, two-way repeated measures ANOVA). That effect did not differ significantly between cell types (interaction, F1,13 = 3.81, p=0.073) but there was a trend towards a larger increase in excitatory cells. Einh also had a significant effect on the y-intercept (F1,13 = 14.48, p=0.002) but only in inhibitory neurons (interaction, F1,13 = 11.75, p=0.004). Results of SNK tests are reported on graphs. (E) Summary of disinhibitory effects in vitro (data from panels C and D) for comparison with disinhibitory effects in vivo (data from Figure 4). Data are summarized as mean ± sem. Each colored arrow indicates a significant effect of disinhibition (p<0.05). Disinhibition significantly increased firing rate gain in all neuron types but increased spontaneous firing selectively in inhibitory neurons and non-adapting units.

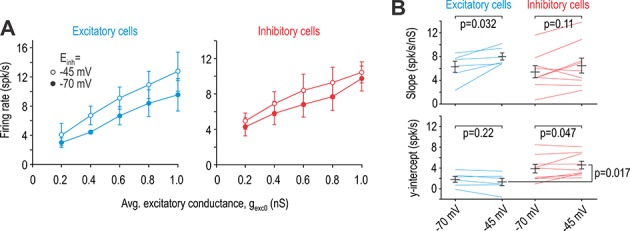
Figure 6—figure supplement 1. Effects of virtual disinhibition for α = 0.5 (virtual stimulation in RF centre).

