Abstract
Some cancer therapies damage DNA and cause mutations both in cancer and healthy cells of the patient. Therapy-induced mutations may underlie some of the long-term and late side effects of treatments, such as mental disabilities, organ toxicities and secondary neoplasms. Currently we ignore the mutation burden caused by different cancer treatments. Here we identify mutational signatures, or footprints of six widely-used anti-cancer therapies across more than 3,500 metastatic tumors originating from different organs. These include previously known and new mutational signatures generated by platinum-based drugs, and a novel signature of nucleoside metabolic inhibitors. Exploiting these mutational footprints, we estimate the contribution of different treatments to the mutation burden of tumors and their risk of contributing coding and potential driver mutations in the genome. The mutational footprints identified here allow for precisely assessing the mutational risk of different cancer therapies to understand their long-term side effects.
Introduction
Tumors initiate and evolve as a result of the interplay between somatic mutations and selective constraints faced throughout their development1. All cells of the body accumulate somatic variants arising from both endogenous and external mutational processes. Each of these processes contribute preferentially certain types of nucleotide changes in specific sequence contexts. The repertoire of somatic mutations that a cell has acquired can thus be used to identify mutational signatures, which represent the mutational processes that have been active throughout the history of a cell2–7.
Many chemotherapies, which are still the workhorse in the treatment of primary tumors, cause DNA damage or change the pool of nucleotides and hence target both cancer and non-cancer cells of patients. While many tumor and healthy cells affected by the DNA damage generated by these drugs will die, others can survive. In the offspring of the surviving cells, at least part of the original damage will be converted into mutations (Fig. 1a). Therefore, chemotherapies may contribute mutations to the tumor, and to healthy tissues of the patient’s organs, which likely underpin some of the long-term secondary effects caused by these treatments8–10. As with other mutational processes, nucleotide changes caused by chemotherapy agents will leave an imprint in the genomes of treated cells, which can be detected as specific mutational signatures. Indeed, platinum-based drugs6,7,11,12, temozolomide2,13 and radiation treatments14 have already been associated to specific mutational signatures and the mutational footprints of some of them have been confirmed experimentally6. However, virtually nothing is known about the effects of other chemotherapeutic treatments on the mutational pattern of somatic and germ cells, since mutational signatures have been studied mainly across primary chemotherapy-naive tumors. As a result, we still ignore the specific mutational profile and burden caused by most chemotherapies in patient’s cells. This is of crucial importance to understanding the resistance of tumors to chemotherapies, and to explain and predict the long-term effects of these treatments in patients. Here, using the somatic mutations present in 3,506 metastatic tumors, we identify the mutational footprints left by six anticancer therapies (five chemotherapeutic agents and radiotherapy). Using these specific footprints, we then estimate the contribution of these chemotherapies to the mutational burden of these tumors, comparing to that of endogenous mutations contributed by the natural aging process. Finally, we assess the risk mediated by each of these therapies in terms of generating coding mutations and potential cancer driver mutations. We regard these two measures as the “mutational toxicity” of these chemotherapeutic agents in different tissues.
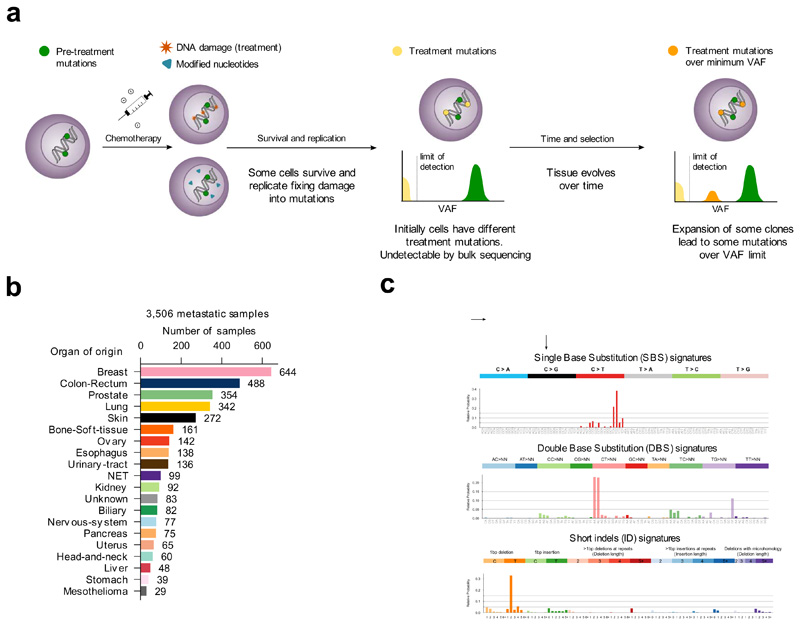
Figure 1. Mutational signatures active in metastatic tumors.
(a) Tumor cells bear mutations at the time of treatment contributed by different mutational processes. Some treatments directly damage the DNA, while others alter the pool of nucleotides, potentially causing the death of a large number of cells. Surviving cells harbor treatment-induced mutations caused by unrepaired DNA damage, the consequences of misincorporated nucleotide analogs or introduced by error-prone polymerases during repair. These treatment mutations are private to each surviving cell after the first round of replication, have low variant allele frequencies (VAF), and are undetectable through bulk sequencing. Pre-treatment mutations are present at higher VAF. Some surviving cells may grow faster than their neighbors to occupy the space opened by massive death of tumor cells. Over time, these faster-growing cells will undergo clonal expansion and their progeny will represent a larger fraction of the population, effectively amplifying their genetic material within the tumor pool. At the time of biopsy of the metastasis, the VAF of treatment mutations present in the original surviving cells may rise above the threshold of detection of bulk sequencing.
(b) Composition of the metastatic cohort in terms of organ of origin of the primary. The color code of organs of origin is used in subsequent figures. NET: Neuroendocrine tumors.
(c) Example SBS, DBS and ID signatures extracted from the metastatic cohort using SignatureAnalyzer. The profiles of all signatures identified using both methods appear in the Supplementary Note and Supplementary Datasets.
Results
Mutational signatures associated with anti-cancer therapies
We reasoned that the analysis of available metastases of patients who have undergone anti-cancer treatment regimens provide a good opportunity to identify the mutational footprint of these agents. Treatment-induced mutations occur independently across the cells in a tissue, after treatment. Therefore, they are private to each surviving cell and thus, their variant allele frequency (VAF) is below the detection limit of bulk sequencing. However, some of these cells within the tumor exposed to the treatment experience clonal expansion and, as a result in the metastases, treatment-induced mutations may become detectable through bulk sequencing (Fig. 1a). We thus analyzed a cohort of 3,506 metastatic tumor samples, sequenced at the whole-genome level15. These samples were taken from patients who previously suffered from primary tumors originating from 31 known, different organs/tissues (Fig. 1b, Supplementary Table 1). We used SignatureAnalyzer16,17 and SigProfiler2,18, two widely-employed methods based on different principles that address the non-negative matrix factorization (NMF) problem (and a third non-NMF method19 across tumors of colorectal origin) to extract mutational signatures active across these metastatic samples (Methods). Mutational signatures of single base substitutions (SBS), double base substitutions (DBS) and indels (ID) were extracted separately (Fig. 1c, Supplementary Note). Some of the signatures discovered in the tumors of the cohort have been previously identified2–4,6,18,20,21, and thus to refer to them, we employ their known etiologies (e.g., aging signature).
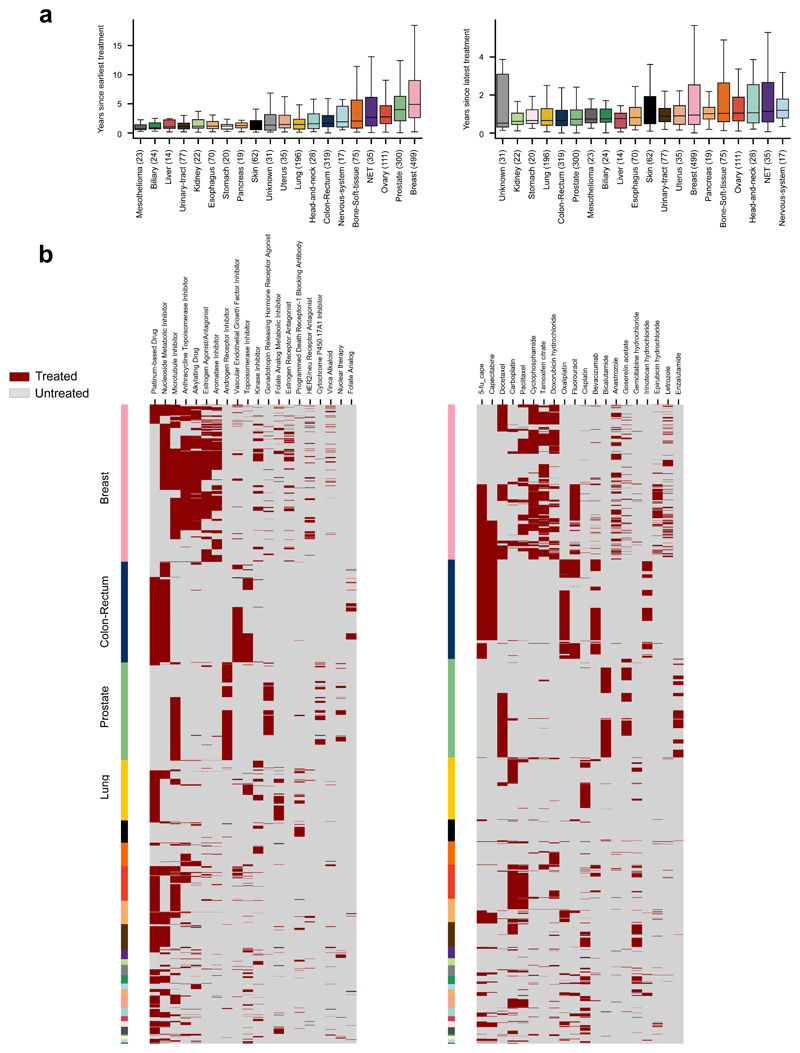
We manually curated the treatment exposure information for all patients under study. In this cohort, 2,124 tumor samples were taken from patients to whom treatments consisting of one or more of 206 drugs from 58 distinct Food and Drug Administration (FDA) classes were administered (Fig. 2a). These drugs were given to the patients 2.33 years in median prior to obtaining the biopsies of the metastases (Extended Data Fig. 1a). Platinum-based drugs (cisplatin, oxaliplatin and carboplatin) were the class most frequently employed to treat the patients in the cohort. The choice of chemotherapy was primarily guided by the organ of origin of the tumors, and most patients (1,848) received more than one drug in the course of the treatment, either in a combined or sequential regimen (Fig. 2a, Extended Data Fig. 1b).
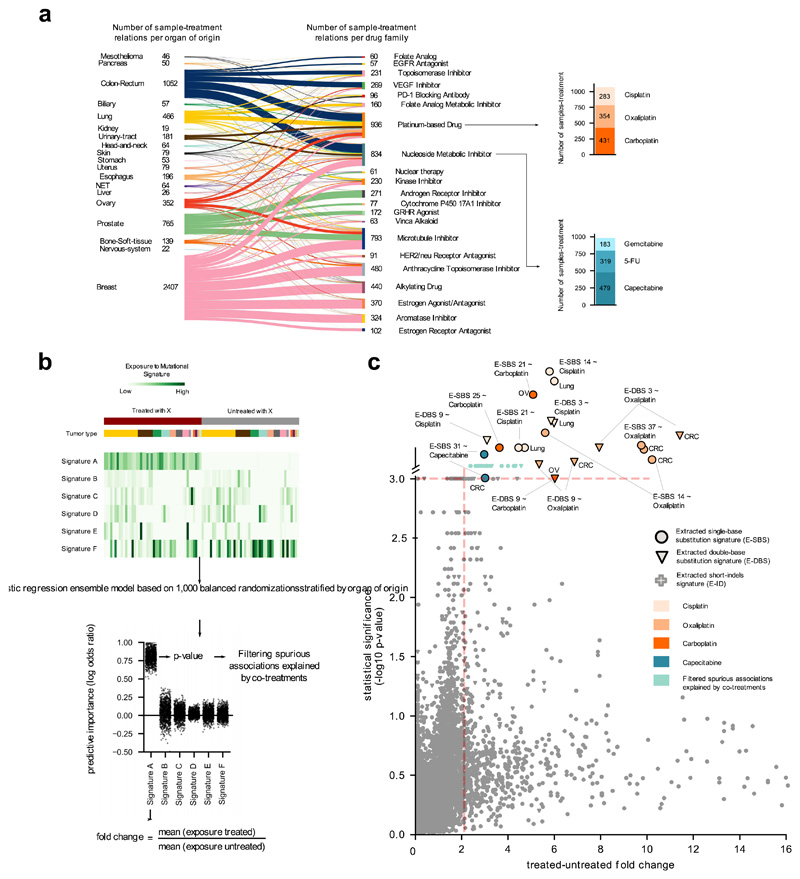
Figure 2. Mutational signatures associated with anti-cancer treatments.
(a) Distribution of treatments administered to donors in the metastatic cohort, grouped by organ of origin of the primary and FDA family. Stacked barplots at the right: number of metastatic tumors exposed to two example drugs. Due to complex regimens, donor-therapy pairs counted add up to more than the total number of tumors in panel b.
(b) Schematic representation of the ensemble regression model (Methods). Tumors from different organs (colors immediately above the heatmap) may be exposed or not to a treatment (X). One thousand balanced subsets of tumors exposed and not exposed to X are randomly sampled from this matrix stratified by organ of origin and then classified using a logistic regression. The effect size of the regression model for each signature is computed as the fold change between the mean exposure of treated and untreated tumors. The results are filtered to discard spurious associations explained by co-treatment regimens.
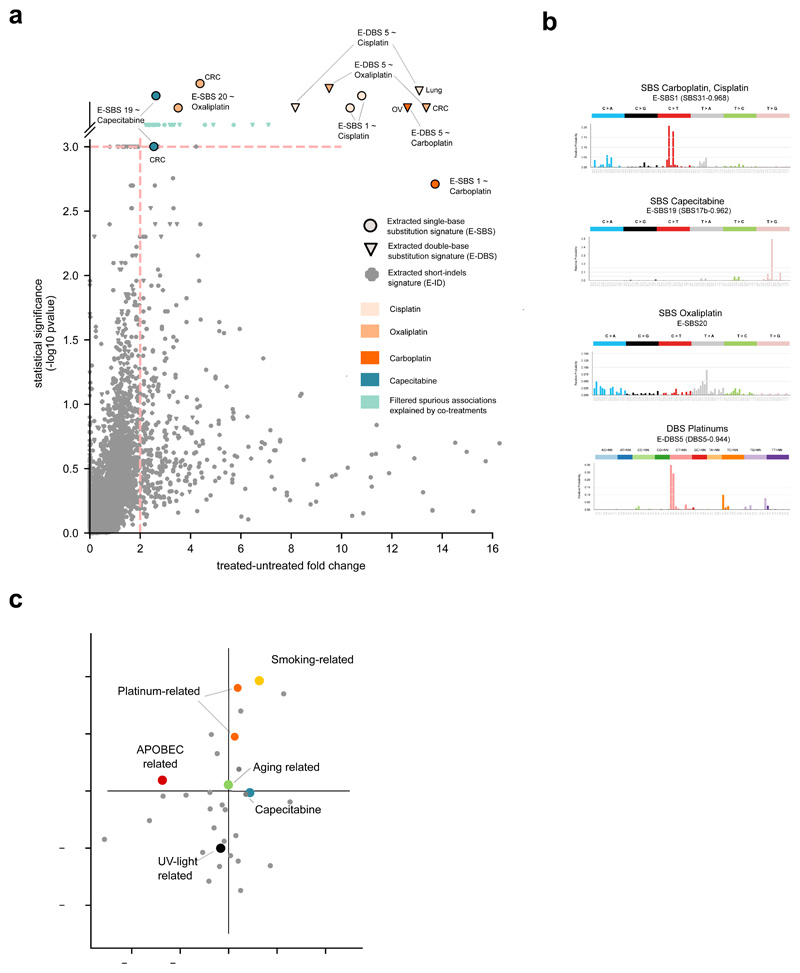
(c) Treatment-associated mutational signatures (extracted with SignatureAnalyzer). Each dot represents one of the 7,465 signature-treatment pairs tested. Associations deemed significant (effect size > 2 and p-value < 0.001) not explained by co-treatments are highlighted. Associations are detected in organ-specific regressions or through the analysis of the entire metastatic adult cohort. The carboplatin-associated signature in ovary and the capecitabine- associated signature in colorectal are “rescued”, as they appear very close to significance (p-value = 0.001). Full results are in Supplementary Table 1 and Supplementary Datasets.
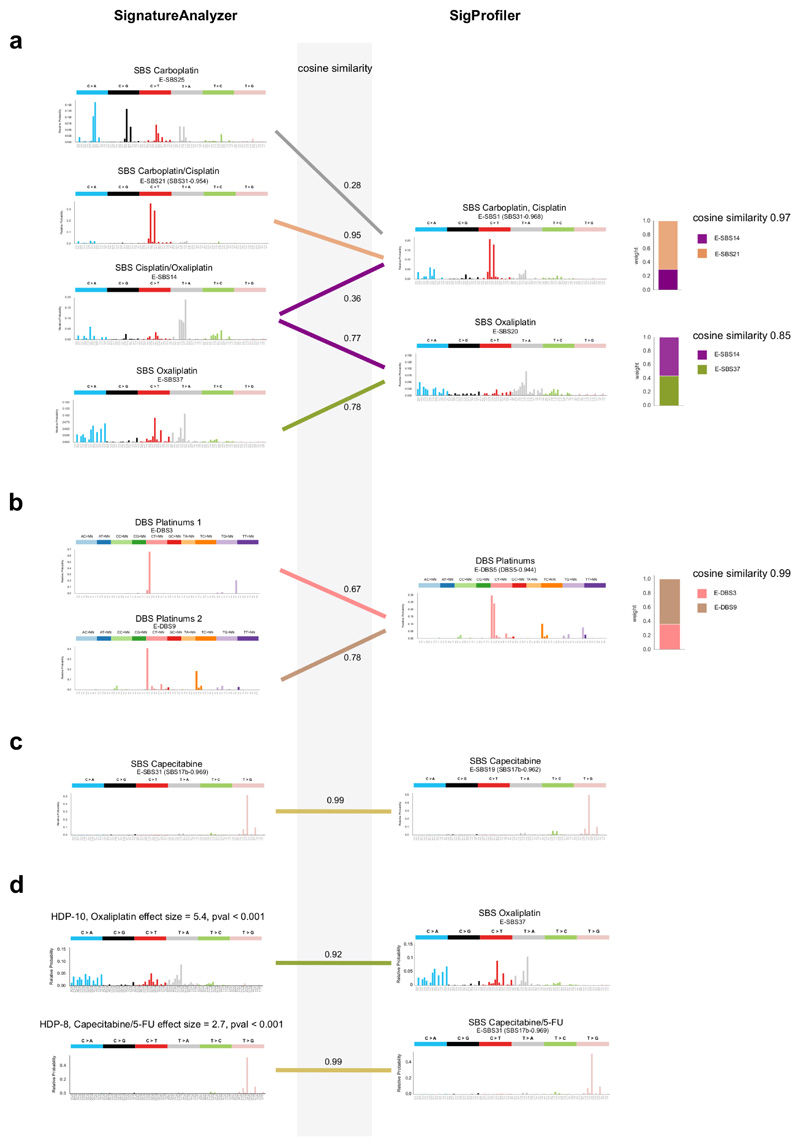
To discern the mutational signatures among those identified in this cohort that constitute the footprint of chemotherapies, we designed an ad hoc logistic ensemble regression model (hereinafter regression model). This model identifies associations between the exposure of metastatic tumors in the cohort to chemotherapeutic treatments and the activity of the identified mutational signatures (Fig. 2b; Extended Data Fig. 2a-c). It controls for potential associations between treatments and organ-of-origin of the tumors, and reliably identifies signatures associated with the treatments, as demonstrated on mutations injected in samples of synthetic datasets (Supplementary Note). The approach also controls for potential spurious associations due to simultaneous treatments with several drugs –e.g., a signature that appears related to bevacizumab, but which was actually associated with concomitant oxaliplatin. We ran pan-cancer and organ-specific regressions to gain sensitivity to identify potential associations missed across the entire cohort due to dilution effects. As a result (Fig. 2c), we identified seven mutational signatures extracted using SignatureAnalyzer (five SBS signatures and two DBS signatures) associated with four treatments with pan-cancer or organ-specific effect size > 2 and p-value < 0.001 (Methods). Interestingly, the set of SigProfiler-extracted signatures that appear significantly associated to treatments is very similar. Often, two signatures extracted as independent by one method appear as a single signature according to the other (Extended Data Fig. 3a-c). Overall, the chemotherapy mutational footprints detected are robust to the singularities of different signature extraction methods (Extended Data Fig. 3a-c, Supplementary Note and Supplementary Dataset).
The mutational footprints of six anti-cancer therapies
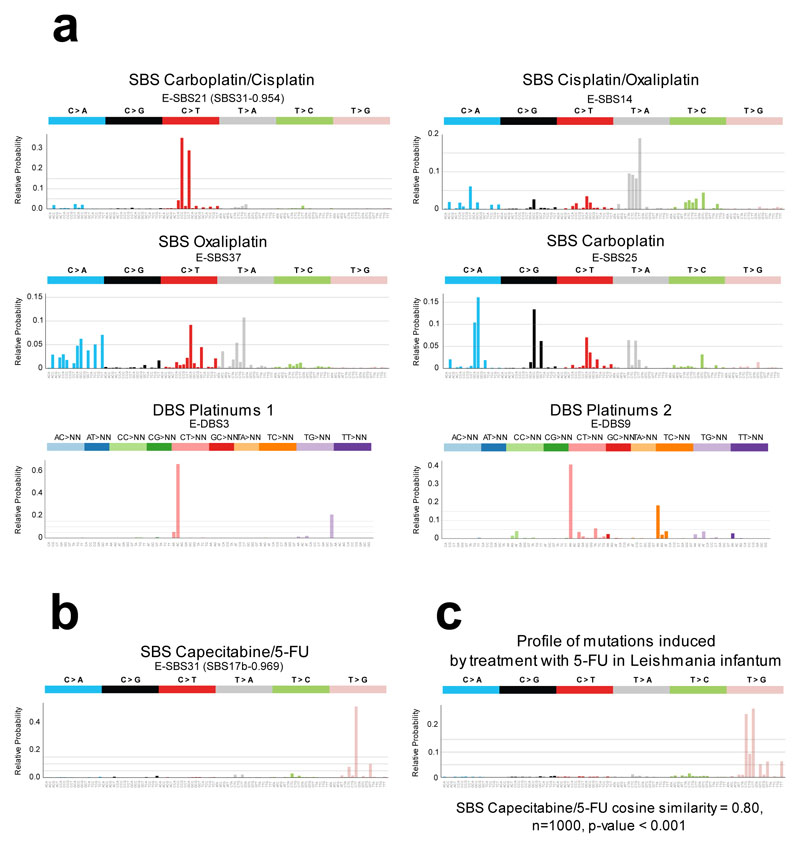
Four SBS and two DBS signatures constituted the footprint of three platinum-based drugs (Fig. 3a, Extended Data Figs. 2b,c and 3a,b), with two SBS signatures associated with more than one drug and both DBS signatures associated with the three platinum-based drugs. One signature (with cosine similarity 0.954 to the carboplatin/cisplatin SBS signature) had been previously identified as the footprint of the treatment with cisplatin or carboplatin6. On the other hand, an oxaliplatin-related SBS signature is detected in this cohort for the first time, with slight differences in the profiles identified by SignatureAnalyzer and SigProfiler. Interestingly, in colorectal tumors, an oxaliplatin-related signature virtually identical to that identified using SignatureAnalyzer is extracted by a third independent method (HDP; Extended Data Fig. 3c). Platinum-based drug-associated signatures exhibit transcriptional strand asymmetry (Methods), i.e., lower activity in the template strand of transcribed genes (Extended Data Fig. 2c). These drugs generate DNA adducts that cause RNA polymerases to stall and recruit the transcription-coupled nucleotide excision repair22,23 machinery, yielding this asymmetric activity of its mutational footprint between strands.
Figure 3. Treatment-associated mutational signatures.
(a) Mutational profiles (frequency of each tri-nucleotide change) of the six SBS and DBS signatures (in the SignatureAnalyzer extraction) associated with platinum-based treatments through the regression model. Ad hoc names following their associated therapies are given to each signature. In parentheses are the names of the corresponding previously known signatures (with cosine similarity of at least 0.8).
(b) Mutational profiles of the signature associate with Capecitabine/5-FU
(c) Mutational profile (frequency of each tri-nucleotide change) of the private mutations (not present in the parental cell) of five mutant Leishmania infantum strains treated with 5-FU; there is high similarity to the SBS capecitabine signature shown in panel (b). The empirical p-value has been derived from 1,000 randomly generated signatures (see Methods).
SBS, single base substitutions; DBS, double base substitutions; 5-FU, 5-fluorouracil.
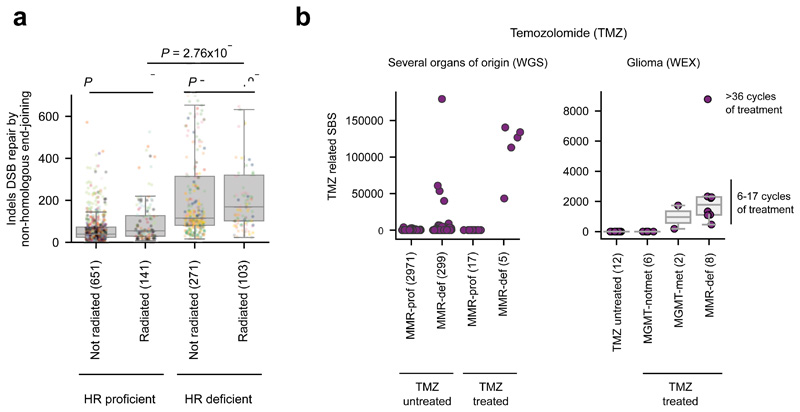
One known ID signature (ID12 in Supplementary Note) associated with radiation treatment14 appeared close to significance (p-value < 0.01, effect size < 2). Its activity is higher in Homologous Recombination (HR)-defective than HR-proficient tumors (Extended Data Fig. 4a). Both HR-proficient and HR-deficient irradiated tumors exhibit significantly higher activity of the irradiation-signature than the corresponding non-irradiated ones, although differences are larger across HR-proficient tumors. The regression model also failed to detect a known SBS signature associated with treatment of temozolomide (TMZ)2,13. We searched specifically for this signature and found it active in five TMZ-exposed samples, but lacking in 17 equally TMZ-treated tumors, thus rendering the association given by the regression model non-significant (Extended Data Fig. 4b, left panel). Previous studies have associated the burden of TMZ-related mutations to the presence of mismatch repair (MMR) inactivating mutations in tumors13. We then searched for such mutations and found them in the five tumors with TMZ-signature activity, but not in the 17 other TMZ-exposed samples. On the other hand, four MMR-deficient tumors with no annotated TMZ treatment show a relatively high activity of the TMZ-associated signature, indicating that their treatment data may be incomplete. These results, which were validated in an independent cohort of whole-exome glioblastomas (Extended Data Fig. 4b, right panel) corroborate the importance of MMR deficiency for the detection of the activity of the TMZ-related signature.
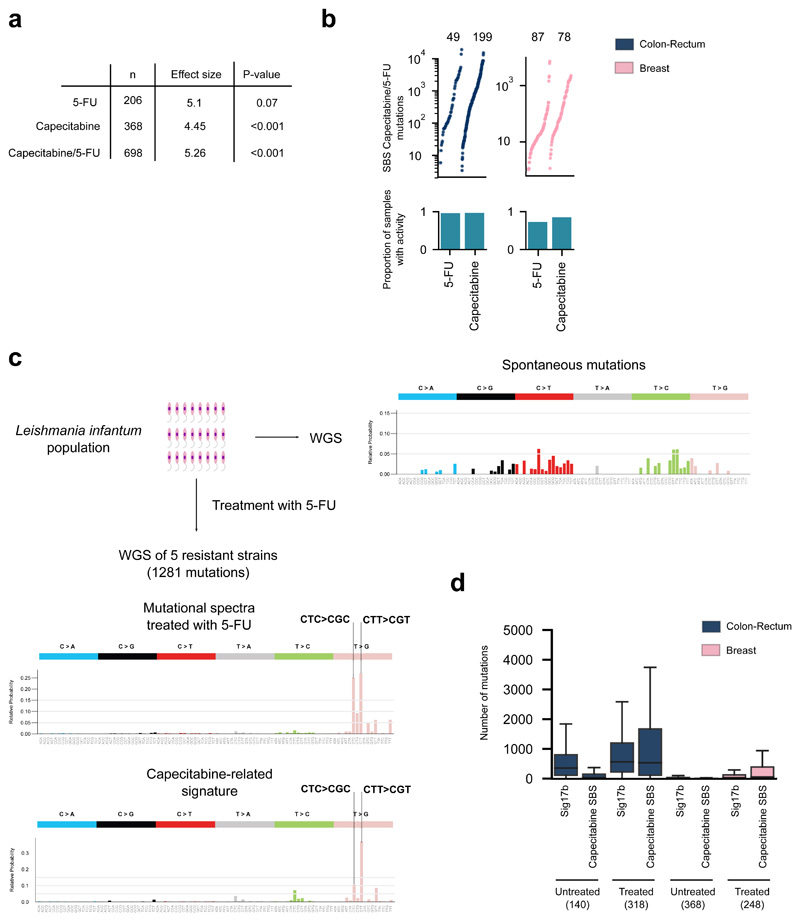
We also discovered a previously unknown SBS signature significantly associated with treatment of two nucleoside metabolic inhibitors: capecitabine and 5-fluorouracil (5-FU), a product of the metabolic degradation of the former (Fig. 3b, Extended Data Fig. 5a,b). A previous survey of chemical-induced mutational signatures failed to detect one associated with 5-FU, probably due to low doses24. Here, to obtain experimental validation of the association of capecitabine/5-FU with this signature, we analyzed mutations in five resistant cultures of Leishmania infantum exposed to 5-FU25. This showed a profile dominated by CTC>CGC and CTT>CGT mutations, very similar to that of the SBS Capecitabine signature (cosine similarity 0.8; p-value < 0.001; Fig. 3c, Extended Data Fig. 5c), confirming the etiology of the signature identified in tumors. In cells, 5-FU is converted to 5-fluorodeoxyuridine monophosphate, an inhibitor of thymidylate synthase, and 5-fluorodeoxyuridine triphosphate (FdUTP). As a result, the pool of pyrimidines triphosphate becomes acutely depleted for TMP and enriched for FdUTP, which polymerases could incorporate into the DNA26,27. The capecitabine/5-FU signature exhibits a mutational profile very similar to the known signature 17b (cosine similarity 0.97) –proposed to be caused by oxidative damage to DNA bases in certain tissues, such as esophagus28. Both the capecitabine/5-FU and the 17b signatures co-exist in the tumors of the cohort according to the three methods of signature extraction employed (Extended Data Fig. 3c). Nevertheless, while the previously reported 17b signature is active across gastric and esophageal cancers, the SBS Capecitabine/5-FU signature is detectable only in tumors exposed to the drugs (Extended Data Fig. 5d).
Characteristics of therapy-associated mutations
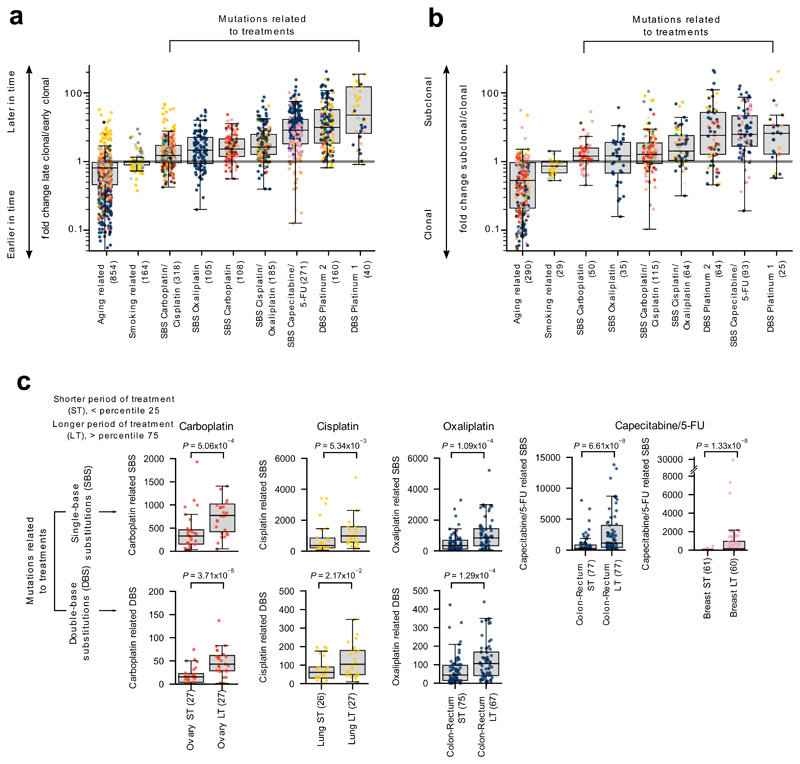
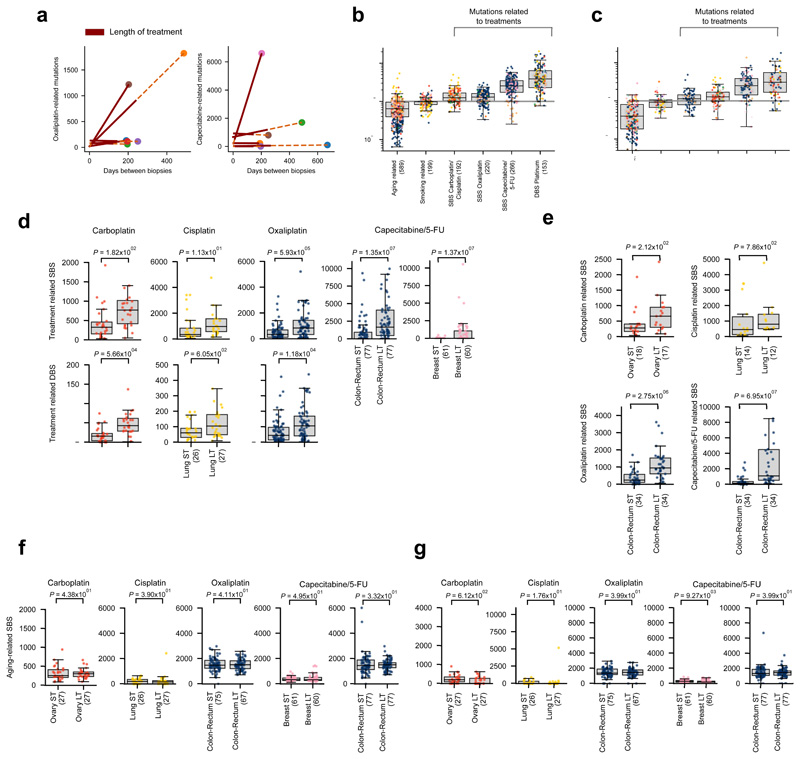
We hypothesized that, since treatment-associated signatures appear only upon exposure to the chemotherapies --that is, relatively late in the evolution of tumors (Figure 1a, Extended Data Fig. 6a)-- they should exhibit certain specific properties that differ from those contributed by many endogenous mutational processes. Thus, we computed the relative time of appearance of clonal SBS across the 3,506 tumor samples29 in the adult metastatic cohort, and classified them in each tumor as clonal early or clonal late. Then, for each tumor we computed the enrichment for late variants (late-to-early fold change) among the SBS contributed by each signature. As predicted, SBS contributed by treatment-associated signatures are enriched for late variants relative to others contributed by signatures that are active only early or throughout the evolution of the tumors (Fig. 4a, Extended Data Fig. 6b). Mutations contributed by drug-associated signatures also tend to be subclonal (Fig. 4b, Extended Data Fig. 6c). This is consistent with treatment-associated mutations being late and occurring randomly across tumor cells, and several surviving tumor cells giving rise to different clones of the metastases (Figure 1a).
Figure 4. Characteristics of treatment-associated mutations.
(a) Mutations contributed by signatures associated with treatments are enriched for later clonal substitutions (higher late-to-early clonal mutations fold change), in comparison to signatures that are active earlier or throughout the lifetime of patients (e.g., aging and smoking-related signatures). Each tumor is represented as a dot colored following the code of organ-of-origin presented in Figure 1a. In these and all other boxplots in subsequent figures, the box delimits the second and third quartiles (separated by the line representing the median) and the whiskers show the rest of the distribution, except outliers.
(b) Mutations contributed by signatures associated to treatments are also enriched for subclonal substitutions in comparison to signatures active earlier or throughout the lifetime of patients.
(c) Higher mutation load contributed by treatment-associated signatures (extraction with SignatureAnalyzer) in patients with longer periods of treatment. Comparison of the distribution of the number of SBS (upper row) and DBS (lower row) of signatures associated with each drug in tumors from patients with shorter period of treatment (ST - low quartile) and patients with longer period of treatment (LT - high quartile). Tumors of organ of origin with sufficient mutations to carry out the comparison are shown. In every case, LT tumors possess significantly more mutations than ST tumors (one-tailed Mann-Whitney test).
Furthermore, we reasoned that more mutations contributed by drug-associated signatures should appear in metastatic tumors from patients who have been under treatment for longer periods of time, or who have received more courses of treatment. We computed the duration of the overall period of exposure to a drug of tumor samples taken from patients exposed to platinum-based drugs or capecitabine/5-FU as the difference between the annotated end and beginning of the patients’ treatment with the drug. The 25% of tumors with the longest period of exposure to therapies exhibit significantly higher burden of mutations (SBS and DBS) contributed by treatment-associated signatures than the 25% of tumors with the shortest period of exposure (Fig. 4c, Extended Data Fig. 6d,e). In contrast, the number of mutations contributed by the aging signature do not differ between short-exposure and long-exposure tumor samples (Extended Data Fig. 6f,g).
Taken together, these observations provide further supporting evidence to the causal association of the treatments with the mutational signatures described above.
The mutation burden caused by therapy in metastatic tumors
Chemotherapeutic agents such as platinum-based drugs and capecitabine/5-FU have the potential to cause mutations in both tumor and healthy cells. We reasoned that the identification of their mutational footprint described above provides an opportunity to estimate their mutational toxicity across metastatic tumors of different origin, which constitutes a proxy of their mutational toxicity for healthy tissues (see discussion).
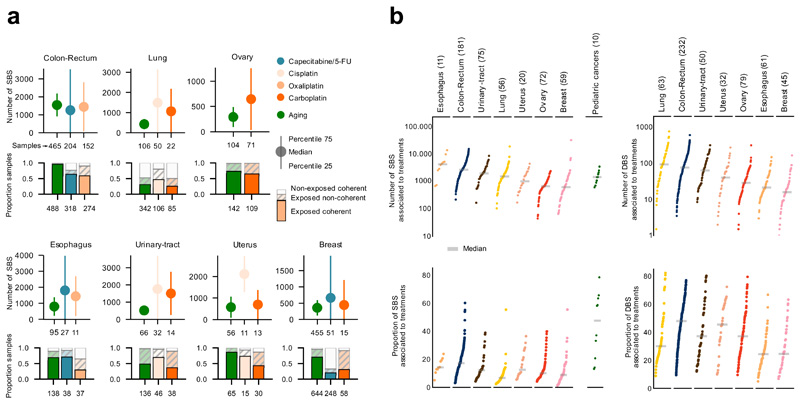
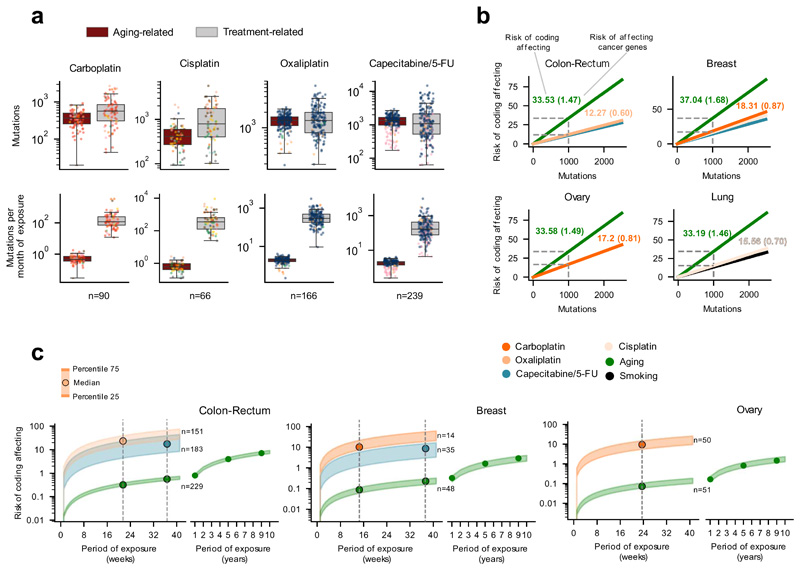
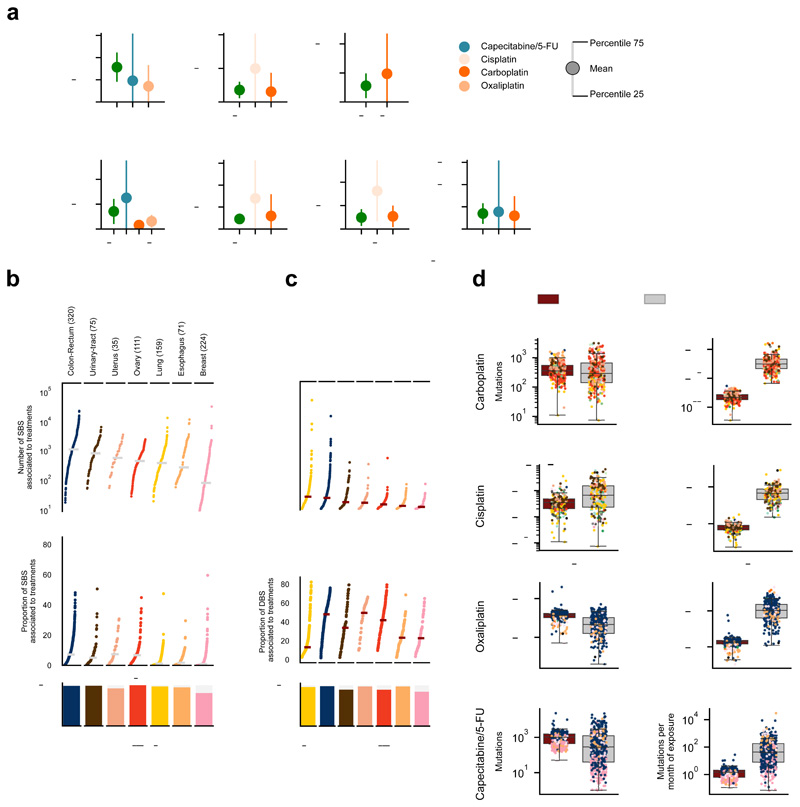
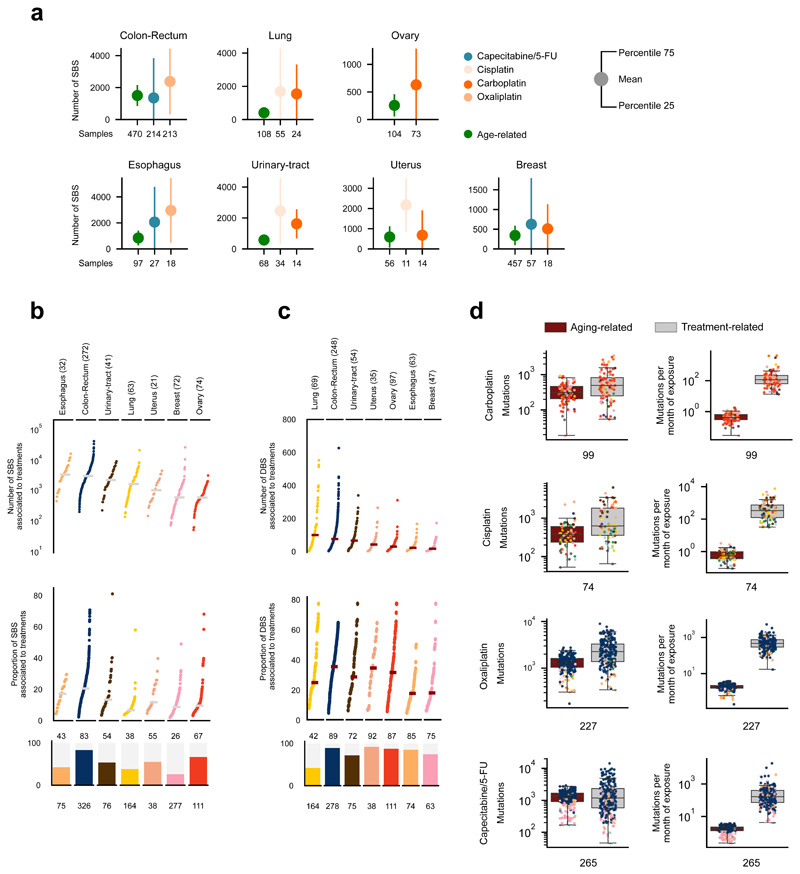
As a first estimate of the mutational toxicity of chemotherapies, we computed their contribution to the total mutation burden of chemotherapy-exposed tumors. We first demonstrated, using synthetic datasets, that if a set of mutations were injected in a cohort of tumors at genomic positions according to the tri-nucleotide probabilities of one mutational signature, the number of injected mutations could be accurately computed from the activity of said signature upon its extraction from the tumors (Supplementary Note). Platinum-based drugs and capecitabine/5-FU contributed a median of hundreds to thousands of mutations to tumors from different organs (Fig. 5a, Extended Data Figs. 7, 8a, and 9a; Supplementary Table 1 and Supplementary Datasets). Hence, by adding the mutations contributed by different treatments to the same tumors, we were able to compute the contribution of chemotherapies to the mutation burden of each individual tumor. While, as a median, the treatments administered to patients contributed several thousands SBS to tumors, we found a wide range of variation across malignancies originating from different organs (Fig. 5b, Extended Data Figs. 8b,c and 9b,c). These contributions account for between 1% and more than 65% of the total tumor mutation burden. The median number of mutations contributed by the cisplatin-associated signature in pediatric metastatic tumor samples of an independent cohort30 is similar to that observed in adult tumors. However, the median proportion of chemotherapy mutations is higher due to the lower activity of other mutational processes in pediatric tumors (Extended Data Fig. 8e). A few dozen DBS are contributed by treatment-associated signatures, which represent up to half of the DBS burden in metastatic colorectal tumors, but only 30% in metastatic lung tumors (where tobacco carcinogens also make an important contribute to the DBS burden). The overall contribution of therapy-associated signatures is the same order of magnitude as the aging signature (Fig. 6a, Extended Data Figs. 8d,h and 9d,h). Nevertheless, while tumors are exposed to treatments during a comparatively short period of time, they are exposed to aging mutations during the entire lifespan of the patients. Chemotherapies induce about 100 times more mutations than the aging signature does during the same period of exposure. (Fig. 6a, Extended Data Figs. 8d,h and 9d,h, Supplementary Table 1, Extended Data Fig. 10a,b).
Figure 5. The contribution of anti-cancer treatments to the mutation burden of tumors.
(a) Comparison of the contribution of different treatments and the aging signature to the mutation burden of tumors. Only tumors in which the activity of signatures according to SignatureAnalyzer and SigProfiler is coherent (difference of relative exposures under 0.15) are included in the contribution plots (Supplementary Note, Extended Data Fig. 7). Numbers in the x-axis represent the tumors that have coherent activity across methods included in each plot. The plots represent the median contribution of signatures to the burden of coherent tumors (filled circle), and the interquartile range of the distribution (whiskers). In the stacked bar plots below each graph, the fraction of all tumors exposed to the treatment that are coherent are colored, while the fraction of tumors with activity according to only one method or with incoherent activity is filled with diagonal lines. For example, the 318 colorectal tumors treated with the drug show activity of the Capecitabine/5-FU signature according to either method. The exposure computed by both is coherent in 64% of them (204).
(b) Contribution in total number (upper) and proportion (lower) of all treatment-associated SBS (left) and DBS (right) to the mutation burden of metastatic tumors. Only coherent tumors are included in these plots (numbers in parentheses). A separate column in the left graph presents the activity of cisplatin-associated signatures in 10 metastatic samples of four pediatric patients (Methods).
Figure 6. The mutational risk of anti-cancer treatments.
(a) Contribution (in total or averaging per month of exposure) of treatment-associated signatures and the aging signature to the mutation burden of metastatic tumors. Each tumor is represented as a dot colored following the code of organ-of-origin presented in Figure 1b.
(b) Risk (number of mutations) of several signatures of producing coding-affecting mutations estimated from their contribution to the mutation burden of tumors (Methods). Lines corresponding to tumors originated in different organs represent the linear relationship between the total contribution of signatures and their coding-affecting risk. Dashed lines mark the coding-affecting risk (spelled-out by numbers above the lines) for a contribution of 1,000 mutations. In parentheses, risk of signatures of causing mutations affecting known cancer genes31 (Methods).
(c) Risk of coding affecting mutations contributed by different signatures according to the duration of the exposure to the associated drugs. Risk values are represented as a range spanning between the 25th and the 75th percentile of the distribution of contribution of signatures to the burden of tumors in four weeks of exposure (panel a). Vertical lines intersecting these risk value ranges are placed at the median of the distribution of times of exposure of all tumors of the given organ or origin to a given drug. The range of values of risk for the mutations contributed by the aging signature is extended several years to the right of the graph.
The risk of coding mutations posed by therapies
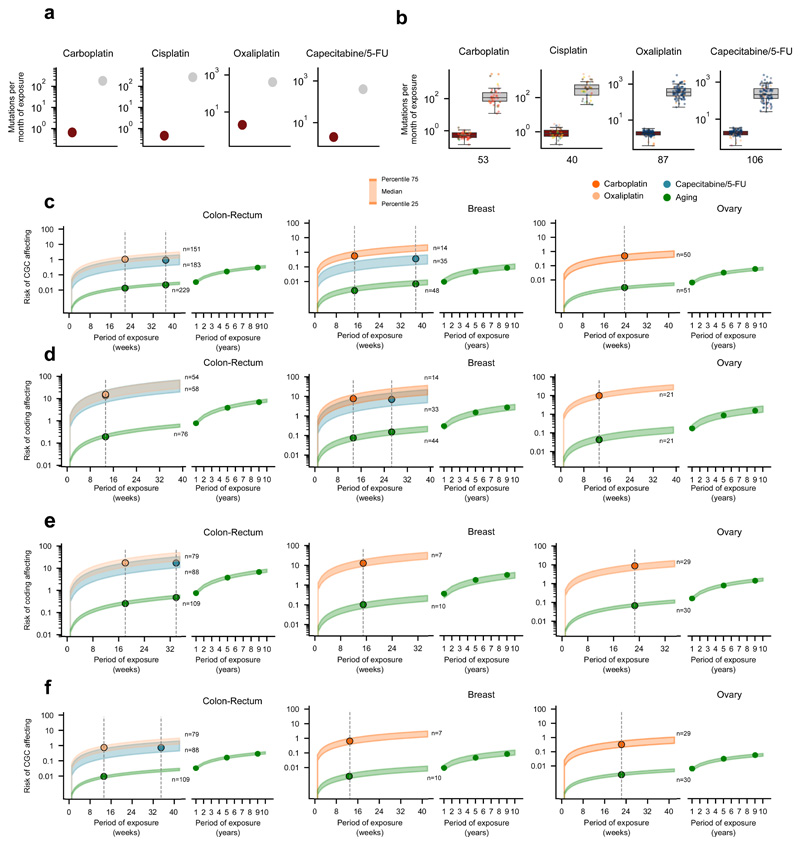
The mutational toxicity of chemotherapies can also be estimated through their risk of causing coding mutations --or specifically mutations affecting cancer genes. We reasoned that different mutational processes (by virtue of their different mutational profiles, and activity across DNA strands and genomic regions) may pose different risk of contributing coding mutations. We thus used the contribution of different therapies to the mutational burden of tumors to estimate their risk of causing coding mutations (and mutations in cancer genes31) in patients’ cells. First, the activities of a signature across the human genome is used to compute a linear relationship between the number of mutations that the signature contributes and the expected number of coding mutations, accounting for its mutational profile and its differential rate along the genome (Methods). For instance, we calculated that 33.53 out of 1,000 mutations contributed by the aging signature across tumors of colorectal origin are expected to affect the sequence of coding genes, and 1.47 are expected to affect the sequence of known cancer genes (Fig. 6b). On the other hand, out of 1,000 oxaliplatin-contributed mutations, only 12.27 are expected to affect the sequence of coding genes, and 0.6 to affect that of known cancer genes (Fig. 6b). Then, we computed the actual risk posed by chemotherapy treatments by interpolating the number of treatment-associated mutations observed across tumors (given their period of exposure to the chemotherapy) within the linear relationship described above (Fig. 6c, Extended Data Fig. 10c-e). We thus determined that tumors originated in the colon or rectum exposed for a period of 21 weeks to oxaliplatin (the median duration of the period of exposure observed for colorectal tumors in the cohort), are at risk of receiving close to 20 coding-affecting mutations and one mutation affecting a cancer gene (Fig. 6c, Extended Data Fig. 10e, f). However, during the same period, less than one coding-affecting mutation and less than 0.01 mutations affecting cancer genes are contributed by the aging process (Fig. 6c, Extended Data Fig. 10c-f).
Discussion
The short-term side-effects of some chemotherapies are mediated by the death of healthy cells, triggered by toxic levels of damage to their DNA32–36. While the loss of healthy cells may also underlie some of their long-term side-effects, somatic mutations that result from the DNA damage across tissues probably also contributes to some of them, such as the emergence of secondary malignancies37–39. This is important for cancer survivors --children in particular-- who could develop these long-term effects even decades after their initial diagnosis and treatment.
Here, we estimated the mutational toxicity of three platinum-based drugs and capecitabine, using their identified mutational footprint across metastatic tumors. Most of the mutational footprints identified in this metastatic cohort associated with these drugs have been validated by other studies2,3,6,7,12–14 or shown here (capecitabine/5-FU). Slight differences in the profile of mutational signatures identified by different reconstruction methods are observed. Often, a mutational signature associated with a treatment is split into several profiles by one of the methods used. Nevertheless, by pooling together all signatures associated with a drug and focusing on tumors with coherent activity (according to different methods), the measurement of mutational toxicity of drugs carried out here is resilient to these differences.
In our study, we use the mutational toxicity identified from samples of tumors exposed to these drugs as a proxy of their potential mutational effect across the patients’ healthy tissues. The availability of biopsies from patient’s metastasis together with the clonal expansion characteristic of tumor development provides a unique opportunity to identify drug-associated mutations (Fig. 1a). Although mutations would also accumulate in cells of healthy tissues, these samples are harder to obtain and the lack of clonal expansion would render treatment-associated mutations much more difficult to detect. The mutational risk computed here may thus be regarded as a bulk estimate of the mutagenic potential of chemotherapies across healthy tissues. The mutational risk that chemotherapies pose for various types of healthy cells from different tissues may differ due to differences in the rate of division, hierarchy and proficiency of DNA repair. These reasons and others, such as the pharmacodynamics and metabolization of drugs, will likely also determine that there is differential risks between different tissues and individuals. The estimation of mutational toxicity will thus need to be refined through carefully planned prospective studies that periodically sample healthy cells (e.g. blood) from treated patients and survivors to monitor across the years the load of mutations introduced by chemotherapies.
Our estimate of the contribution of chemotherapies to the mutational burden of metastatic tumors per time of exposure is conditioned on the annotations collected regarding the duration of the period of exposure to each treatment. Since inaccuracies and omissions may appear amongst such annotations, we also made these calculations with average time of chemotherapy exposure taken from clinical guidelines, and with the subset of patients with duration of treatment not estimated by clinicians, but rather taken directly from their charts. We obtained in all cases overall similar mutation burden and toxicity (Extended Data Fig. 10c-f). In any case, our estimate focuses on the order of magnitude --and it is meant to be understood as such-- of this contribution rather than on the actual number computed.
Although the tumors in the cohort were exposed to 206 different therapies (in complex treatment regimens), we only identified the mutational signatures of six widely-used treatments. On the one hand, therapies that don’t directly damage the DNA or alter the pool of nucleotides are not expected to leave a mutational footprint. On the other, in our analysis, we chose to be conservative, and other true associations may lie under the stringent limit of significance set (Supplementary Table 1, Supplementary Datasets). Moreover, the statistical power of this cohort may still be not enough to detect some associations. The approach developed here could be used to unravel novel drug-associated mutational signatures in larger cohorts or cohorts of specific treatments as they become available in the future.
In summary, in this study we present known as well as new mutational signatures associated with platinum-based drugs, confirm the role of defective DNA-repair pathways in certain treatment-associated signatures, and discover the mutational footprint of capecitabine/5-FU. We use the contribution of treatment footprints to the mutational burden of tumors as a proxy of their contribution to mutations generated in healthy cells of patients undergoing chemotherapy. This study provides, for the first time, a window into the precise appraisal of the risk posed by chemotherapies to induce mutations in patients’ tissues –their mutational toxicity–, which may cause late side-effects, with special potential relevance for pediatric cancer survivors.
Methods
Genomics and clinical data of tumor samples
Single base substitutions (SBS), doublet base substitutions (DBS) and indels (ID), referred to collectively as mutations, detected in 3,506 metastatic tumor samples (including relapses) were obtained from Hartwig Medical Foundation15 (version DR-024 update 2). We call this the metastatic adult cohort. We kept only mutations labeled as PASS by the calling pipeline and filtered out mutations in lowly mappable (Duke regions and CRG36mer) and low-complexity regions of the genome40. In parallel, clinical data of the donors of each sample were obtained from the same source. These data comprised the treatments administered to each patient in this cohort, and the date of beginning and end of each treatment round. We then converted treatment regimen acronyms to their unitary drugs and manually assigned drugs administered to patients to 58 different FDA drug categories (https://www.accessdata.fda.gov/cder/ndctext.zip), and the dates of beginning and end of treatments were used to compute the period of treatment.
The SBS of 12 metastatic samples from four pediatric patients were obtained from the St. Jude Cloud (St. Jude cohort), and the information regarding the treatment with cisplatin and its duration was retrieved from the metadata of a related publication30. The SBS were fitted41 to COSMIC mutational signatures version 3. In 10 of the samples of the four patients, we detected the activity of signatures 31 and 35 (cisplatin) and proceeded to compute its contribution to the mutational burden of the tumors. The exonic SBS and clinical data of one cohort of glioblastomas (treated with TMZ), as well as annotations of the tumors that had undergone hypermethylation of the MGMT promoter were obtained from a previous publication13. In the analysis of mutations of TMZ-exposed tumors, we used a pre-defined list of mismatch repair (MMR) genes42 to identify MMR-deficient tumors.
Extraction of mutational signatures active across tumor samples
The extraction of the mutational signatures active in the metastatic adult cohort tumor samples was carried out with SignatureAnalyzer16,17 and SigProfiler2,18 to ensure that the conclusions of the study were not dependent on a specific signature extraction method. The two methods chosen to carry out the extraction are currently the standard in the field and they are based on different approaches. While SigProfiler approaches the solution by bootstrapping a gradient-descent NMF iterative method, deciding the optimal number of latent signals upon ad-hoc clustering criteria, SignatureAnalyzer automatically fits a generative probabilistic model, thereby allowing for automatic inference of the optimal number of signatures. The same choices were made in a previous effort to produce a comprehensive catalog of mutational signatures in human cancers3. To run SignatureAnalyzer we used the R implementation provided by the authors of the method (https://www.synapse.org/#!Synapse:syn11801488)16,17. Because of the limitations in obtaining a MATLAB license to run the signature extraction with the SigProfiler, we reimplemented the entire procedure in the Julia programming language43 (available at https://bitbucket.org/bbglab/sigprofilerjulia). We prepared the cohort of tumor samples for both methods as explained by their authors in the analysis of similar cohorts3. All details on the execution of the methods and the comparison of their results are presented in the Supplementary Note.
For the sake of validation, we also extracted the signatures active across colorectal tumors using a third non-NMF-based signature extraction method19.
Throughout the main Figures of the paper, we present the results based on the SignatureAnalyzer extraction. Equivalent results based on the SigProfiler extraction are presented as Supplementary Figures.
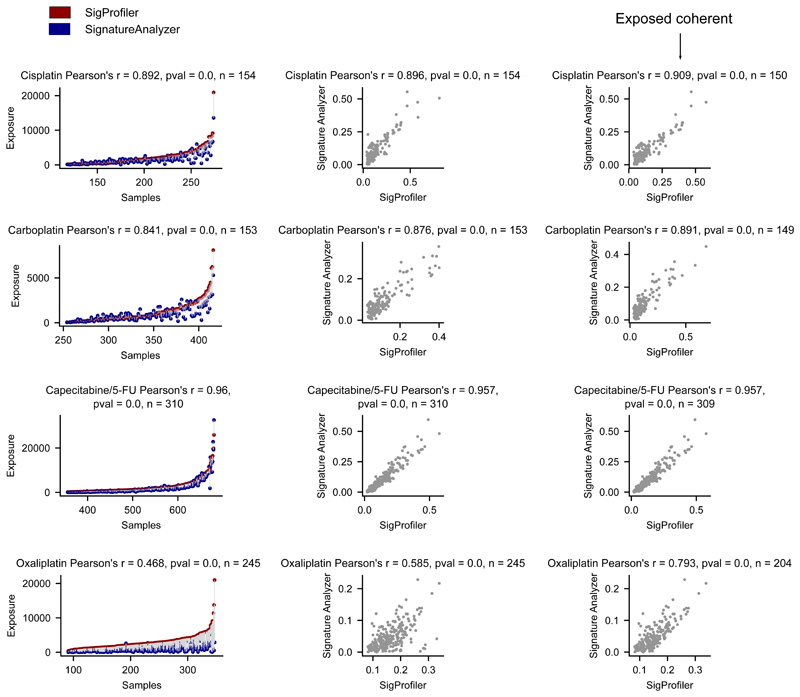
To compute the number of mutations contributed by different signatures (presented in Figures 5 and 6) we selected those tumor samples for which both methods show a minimum agreement, i.e., their relative exposures to the signature of interest --either treatment-associated or aging-related-- differ no more than 0.15. The exposure and number of mutations represented in the Figures for each signature is the mean of the values inferred from both methods. The results for all tumor samples based on each method are presented in the Supplementary Figures.
Dependencies between individual treatments and signature exposures
To infer dependencies between the treatments administered to the patients and the exposures to the mutational signatures uncovered, we required two levels of analysis. First, for each treatment label T, we established which signatures are strongly associated with T (step 1) upon adjustment for tumor type. Second, we ruled out treatment-signature associations that could be explained with higher parsimony by another concomitantly administered treatment (step 2).
To address step 1, we devised a logistic regression approach with response variable Y representing whether T has been administered or not, and design matrix given by the relative exposures of each sample to each signature. Specifically, if N is the number of samples and s is the number of signatures, let X be the design matrix of size N × (s + 1) defined by the column vectors of normalized exposures (Z-scores) to each signature across all samples, also including an intercept column. We want to estimate β =(β0, β1, …, βs) such that, logitE(Y ∨ X) = X ⋅ β, i.e., the basal effect β0 (log-odds) and the log-odds ratios β1, …, βs.
A straightforward logistic regression approach would face an important challenge in our setting: the treatments being administered to the patients show dependencies on the tumor type and since the tumor type can also explain the exposure to tumor-type-specific signatures, tumor type is a clear confounder, hence we must correct for it. To this end, we fit an ensemble of logistic models to balanced, stratified random data samples. Specifically, we fit an ensemble of 1,000 L2-regularized logistic regression models with likelihood function of the form:
with and regularization strength λ = 10.
Each logistic model was fitted with a randomized subset, balanced and stratified by tumor-type, i.e., for each tumor-type the same number of treated and untreated samples are drawn. Thus, we required the same number n = α ⋅ min(t, u) of treated and untreated samples to be drawn, where t (resp. u) are the number of treated (resp. untreated) samples for the tumor-type. The factor α was set to 1/3 as a compromise to prevent the same sample subgroups showing up in every randomization, while keeping each regression informative.
For each treatment and signature we obtained a vector (β1, …, βs) arising from each randomization that allowed us to compute an empirical p-value for each signature as the proportion of instances where the values are < 0 over the 1,000 randomizations. We also assessed the effect size of each treatment-signature association as the average fold change of the exposures to the signature between treated and untreated samples. Finally, we deemed significant those treatment-signature associations with effect size > 2 and p-value < 0.001.
In step 2 we aimed to assess the signature-specific mutation rate that can be allocated to each treatment when several concomitant treatments co-occur. The first step produced a collection of putative treatment-signature associations. However, we reasoned that some of these associations might be artifacts explained by the fact that several treatments are administered to similar sets of patients, in such a way that some treatment could “borrow” the association from the true causal treatment.
Given a treatment T and a signature S, we were bound to estimate the relative contribution of T to the exposure of S compared to other concomitant treatments associated with S. To this end we conducted a positive least-squares regression, as follows: let N be the number of samples, let X be the N × 2 design matrix with binary values with columns corresponding to T and a concomitant treatment C, and let Y be the N-dimensional vector of exposures of the target signature S. We want to estimate β = (βT, βC) with βi ≥ 0 such that E(Y ∨ X) = X ⋅ β. We can think of each βi as an “average efficiency” to generate exposure of signature S; likewise, we can think of βT/βC as the “relative efficiency” of T with respect to C. Bearing in mind this set-up, we can now analyze all the concomitant treatments of T and check in each case whether the estimated efficiencies support that T is the most efficient generator of exposure of signature S: if the resulting efficiency of T is higher than all the other concomitant treatments associated to S, we conclude that T is the treatment most likely associated with S.
Finally, we run the above described steps with two treatment settings: coarse-grained and fine-grained. The coarse-grained setting considers groups of treatments by FDA category. The fine-grained setting considers specific treatment labels. For the sake of consistency, we deem a treatment-signature association significant if either of the following conditions hold: i) both the specific treatment and its FDA group raise significance in the fine-grained and coarse-grained setting, respectively; ii) the specific treatment raises significance in the fine-grained setting, but no FDA group raises any significance in the coarse-grained setting.
Validation of the approach using synthetic datasets
We built synthetic datasets of mutations that are similar to the metastatic tumors analyzed with regard to the composition of mutational signatures. We then injected a known number of mutations drawn from the mutational profile of a foreign signature to a known number of samples of these synthetic datasets. We thus control the number of samples bearing the mutational footprint of the drug, the number of drug-induced mutations present in each sample, the signature of the drug-induced mutations and the number of samples known to have undergone treatment (allowing for discrepancies between these two parameters). Using these synthetic datasets, we tested i) the extraction of drug-associated signatures, ii) the detection of the mutational footprints of drugs through the regression ensemble, iii) the identification of the correct etiology of the signature in the case of tumors exposed to co-treatments, and iv) the accuracy of the estimation of the number of mutations contributed by drugs to the burden of tumors. In the analyses, we challenged our entire methodological setting with fluctuations in the synthetic data reflecting a variety of common scenarios. The analysis of these synthetic datasets demonstrates that the approach followed correctly identifies the foreign signatures as the molecular footprints of anti-cancer treatments within a wide range of numbers of exposed samples. The methodology is robust to systematic errors such as miss-annotation of treatments or lack of activity of the associated signatures in a subset of exposed samples. It is also able to estimate the mutational burden contributed by the treatment within acceptable confidence intervals. The results of these analyses have been useful to fine-tune the parameters of the methodologies developed to detect the mutational footprint of treatments. Details of the methodology and results of the analysis with synthetic datasets are in the Supplementary Note.
Identification of mutational signatures active across other metastatic tumors
Due to the low number of mutations in the glioblastoma cohort employed in the analyses, rather than extracting mutational signatures de novo, we fitted the catalog of identified mutational signatures7 to the mutational profile matrix of each sample of the cohort. We employed deconstructSigs41 using PCAWG SBS3 as a reference signatures.
Strand asymmetry of treatment-associated signatures
To compute the strand asymmetry of the signatures activity we used a slight modification of an approach described elsewhere44. Briefly, using pyrimidines as a base reference, we classified each of the mutations as occurring in either transcribed and non-transcribed (leading and lagging). We then retrieved the trinucleotide context, thus obtaining 96 channels for both transcribed and non-transcribed (resp. leading and lagging) yielding 192 in total. The identity of the signatures extracted across the 192 channels (averaged) is assessed through their cosine similarity to the signatures extracted from the adult metastatic cohort across the 96 channels. We pooled the tri-nucleotide counts corresponding to each of the six pyrimidine base change channels (C>A through T>G) and selected the channel with the largest contribution to the signature profile to represent it. Then, the activity of these channels in the transcribed and non-transcribed (leading and lagging) strands were computed. Letting the activity in the transcribed (leading) strand be S1 and the activity in the non-transcribed (lagging) strand be S2, we computed the strand asymmetry as (S2 − S1)/(S2 + S1). This is the value plotted in Extended Data Figure 2c.
Relationship between activity of treatment-associated signatures and duration of exposure
We sorted metastatic tumor samples originated from each organ following the duration of their exposure to different treatments. Then, for cohorts with more than 40 tumor samples with mutations associated with each treatment, we made two groups of samples, long-exposure and short-exposure containing the 25% tumor samples with longer and shorter treatment duration, respectively. We obtained the number of mutations associated with treatment i in each tumor as:
where Sij for j = 1,…, n are the relative exposures of the tumor to the mutational signatures associated to treatment i, and M is the total mutation burden of the tumor. Finally, we compared the distribution of the burden of treatment-associated mutations of short-exposure and long-exposure tumor samples using the Mann-Whitney U test.
The timing and clonality of treatment associated mutations
We used the MutationTime.R package developed elsewhere29 and tested across 2,658 primary tumor samples. This tool exploits large chromosomal amplifications and/or whole-genome duplication of a tumor, to classify all its SBS as early, late or subclonal. The method classifies mutations in a tumor as clonal early, clonal late, or subclonal. Then, we associated each mutation uniquely with a mutational signature using a maximum likelihood approach45,46.
We computed the fold change between the relative proportions of late and early clonal mutations associated to specific mutational signatures, such as the ones associated with platinum-based drugs or capecitabine/5-FU as well as with other etiologies. We provided this fold change as (n1/N1)/(n0/N0), where n0, n1 are the number of signature-associated mutations labeled clonal early and clonal late, respectively; and N0, N1 are the total number of mutations labeled clonal early and clonal late, respectively.
Similarly, we computed the fold change between the relative proportions of clonal (grouping early and late clonal mutations) and subclonal mutations associated to specific mutational signatures. We provided this fold change as (ns/Ns/[(n0 + n1)/(N0 + N1)], where ns is the number of signature-mutations labeled subclonal and Ns is the total number of subclonal mutations.
Risk of acquiring coding-affecting mutations through treatments
For each cohort of tumor samples we inferred the proportion of neutral mutations hitting coding non-synonymous sites that can be explained by a group of etiologies. The attribution of the observed mutations to etiologies was carried out resorting to the signatures for which we could establish an association with the etiology. The etiologies –alongside their corresponding SigProfiler signatures– are the following:
capecitabine: E-SBS19;
carboplatin: E-SBS1;
cisplatin: E-SBS1;
oxaliplatin: E-SBS20;
tobacco-smoking: E-SBS17;
aging: E-SBS23;
To conduct this analysis, we partitioned the sequence of the human genome into 1-Mb chunks. Non-mappable and repetitive positions were discarded. For the etiology and cohort of samples of interest, we considered all the mutations observed in each chunk, excluding those mutations in Cancer Gene Census (CGC) genes31 to avoid positive selection bias.
To model the local mutation rate explained by an etiology S across 1-Mb chunks, we rely on a generative probabilistic model whereby: i) the probability that a new mutation occurs in a 1-Mb chunk is proportional to the average number of mutations in this chunk explained by S across samples; ii) the probability that a new mutation reaches a specific site with context c in the 1-Mb chunk is proportional to the normalized relative frequency of mutations in context c implied by signature S --i.e., the relative frequency for context c given if all reference tri-nucleotides had the same abundance.
From the signature deconstruction analysis, we inferred the function PS(c, i) encoding the probability that a mutation in context c and sample i has been generated by signature S. Given a chunk, say k, let nci be the number of mutations in context c and sample i observed in the chunk. Then the average number of mutations explained by S across samples in chunk k is:
If fc stands for the normalized relative frequency for channel c in signature S, we assigned all the per-mappable-site mutation probabilities of the chunk as follows: letting nc be the count of mappable sites in context c, all the sites of the chunk in context c are given the same probability pc determined by the following two conditions:
Finally, using VEP 8832 we annotated the most severe consequence types for each genic (coding) mapping to each mappable site of the chunk. We then counted all possible nucleotide changes yielding mutations that potentially affected the sequence of coding genes (i.e., non-synonymous and truncating) for each context c in the chunk: let mc be this count.
Finally, we estimate the proportion of coding-affecting mutations among neutral mutations explained by S across all chunks as:
where k denotes the index of the chunks, and we denote the specific counts and probabilities for each chunk with the (k) superscript.
In summary, we obtained a site-specific neutral mutation rate explained by a given signature S first by using the observed mutations to define local mutation rates in 1-Mb chunks; then by spreading a single mutation as site probabilities in accordance with the operative signature; finally, by deriving an expected overlap of a unit exposure with the coding-affecting region.
5-fluorouracil mutations in mutant strains of Leishmania infantum
Sequencing reads of five mutant strains of Leishmania infantum resistant to treatment with 5-fluorouracil, and the parental sensitive strain25 were obtained from the ENA database (EMBL-EBI European Nucleotide Archive, secondary accessions ERP002415 and ERP001815, respectively). The five mutant strains had been treated with 5-fluorouracil previous to sequencing, while the parental strain was cultivated under the same conditions (with exception to the drug) and for the same duration. We downloaded the Leishmania infantum reference genome from the Ensembl genomes database, and aligned the reads of both the resistant and the parental strains to its sequence, using bowtie247. As in the original publication reporting this dataset, the aligned reads were sorted and processed with samtools48, and mutations were called for the parental and resistant strains. High quality mutations (above 20) were used to build the mutational profile (tri-nucleotide context changes) of each sequenced strain.
Significance of cosine similarity with respect to a signature
Given a mutational signature S (e.g., SBS capecitabine) and a cosine similarity C (e.g., 0.8) we can associate a p-value to C relative to the signature S by randomly drawing vectors σ from the signature simplex and computing the frequency with which cos(S, σ) ≥ C. We carried out this computation by randomly drawing 1,000 signatures with the same expected sparsity as found in the COSMIC catalogue: first, a signature is chosen uniformly from COSMIC catalogue; then a random permutation is applied on the channels.
Cosine similarity reconstruction
Given three profiles S, C1, C2 we find the weight parameter 0 < w < 1 that minimizes the cosine distance between the combination C(w) = w ⋅ C1 + (1 − w) ⋅ C2 and S, i.e., we maximize the objective function cos(S, C(w)) subject to the constraint 0 < w < 1.
Compilation and use of clinical guidelines
We compiled the clinical guidelines of treatment with a range of drug combination regimens for different tumor types from the clinical guidelines and the scientific literature. This compilation is presented as Supplementary Table 2 and contains details of the provenance of all guidelines listed. We then selected a duration of treatment within the interval contained in the guidelines for each drug and tumor type (taking into account all analyzed regimens). Selected duration times (listed at the bottom of Supplementary Table 2) were used to repeat the calculations of number of mutations contributed by each treatment per month of exposure and their risk of contributing coding mutations and mutations in cancer genes.
Extended Data
Extended Data Fig.1. Treatments administered to patients in the metastatic adult cohort.
(a) Left: distribution of time elapsed since earliest treatment administered to patients in the metastatic adult cohort. Right: Distribution of time elapsed since latest treatment administered to patients in the metastatic adult cohort.
(b) Left: exposure (binary Treated/Untreated) of tumors originated in different organs (rows labeled with color code introduced in Fig. 1 of the main paper) to drugs within different FDA classes (columns). The number of tumors exposed to each drug family are shown in Figure 2a. Right: exposure (binary Treated/Untreated) of tumors originated in different organs (rows) to selected chemotherapies (columns).
Extended Data Fig.2. Treatment-associated signatures.
(a) Equivalent to Fig. 2c of the main paper for signatures extracted using SigProfiler. The Carboplatin/Cisplatin-associated and the Capecitabine/5-FU signatures appears very close to significance (p-value=0.002 and p-value=0.001, respectively) and has thus been “rescued” as associated with the treatment.
(b) Mutational profiles of SigProfiler-extracted SBS and DBS signatures associated to treatments. We show the cosine similarities of E-SBS1, E-SBS19, E-DBS5 against signatures SBS31, SBS17b and DBS5, respectively.
(c) Strand asymmetry of selected SignatureAnalyzer-extracted signatures. Each dot corresponds to a signature, with the abscissa representing its replication strand bias and the ordinate, the transcriptional strand bias. Note that strand bias is calculated taking as reference the channels in the mutational profile. Therefore, UV light-, tobacco and platinum-related drugs-induced mutations all show asymmetry with respect to transcription in the same direction, but appear positive or negative in the graph due to the specifically base that suffers each damage in the first place.
Extended Data Fig.3. Comparison of treatment-associated signatures extracted with SigProfiler and SignatureAnalyzer.
(a) SignatureAnalyzer extracts four signatures for platinum based drugs, while SigProfiler extracts two. A linear combination of E-SBS21 and E-SBS25 extracted by SignatureAnalyzer and associated to Carboplatin and Cisplatin, yields a profile that is very similar to the signature associated with the same treatments extracted by SigProfiler (E-SBS1, cosine similarity 0.97). Similarly, a linear combination of E-SBS14 and E-SBS37, extracted by SignatureAnalyzer and associated to Cisplatin and Oxaliplatin, yields a similar profile to E-SBS20, extracted by SigProfiler and associated to Oxaliplatin (cosine similarity 0.85).
(b) A linear combination of E-DBS3 and E-DBS9, extracted by SignatureAnalyzer and associated to platinum based drugs, yields a very similar profile to E-DBS5, extracted by SigProfiler and associated to the same drugs (cosine similarity 0.99).
(c) The capecitabine-associated SBS signatures reconstructed by both methods are very similar (cosine similarity 0.99).
(d) Oxaliplatin-related and capecitabine-related signatures extracted from colorectal tumors using a not-NMF approach compared to homologous signatures extracted using SignatureAnalyzer. Both signatures possess virtually identical profiles to those extracted using SignatureAnalyzer.
Extended Data Fig.4. Mutational signatures associated to radiation and temozolomide.
(a) HR-deficiency plays a key role in the appearance of an ID signature (SignatureAnalyzer-extracted) previously associated to radiation. Tumors in the top quartile of activity of HR signature (BRCAness signature) are considered HR-deficient, while tumors in the bottom quartile are deemed HR-proficient. The distribution of the number of IDs of this signature across HR-deficient and HR-proficient tumors either exposed or not exposed to radiation have been compared using a one-tailed Mann-Whitney test.
(b) MMR or MGMT-deficiency plays a key role in the generation of a TMZ-associated SBS signature. Left panel represents the load of TMZ-associated SBS in tumors exposed or unexposed to TMZ separated by their MMR status (considered defective with at least one protein-affecting mutation in an MMR-related gene). Right panel represents the load of TMZ-related exonic SBS in recurrent glioblastomas in an independent cohort exposed or not exposed to TMZ. TMZ-treated, non-MMR-deficient tumours have been split into two groups based on the methylation status of the MGMT promoter.
Extended Data Fig.5. The capecitabine/5-FU mutational footprint.
(a) Association between a mutational signature and the treatment with capecitabine and/or 5-FU. The numbers in the table represent the p-value and effect size of the corresponding regression models testing the effect of both drugs separate or pooling the tumors exposed to either. The association between the signature and 5-FU treatment does not reach significance (p=0.07), but exhibits a large effect size.
(b) Contribution of capecitabine and 5-FU to the mutation burden of colorectal (left) or breast (right) tumors exposed to either drug. The barplots represent the proportion of 5-FU- and capecitabine-exposed tumors with activity of the SBS Capecitabine/5-FU signature among samples treated with either drug.
(c) Mutational profile of 5-FU-induced mutations in five resistant strains of Leishmania infantum. The profile was built with the mutations private to the strains after treatment with 5-FU (that is, after subtraction of the mutations found in the parental strain).
(d) Contribution of SBS Capecitabine/5-FU signature and the previously reported 17b signature (Sig17b) to the mutation burden of colorectal and breast tumors either not exposed or exposed to capecitabine/5-FU.
Extended Data Fig.6. Treatment-associated mutations occur late in tumor development.
(a) Pairs of biopsies of the same patient taken before the start and during or after treatment are represented as a dashed line. The upward trajectory of patients treated longer supports the conclusion that the signatures associated to treatments through the regression are indeed the mutational footprint of the therapies. Dots correspond to tumors of organs of origin colored as in Figure 1b.
(b) Mutations of SigProfiler-extracted signatures associated to treatments are enriched for later substitutions. Dots correspond to tumors of organs of origin colored as in Figure 1b.
(c) Mutations of SigProfiler-extracted signatures associated to treatments are enriched for subclonal substitutions. Dots correspond to tumors of organs of origin colored as in Figure 1b.
(d) Comparison (one-tailed Mann-Whitney test) of the number of treatment-related mutations (according to SigProfiler) contributed by different drugs between short-exposure and long-exposure tumors, as in Figure 2d. Dots correspond to tumors of organs of origin colored as in Figure 1b.
(e) Comparison (one-tailed Mann-Whitney test) of the number of mutations contributed by different drugs between short-exposure and long-exposure tumors, as in Figure 2d. In this figure only tumors from patients whose treatment duration is not estimated by clinicians, but rather exactly recorded in charts are included.
(f, g) The mutation load contributed by the aging signature (f, SignatureAnalyzer; g, SigProfiler) does not correlate with the time of exposure to treatments.
Extended Data Fig.7. Selection of coherent tumors according to the activity of signatures attributed by both extraction methods.
Left panels show the agreement of both methods in the attribution of the activity of treatment-associated signatures across tumors. Each pair of circles connected by a line represents the exposure attributed by both methods to a tumor. Red circles represent the exposure attributed by SigProfiler, while blue circles represent the exposure attributed by SignatureAnalyzer. Middle panels show the correlation (with Pearson’s r) between the exposure attributed by both methods to all tumors, while right panels present the correlation (with Pearson’s r) of the exposure attributed by both methods to coherent tumors (difference between relative exposures lower than 0.15).
Extended Data Fig.8. The contribution of anti-cancer treatments to the mutation burden of tumors (according to SignatureAnalyzer).
(a) Comparison of the contribution of different treatments and the aging signature to the mutation burden of tumors originated in different organs.
(b, c) Contribution in total number (upper) and proportion (lower) of all treatment-associated SBS (b) and DBS (c) to the mutation burden of metastatic tumors originated in different organs.
(d) First column: distribution of the contribution of treatments (and the aging signature) to the mutation burden of tumors exposed to them. Second column: distribution of the contribution of treatments (and the aging signature) to the mutation burden of tumors during one month of exposure.
Extended Data Fig.9. The contribution of anti-cancer treatments to the mutation burden of tumors (according to SigProfiler).
(a) Analogous to Extended Data Fig. 8a.
(b, c) Analogous to Extended Data Fig. 8b,c.
(d) Analogous to Extended Data Fig. 8d.
Extended Data Fig.10. Risk of coding affecting mutations in cancer genes.
(a) Contribution of treatment-associated signatures and aging signature to the mutational burden of metastatic tumors. The duration of the period of exposure is taken from the average duration of courses of treatment indicated in clinical guidelines (Supplementary Table 2).
(b) Contribution of treatment-associated signatures and aging signature to the mutational burden of metastatic tumors. Only tumors from patients whose treatment duration is not estimated by clinicians, but rather exactly recorded in charts are included.
(c) Risk of mutations affecting cancer genes (CGC) across tumors contributed by different signatures according to the duration of the exposure of tumors.
(d) Risk of coding-affecting mutations contributed by treatment-associated and aging signatures. Vertical lines intersecting the risk value ranges are placed at the average duration of courses of treatment indicated in clinical guidelines (Supplementary Table 2).
(e, f) Risk of coding-affecting mutations (e) and mutations affecting cancer genes (f) by treatment-associated and aging signatures. Vertical lines intersect the risk value ranges are placed at the average duration of courses of treatment of the subset of patients that were not estimated by clinicians, but rather exactly recorded in charts.
Supplementary Material
Acknowledgments
N.L-B. acknowledges funding from the European Research Council (consolidator grant 682398) and ERDF/Spanish Ministry of Science, Innovation and Universities - Spanish State Research Agency/DamReMap Project (RTI2018-094095-B-I00). IRB Barcelona is a recipient of a Severo Ochoa Centre of Excellence Award from the Spanish Ministry of Economy and Competitiveness (MINECO; Government of Spain) and is supported by CERCA (Generalitat de Catalunya). O.P. is the recipient of a BIST PhD fellowship supported by the Secretariat for Universities and Research of the Ministry of Business and Knowledge of the Government of Catalonia, and the Barcelona Institute of Science and Technology (BIST). A.G-P. is supported by a Ramón y Cajal contract (RYC-2013-14554). We acknowledge Santi Gonzalez for guidance in the analysis of mutations timing and Jordi Deu-Pons for help with the reimplementation of SigProfiler in Julia programming language. This publication and the underlying study have been made possible partly on the basis of the data that Hartwig Medical Foundation has made available to the study. In particular, we want to acknowledge Neeltje Steeghs (NKI-AVL, Amsterdam), Martijn Lolkema (Erasmus MC, Rotterdam), Els Witteveen (UMC Utrecht, Utrecht), Haiko Bloemendal (Meander Medisch Centrum, Amersfoort), Henk Verheul (VUmc, Amsterdam), and Laurens V. Beerepoot (Elisabeth Tweesteden Ziekenhuis, Tilburg, the Netherlands), whose institutions contributed more than 5% of the samples in the adult metastatic dataset used in the analyses. Data from the Childhood Solid Tumor Network has also been used in the paper.
Footnotes
Data and code availability
As part of this work we didn’t generate any original data. We re-used publicly available data described in specific sections of the methods. The metastatic tumor cohort data (DR-024 version 2) is available from the Hartwig Medical Foundation for academic research upon request (https://www.hartwigmedicalfoundation.nl/en). All software produced by the study (including scripts needed to reproduce all results and figures of the paper) are available at https://bitbucket.org/bbglab/mutfootprints. This repository also contains the synthetic datasets generated by us. A separate repository contains our implementation of the SigProfiler method in the Julia Programming Language (https://bitbucket.org/bbglab/sigprofilerjulia).
Author contributions
O.P., A.G.-P. and N.L.-B. designed the project. O.P. carried out the analyses and prepared the figures. F.M. and O.P. conceived, implemented and tested the methodology to analyze the treatment-signature associations and the mutational risk. F.M. carried out the simulation analysis in Supplementary Note 2. O.P., F.M., A.G.-P. and N.L.-B. participated in the design of analyses and in the interpretation of the results. A.G.-P. and N.L.-B. drafted the manuscript. O.P., F.M., A.G.-P. and N.L.-B. edited the manuscript. A.G.-P. and N.L.-B. supervised the project. M.-P. L and N. S. contributed more than 5% of the samples in the adult metastatic dataset used in the analyses and provided feedback.
Competing interests statements
The authors declare no competing interests
References
- 1.Martincorena I, Campbell PJ. Somatic mutation in cancer and normal cells. Science. 2015;349:1483–1489. doi: 10.1126/science.aab4082. [DOI] [PubMed] [Google Scholar]
- 2.Alexandrov LB, et al. Signatures of mutational processes in human cancer. Nature. 2013;500:415–21. doi: 10.1038/nature12477. [DOI] [PMC free article] [PubMed] [Google Scholar]
- 3.Alexandrov L, et al. The Repertoire of Mutational Signatures in Human Cancer. bioRxiv. 2018 doi: 10.1101/322859. 322859. [DOI] [Google Scholar]
- 4.Nik-Zainal S, et al. The genome as a record of environmental exposure. Mutagenesis. 2015;30:763–770. doi: 10.1093/mutage/gev073. [DOI] [PMC free article] [PubMed] [Google Scholar]
- 5.Helleday T, Eshtad S, Nik-Zainal S. Mechanisms underlying mutational signatures in human cancers. Nat Rev Genet. 2014;15:585–598. doi: 10.1038/nrg3729. [DOI] [PMC free article] [PubMed] [Google Scholar]
- 6.Kucab JE, et al. A Compendium of Mutational Signatures of Environmental Agents. Cell. 2019;177:821–836.e16. doi: 10.1016/j.cell.2019.03.001. [DOI] [PMC free article] [PubMed] [Google Scholar]
- 7.Boot A, et al. In-depth characterization of the cisplatin mutational signature in human cell lines and in esophageal and liver tumors. Genome Res. 2018;28:654–665. doi: 10.1101/gr.230219.117. [DOI] [PMC free article] [PubMed] [Google Scholar]
- 8.Kopp LM, Gupta P, Pelayo-Katsanis L, Wittman B, Katsanis E. Late Effects in Adult Survivors of Pediatric Cancer: A Guide for the Primary Care Physician. Am J Med. 2012;125:636–641. doi: 10.1016/j.amjmed.2012.01.013. [DOI] [PubMed] [Google Scholar]
- 9.Iyer NS, Balsamo LM, Bracken MB, Kadan-Lottick NS. Chemotherapy-only treatment effects on long-term neurocognitive functioning in childhood ALL survivors: A review and meta-analysis. Blood. 2015;126:346–353. doi: 10.1182/blood-2015-02-627414. [DOI] [PubMed] [Google Scholar]
- 10.van der Plas E, et al. Neurocognitive Late Effects of Chemotherapy in Survivors of Acute Lymphoblastic Leukemia: Focus on Methotrexate. J Can Acad Child Adolesc Psychiatry. 2015;24:25–32. [PMC free article] [PubMed] [Google Scholar]
- 11.Poon SL, McPherson JR, Tan P, Teh BT, Rozen SG. Mutation signatures of carcinogen exposure: genome-wide detection and new opportunities for cancer prevention. Genome Med. 2014;6:24. doi: 10.1186/gm541. [DOI] [PMC free article] [PubMed] [Google Scholar]
- 12.Liu D, et al. Mutational patterns in chemotherapy resistant muscle-invasive bladder cancer. Nat Commun. 2017;8 doi: 10.1038/s41467-017-02320-7. 2193. [DOI] [PMC free article] [PubMed] [Google Scholar]
- 13.Wang J, et al. Clonal evolution of glioblastoma under therapy. Nat Genet. 2016;48:768–776. doi: 10.1038/ng.3590. [DOI] [PMC free article] [PubMed] [Google Scholar]
- 14.Behjati S, et al. Mutational signatures of ionizing radiation in second malignancies. Nat Commun. 2016;7 doi: 10.1038/ncomms12605. 12605. [DOI] [PMC free article] [PubMed] [Google Scholar]
- 15.Priestley P, et al. Pan-cancer whole genome analyses of metastatic solid tumors. bioRxiv. 2018 doi: 10.1101/415133. 415133. [DOI] [PMC free article] [PubMed] [Google Scholar]
- 16.Kasar S, et al. Whole-genome sequencing reveals activation-induced cytidine deaminase signatures during indolent chronic lymphocytic leukaemia evolution. Nat Commun. 2015;6 doi: 10.1038/ncomms9866. 8866. [DOI] [PMC free article] [PubMed] [Google Scholar]
- 17.Kim J, et al. Somatic ERCC2 mutations are associated with a distinct genomic signature in urothelial tumors. Nat Genet. 2016;48:600–606. doi: 10.1038/ng.3557. [DOI] [PMC free article] [PubMed] [Google Scholar]
- 18.Alexandrov LB, Nik-Zainal S, Wedge DC, Campbell PJ, Stratton MR. Deciphering Signatures of Mutational Processes Operative in Human Cancer. Cell Rep. 2013;3:246–259. doi: 10.1016/j.celrep.2012.12.008. [DOI] [PMC free article] [PubMed] [Google Scholar]
- 19.Lee-Six H, et al. The landscape of somatic mutation in normal colorectal epithelial cells. bioRxiv. 2018 doi: 10.1101/416800. 416800. [DOI] [PubMed] [Google Scholar]
- 20.Alexandrov LB, et al. Clock-like mutational processes in human somatic cells. Nat Genet. 2015;47:1402–1407. doi: 10.1038/ng.3441. [DOI] [PMC free article] [PubMed] [Google Scholar]
- 21.Alexandrov LB, et al. Mutational signatures associated with tobacco smoking in human cancer. Science. 2016;354:618–622. doi: 10.1126/science.aag0299. [DOI] [PMC free article] [PubMed] [Google Scholar]
- 22.Hanawalt PC, Spivak G. Transcription-coupled DNA repair: Two decades of progress and surprises. Nat Rev Mol Cell Biol. 2008;9:958–970. doi: 10.1038/nrm2549. [DOI] [PubMed] [Google Scholar]
- 23.Xu J, et al. Structural basis for the initiation of eukaryotic transcription-coupled DNA repair. Nature. 2017;551:653–657. doi: 10.1038/nature24658. [DOI] [PMC free article] [PubMed] [Google Scholar]
- 24.Szikriszt B, et al. A comprehensive survey of the mutagenic impact of common cancer cytotoxics. Genome Biol. 2016;17:99. doi: 10.1186/s13059-016-0963-7. [DOI] [PMC free article] [PubMed] [Google Scholar]
- 25.Ritt J-F, et al. Gene Amplification and Point Mutations in Pyrimidine Metabolic Genes in 5-Fluorouracil Resistant Leishmania infantum. PLoS Negl Trop Dis. 2013;7:e2564. doi: 10.1371/journal.pntd.0002564. [DOI] [PMC free article] [PubMed] [Google Scholar]
- 26.Wyatt MD, Wilson DM. Participation of DNA repair in the response to 5-fluorouracil. Cell Mol Life Sci CMLS. 2009;66:788–799. doi: 10.1007/s00018-008-8557-5. [DOI] [PMC free article] [PubMed] [Google Scholar]
- 27.Segovia R, Shen Y, Lujan SA, Jones SJM, Stirling PC. Hypermutation signature reveals a slippage and realignment model of translesion synthesis by Rev3 polymerase in cisplatin-treated yeast. Proc Natl Acad Sci. 2017;114:2663–2668. doi: 10.1073/pnas.1618555114. [DOI] [PMC free article] [PubMed] [Google Scholar]
- 28.Tomkova M, Tomek J, Kriaucionis S, Schuster-Böckler B. Mutational signature distribution varies with DNA replication timing and strand asymmetry. Genome Biol. 2018;19:129. doi: 10.1186/s13059-018-1509-y. [DOI] [PMC free article] [PubMed] [Google Scholar]
- 29.Gerstung M, et al. The evolutionary history of 2,658 cancers. bioRxiv. 2017 doi: 10.1101/161562. 161562. [DOI] [Google Scholar]
- 30.Brady SW, et al. The Clonal Evolution of Metastatic Osteosarcoma as Shaped by Cisplatin Treatment. Mol Cancer Res. 2019 doi: 10.1158/1541-7786.MCR-18-0620. molcanres.0620.2018. [DOI] [PMC free article] [PubMed] [Google Scholar]
- 31.Sondka Z, et al. The COSMIC Cancer Gene Census: describing genetic dysfunction across all human cancers. Nat Rev Cancer. 2018;18:696. doi: 10.1038/s41568-018-0060-1. [DOI] [PMC free article] [PubMed] [Google Scholar]
- 32.Zagar TM, Cardinale DM, Marks LB. Breast cancer therapy-associated cardiovascular disease. Nat Rev Clin Oncol. 2016;13:172–184. doi: 10.1038/nrclinonc.2015.171. [DOI] [PubMed] [Google Scholar]
- 33.Stone JB, DeAngelis LM. Cancer-treatment-induced neurotoxicity—focus on newer treatments. Nat Rev Clin Oncol. 2016;13:92–105. doi: 10.1038/nrclinonc.2015.152. [DOI] [PMC free article] [PubMed] [Google Scholar]
- 34.Lipshultz SE, Cochran TR, Franco VI, Miller TL. Treatment-related cardiotoxicity in survivors of childhood cancer. Nat Rev Clin Oncol. 2013;10:697–710. doi: 10.1038/nrclinonc.2013.195. [DOI] [PubMed] [Google Scholar]
- 35.Florea A-M, Büsselberg D. Cisplatin as an Anti-Tumor Drug: Cellular Mechanisms of Activity, Drug Resistance and Induced Side Effects. Cancers. 2011;3:1351–1371. doi: 10.3390/cancers3011351. [DOI] [PMC free article] [PubMed] [Google Scholar]
- 36.Ahles TA, Saykin AJ. Candidate mechanisms for chemotherapy-induced cognitive changes. Nat Rev Cancer. 2007;7:192–201. doi: 10.1038/nrc2073. [DOI] [PMC free article] [PubMed] [Google Scholar]
- 37.Dracham CB, Shankar A, Madan R. Radiation induced secondary malignancies: a review article. Radiat Oncol J. 2018;36:85–94. doi: 10.3857/roj.2018.00290. [DOI] [PMC free article] [PubMed] [Google Scholar]
- 38.Boffetta P, Kaldor JM. Secondary malignancies following cancer chemotherapy. Acta Oncol Stockh Swed. 1994;33:591–598. doi: 10.3109/02841869409121767. [DOI] [PubMed] [Google Scholar]
- 39.Choi DK, Helenowski I, Hijiya N. Secondary malignancies in pediatric cancer survivors: Perspectives and review of the literature. Int J Cancer. 2014;135:1764–1773. doi: 10.1002/ijc.28991. [DOI] [PubMed] [Google Scholar]
- 40.Kent WJ, et al. The human genome browser at UCSC. Genome Res. 2002;12:996–1006. doi: 10.1101/gr.229102. [DOI] [PMC free article] [PubMed] [Google Scholar]
- 41.Rosenthal R, McGranahan N, Herrero J, Taylor BS, Swanton C. DeconstructSigs: delineating mutational processes in single tumors distinguishes DNA repair deficiencies and patterns of carcinoma evolution. Genome Biol. 2016;17:31. doi: 10.1186/s13059-016-0893-4. [DOI] [PMC free article] [PubMed] [Google Scholar]
- 42.Lange SS, Takata K, Wood RD. DNA polymerases and cancer. Nat Rev Cancer. 2011;11:96–110. doi: 10.1038/nrc2998. [DOI] [PMC free article] [PubMed] [Google Scholar]
- 43.Bezanson J, Edelman A, Karpinski S, Shah V. Julia: A Fresh Approach to Numerical Computing. SIAM Rev. 2017;59:65–98. [Google Scholar]
- 44.Haradhvala NJJ, et al. Mutational Strand Asymmetries in Cancer Genomes Reveal Mechanisms of DNA Damage and Repair. Cell. 2016;164:538–549. doi: 10.1016/j.cell.2015.12.050. [DOI] [PMC free article] [PubMed] [Google Scholar]
- 45.Morganella S, et al. The topography of mutational processes in breast cancer genomes. Nat Commun. 2016;7 doi: 10.1038/ncomms11383. 11383. [DOI] [PMC free article] [PubMed] [Google Scholar]
- 46.Pich O, et al. Somatic and Germline Mutation Periodicity Follow the Orientation of the DNA Minor Groove around Nucleosomes. Cell. 2018;175:1074–1087.e18. doi: 10.1016/j.cell.2018.10.004. [DOI] [PubMed] [Google Scholar]
- 47.Langmead B, Salzberg SL. Fast gapped-read alignment with Bowtie 2. Nat Methods. 2012;9:357–359. doi: 10.1038/nmeth.1923. [DOI] [PMC free article] [PubMed] [Google Scholar]
- 48.Li H, et al. The Sequence Alignment/Map format and SAMtools. Bioinformatics. 2009;25:2078–2079. doi: 10.1093/bioinformatics/btp352. [DOI] [PMC free article] [PubMed] [Google Scholar]
Associated Data
This section collects any data citations, data availability statements, or supplementary materials included in this article.


