Correction to: Diabetologia
10.1007/s00125-017-4532-8
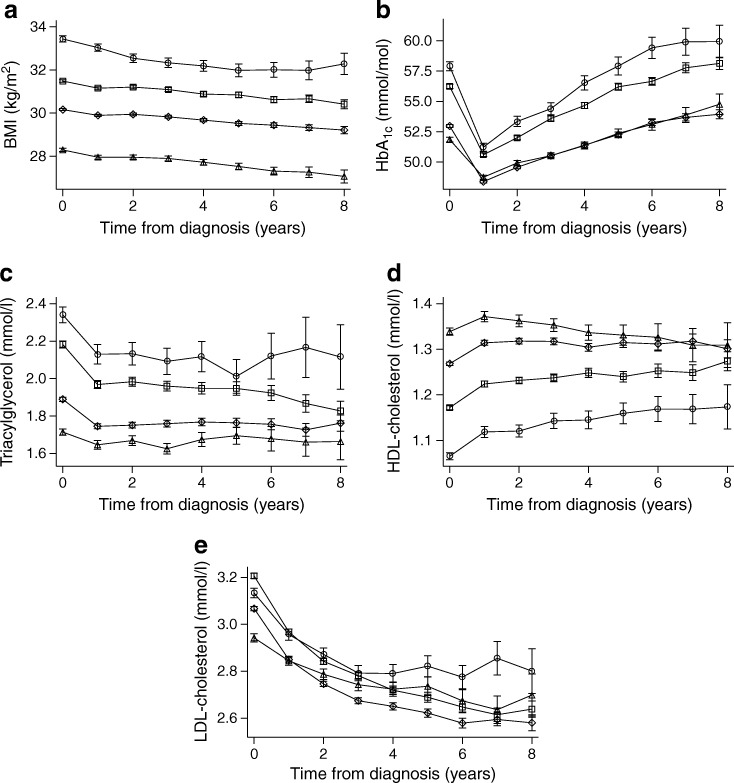
Unfortunately, the symbols in Fig. 1 were incorrectly described in the legend. The corrected figure is given here.
Fig. 1.
Yearly averages (95% CI) stratified by age group for (a) BMI, (b) HbA1c, (c) triacylglycerol, (d) HDL-cholesterol and (e) LDL-cholesterol. Circles, 18–44 years old; squares, 45–59 years old; diamonds, 60–74 years old; triangles, ≥75 years old. All analyses, p < 0.05 where 95% CI do not overlap
Footnotes
The online version of the original article can be found at 10.1007/s00125-017-4532-8
Contributor Information
Soffia Gudbjörnsdottir, Email: soffia.gudbjornsdottir@medic.gu.
Naveed Sattar, Email: naveed.sattar@glasgow.ac.uk.


