Fig. 3.
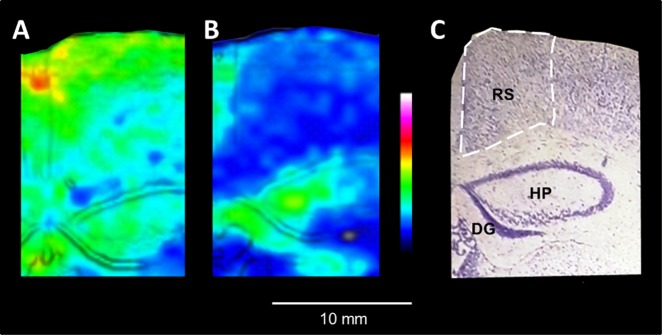
Age-related decrease of ACh concentration in retrosplenial cortex in response to acetylcholinesterase inhibition. a, b MALDI-MSI of ACh distribution in the retrosplenial cortex of 12-w and 14-m tacrine-dosed animals (100 μm lateral resolution, images scaled to 40% of max intensity). The retrosplenial cortex is highlighted by white dashed lines. The MALDI-MS and Nissl stained images are overlaid using the image fusion function implemented in msIQuant software [13] for better delineation of the brain structures. c The tissue section was washed and subjected to Nissl staining; brain structures of interest are annotated. Abbreviations: DG dentate gyrus, HP hippocampal proper, RS retrosplenial cortex

