

Abstract
Several drugs in development for nonalcoholic fatty liver disease (NAFLD) aim to decrease the amount of fat in the liver. We compared quantity and quality of fat in subcutaneous, visceral and muscle compartments, liver fibrosis, and prevalence of metabolic abnormalities between Chinese patients with moderate/severe hepatic steatosis versus those with mild hepatic steatosis. NAFLD patients were prospectively recruited from Peking University People's Hospital in Beijing, China. All patients had baseline body composition measurements using computed tomography and analytic morphomics, clinical evaluation, labs and Fibroscan® controlled attenuation parameter and liver stiffness measurement. Moderate/severe hepatic steatosis was defined as computed tomography liver attenuation of 40 Hounsfield units or less. Calorie intake and physical activity were based on self‐report. A total of 160 NAFLD patients were included (46% men, median age 47 years): 50% had normal body mass index (BMI), 24% were diabetic, and 56% had metabolic syndrome (MS). Fifty‐three (33%) had moderate/severe steatosis, of whom 19 (35.8%) had normal BMI, and the rest had mild steatosis. Patients who had moderate/severe steatosis had significantly higher BMI, waist circumference, aminotransferases, controlled attenuation parameter, liver stiffness measurement, and prevalence of MS compared to those with mild steatosis. They also had larger visceral fat area, subcutaneous fat area, and low density dorsal muscle area. In addition, their calorie intake was higher and time spent on recreation activities was shorter. Conclusion: NAFLD patients with moderate/severe steatosis, including those with normal BMI, had higher prevalence of MS and more fat in visceral, subcutaneous, and muscle compartments than those with mild steatosis. They also had more advanced liver disease. Strategies to decrease hepatic fat may benefit both liver and metabolic diseases.
NAFLD patients with moderate/severe hepatic steatosis had higher prevalence of metabolic syndrome and more fat in visceral, subcutaneous and muscle compartments than those with mild steatosis.
Abbreviations
- ALT
alanine aminotransferase
- AST
aspartate aminotransferase
- BMI
body mass index
- CAP
controlled attenuation parameter
- CI
confidence interval
- CT
computed tomography
- DMGA
dorsal muscle group area
- DMGLDA
dorsal muscle group low density area
- FIB‐4
Fibrosis‐4 markers
- HbA1c
glycosylated hemoglobin
- HOMA‐IR
homeostasis model assessment of insulin resistance
- HU
Hounsfield unit
- IQR
interquartile range
- LFS
liver fat score
- LSM
liver stiffness measurement
- MS
metabolic syndrome
- NAFLD
nonalcoholic fatty liver disease
- NAFLD‐FS
NAFLD fibrosis score
- NASH
nonalcoholic steatohepatitis
- SFA
subcutaneous fat area
- VFA
visceral fat area
- WC
waist circumference
- WHO
World Health Organization
Nonalcoholic fatty liver disease (NAFLD) comprises a spectrum from minimal to severe steatosis, and from steatosis alone to steatohepatitis (NASH), cirrhosis, and hepatocellular carcinoma (HCC). With the improvement of China's economy, there has been a marked increase in the prevalence of NAFLD in China in the last decade. Recent systematic review and meta‐analysis found the prevalence of NAFLD in China was 32.3% (95% confidence interval [CI], 30.2‐34.4) in 2015‐2018,1 with a rapid increase from 25.4% in 2008‐20101 and 18.2%‐20% in 2000–2007.2 The prevalence of NAFLD was 51.6% (95% CI, 47.1‐56.2) in persons with high body mass index (BMI) and 10.8% (95% CI, 9.0‐12.6) in those with normal BMI.1
NAFLD is associated with excess fat deposition not only in the liver, but also in the subcutaneous and visceral compartments. Fat can also be deposited in ectopic areas. Many studies have shown that fat in visceral compartment and ectopic sites—notably muscles—plays a more prominent role in the development of NAFLD and metabolic syndrome (MS)3, 4, 5 as well as cancers6 than fat in the subcutaneous tissues. Studies in Japan and Korea found that visceral fat and intramuscular adipose tissue was associated with hepatic fibrosis and NASH in patients with NAFLD.7, 8, 9
Historically, steatosis alone was considered to be benign and not associated with progressive liver damage, and patients with steatosis alone have life expectancy similar to the normal population.10, 11 Recent studies indicate that patients with steatosis alone may develop steatohepatitis and progressive liver damage.12, 13 Several new drugs in development for NAFLD aim at decreasing the amount of fat in the liver14, 15; however, there are limited data comparing metabolic abnormalities and liver disease between patients with moderate to severe steatosis and those with mild steatosis. There are also very few studies correlating fat in the liver with fat deposition in other body compartments. Therefore, the aims of this study were (1) to measure the quantity and quality of fat in subcutaneous, visceral and muscle compartments in Chinese patients with NAFLD and to correlate fat in these compartments with the degree of hepatic steatosis, and (2) to compare liver damage and the prevalence of metabolic abnormalities between Chinese patients with NAFLD and moderate to severe hepatic steatosis versus those with mild steatosis.
Patients and Methods
Study Subjects
Adult patients aged 18 years or older with NAFLD were prospectively recruited from Peking University People's Hospital in Beijing, China. Diagnosis of NAFLD was based on ultrasound, computed tomography (CT), or magnetic resonance imaging within 24 months or liver biopsy within 36 months of enrollment. Patients with other causes of liver disease such as hepatitis B, hepatitis C, alcohol (> 14 drinks/week for men and >7 drinks/week for women during the past year), and other causes of hepatic steatosis (e.g., medications such as tamoxifen and corticosteroids) were excluded.10, 16 Also excluded were patients who had a history of or plans to undergo bariatric surgery or endoscopic procedures for weight reduction or history of liposuction, patients who were taking medications or supplements for weight reduction, patients who experienced significant weight loss over 5% within 24 months prior to enrollment, patients who had hepatic decompensation or HCC, and women who were pregnant. This pilot study had a planned enrollment of equal number of patients with normal BMI (< 24 kg/m2) and BMI in the obesity range (≥ 28 kg/m2), based on cutoffs recommended for Chinese adults.17 The study was approved by the institutional review boards of Peking University and the University of Michigan.
Potentially eligible patients were identified and approached in the clinic. Patients who agreed to participate were screened after providing written informed consent. During the screening visit, demographics (sex, age, race/ethnicity, occupation, and education levels), anthropometrics (height and weight), medical history, current medications, and alcohol history were recorded. Patients confirmed to meet the eligibility criteria were scheduled to return for a baseline visit after overnight fasting for at least 8 hours. During the baseline visit, family history and obesity history were recorded, and weight, waist circumference (WC), hip circumference, and blood pressure were measured. Truncal obesity was defined as WC of 90 cm or more for males and 85 cm or more for females.17 Blood was collected for glycosylated hemoglobin (HbA1c), insulin, glucose, lipids, blood count, uric acid, liver panel, and hepatitis B surface antigen and hepatitis C antibody if not previously documented to be negative. All patients underwent vibration‐controlled transient elastography (FibroScan®; EchoSens, Paris, France) and an abbreviated noncontrast single‐phase CT that included only the upper abdomen spanning the T11‐L3 vertebra.
Measurements of Hepatic Steatosis and Definition of Moderate/Severe Hepatic Steatosis
Hepatic steatosis was determined by CT, and moderate/severe hepatic steatosis was defined as CT liver attenuation of 40 or fewer Hounsfield units (HU).18, 19, 20 The ratio of liver/spleen HU, FibroScan® controlled attenuation parameter (CAP), and NAFLD liver fat score (LFS) was also examined to assess the degree of hepatic steatosis, and the results were correlated with CT liver attenuation.
Measurements of Liver Fibrosis
Liver fibrosis was assessed by transient elastography, NAFLD fibrosis score (NAFLD‐FS) and Fibrosis‐4 markers (FIB‐4). Liver stiffness measurement (LSM) was performed using FibroScan. All operators had performed at least 100 examinations before this study and were blinded to the clinical data of the participants. An XL probe was used for obese patients. LSM was considered reliable if 10 valid measurements with an interquartile range (IQR)/median ratio of less than 30% and a success rate of over 60% were obtained. A cut‐off value of 10.1 kPa was used to define advanced fibrosis of F3 or higher.21 NAFLD‐FS22 and FIB‐423 were calculated using the previously published formula.
Measurements of Subcutaneous, Visceral, and Intermuscular Fat
All patients underwent a limited noncontrast CT, and body composition was measured using Analytic Morphomics.24, 25, 26, 27, 28 Analytic morphomics is a platform of semi‐automatic image analysis software developed at the University of Michigan. It is able to anatomically index CT scan data so that each measurement is precise and reproducible. Briefly, coded de‐identified Digital Imaging and Communications in Medicine files of all CT scans were loaded into the analytic morphomics server. A semi‐automated high‐throughput methodology with algorithms programmed in MATLAB® (MathWorks Inc., Natick, MA) was used for image processing and analysis. All imaging studies were first anatomically indexed using semi‐automated identification of spinal vertebral levels to allow for accurate and standardized measurements of the same area in each patient. All geometries were saved in a stereolithography format in the analytic morphomics database, with PostgresSQL (https://www.postgresql.org/) subsequently retrieved to calculate geometric (linear distances or cross‐sectional areas) and HU measurements with customized algorithms. Descriptions of all analytic morphomic measurements used for this study can be found in the data dictionary (http://www.med.umich.edu/surgery/morphomics/data_dictionary).
The visceral fat area (VFA) was defined as the total area inside the abdominal fascia, and subcutaneous fat area (SFA) as the total area between the abdominal fascia and skin, meeting fat density thresholds (−205 to −51 HU).26 The dorsal muscle group area (DMGA) was defined as the cross‐sectional area of pixels within a triangle boundary between the spinal canal and the left and right lateral seams, connected by the nearest location to the posterior fascia envelope.28 Fat areas were measured at T12, L1, and L2 and compared.
The morphomic measures considered in this analysis included VFA, SFA, DMGA, and dorsal muscle group low‐density area (DMGLDA), reflecting the intermuscular fat, dorsal muscle group normal density area, visceral fat HU, subcutaneous fat HU, and dorsal muscle group HU. We also determined the ratio of visceral to subcutaneous fat area, visceral and subcutaneous fat areas to BMI, and intermuscular fat to total dorsal muscle group area: DMGLDA to DMGA.
Definition of Metabolic Abnormalities
MS was defined based on the joint interim statement of the International Diabetes Federation Task Force on Epidemiology and Prevention, which required participants to meet three of five criteria: truncal obesity, hypertension, diabetes or hyperglycemia, hypertriglyceridemia, and low value for high density lipoprotein.29 The diagnosis of diabetes mellitus was based on the World Health Organization (WHO) 1999 criteria30 and the Chinese Diabetes Society 2013 guidelines31: fasting plasma glucose of 7.0 mmol/L or higher or HbA1c of 6.5% or higher, previously diagnosed type 2 diabetes, or currently on medications for elevated glucose.
Insulin sensitivity was determined by the homeostasis model assessment of insulin resistance (HOMA‐IR),32 and a cutoff of greater than 2.0 previously used to define a healthy population was used to define insulin resistance.33
Measurements of Diet and Physical Activity
Calorie intake and physical activity were based on self‐report during in‐person and telephone interviews. We collected physical activity data using the Global Physical Activity Questionnaire (GPAQ) developed by WHO.34 It had been tested in large‐scale population‐based surveys and is available in English and Chinese. It collects information on physical activity participation in three domains: activities at work, transport‐related activities (travel to and from places), and recreational activities. WHO recommends that adults do at least 150 minutes of moderate‐intensity physical activity or 75 minutes of vigorous‐intensity physical activity or a combination of moderate‐intensity and vigorous‐intensity physical activity that achieves at least 600 metabolic equivalent–minutes each week. Physical activity data were analyzed based on the GPAQ Analysis Guide.35
Diet was assessed based on food recall and calorie intake estimated using a software based on the Standard Tables of Food Composition in China.36, 37 All food and beverages taken in the previous day were recorded on three occasions: at screening visit, at baseline visit, and during a phone visit between the screening and baseline visit that was selected by the investigators. The 3 days in which information on diet was recorded included 2 weekdays and 1 Saturday or Sunday, with avoidance of major holidays or festivals. Diet information was converted into calories.
Statistical Analyses
Statistical analyses were performed using SPSS version 25 (Chicago, IL). Continuous variables were expressed as median values (IQR), and comparisons made using unpaired Student t test if the variables were normally distributed and Mann‐Whitney U test if the variables were not normally distributed. Categorical data were described as proportions and compared using the chi‐square test. All provided P values represent the results of two‐sided tests, and P values less than 0.05 were considered statistically significant.
Bivariate associations between variables of interest were assessed by Pearson's correlation coefficients and Spearman's correlation coefficients when variables were not normally distributed. Fat and muscle areas at T12, L1, and L2 levels were compared and were highly correlated (r > 0.8); thus, all results presented were assessed at L2 level.
Results
Characteristics of the Patients Studied
From May 2016 to August 2018, 169 NAFLD patients were recruited. Among them, 160 completed CT scans and were included in this analysis. Median age was 46.5 years (IQR 35.3‐58.0), 45.6% were men, and all were Han Chinese. More than half of the patients (68.1%) had some college education, and 58.8% were white‐collar workers. Median BMI was 26.0 kg/m2 (IQR 23.1‐30.4), and 80 (50%) patients had normal BMI. A total of 90 (56.3%) patients had MS, 61 (38.1%) had hyperglycemia, and 70 (43.8%) had hypertension based on medical history, current medications, or laboratory results at the baseline visit (Table 1). Only 5 patients had a liver biopsy, of whom 4 had NASH.
Table 1.
Clinical Characteristics of Chinese NAFLD Patients With Moderate/Severe Versus Mild Hepatic Steatosis
| Characteristics | All | Moderate/Severe Hepatic Steatosis (Liver HU ≤ 40) | Mild Hepatic Steatosis (Liver HU > 40) | P Value |
|---|---|---|---|---|
| N | 160 | 53 | 107 | |
| Male sex | 73 (45.6%) | 26 (49.1%) | 47 (43.9%) | 0.540 |
| Age (years) | 46.5 (35.3, 58) | 46 (33.5, 57.5) | 48 (37, 58) | 0.449 |
| BMI (kg/m2) | 26 (23.1, 30.4) | 29.1 (23.9, 31.5) | 23.8 (22.5, 30.2) | 0.002 |
| Normal BMI | 80 (50%) | 19 (35.8%) | 61 (57%) | 0.012 |
| Waist circumference (cm) | 87 (80, 97) | 93 (83, 102) | 84 (78.5, 94) | 0.001 |
| AST, U/L | 27 (21, 36.8) | 34 (25, 42.5) | 25 (19, 33) | <0.001 |
| ALT, U/L | 33 (22.3, 47.8) | 43 (30.5, 63) | 27 (19, 39) | <0.001 |
| Medical History | ||||
| Diabetes | 22 (13.8%) | 9 (17%) | 13 (12.1%) | 0.404 |
| Hypertension | 36 (22.5%) | 14 (26.4%) | 22 (20.6%) | 0.404 |
| Dyslipidemia | 84 (52.5%) | 35(66%) | 49 (45.8%) | 0.037 |
| Metabolic Abnormalities | ||||
| HbA1c (%) | 5.8 (5.6, 6.3) | 5.9 (5.7, 6.6) | 5.8 (5.6, 6.2) | 0.039 |
| HOMA‐IR | 3.8 (2.6, 5.6) | 5.3 (3.2, 7.9) | 3.3 (2.4, 4.7) | <0.001 |
| HOMA‐IR_non‐DM* | 3.6 (2.5, 5.2) | 4.7 (3.1, 7.1) | 3.2 (2.4, 4.6) | 0.001 |
| Triglyceride (mmol/L) | 2.1 (1.4, 2.6) | 2.3 (1.5, 3.6) | 1.9 (1.4, 2.5) | 0.011 |
| Triglyceride_non‐LIP† (mmol/L) | 2.1 (1.4, 2.6) | 2.2 (1.6, 3.7) | 1.8 (1.4, 2.5) | 0.027 |
| Fasting glucose (mmol/L) | 5.4 (5, 6.1) | 5.6 (5.1, 6.8) | 5.3 (4.9, 5.9) | 0.010 |
| Metabolic Syndrome | 90 (56.3%) | 38 (71.7%) | 52 (48.6%) | 0.006 |
| Truncal obesity | 97 (60.6%) | 38 (71.7%) | 59 (55.1%) | 0.044 |
| Hypertension | 70 (43.8%) | 30 (56.6%) | 40 (37.4%) | 0.021 |
| Hyperglycemia | 61 (38.1%) | 24 (45.3%) | 37 (34.6%) | 0.190 |
| Hypertriglyceridemia | 108 (67.5%) | 42 (79.2%) | 66 (61.7%) | 0.026 |
| Low HDL | 94 (58.8%) | 32 (60.4%) | 62 (57.9%) | 0.769 |
| Hepatic Steatosis | ||||
| CT scan | ||||
| Liver HU | 47.3 (36.4, 54.4) | 30.4 (23.8, 36.5) | 51.3 (47, 57) | <0.001 |
| Liver/spleen HU ratio | 0.98 (0.78, 1.13) | 0.63 (0.5, 0.79) | 1.08 (0.98, 1.18) | <0.001 |
| FibroScan CAP (dB/m) | 297.5 (250.5, 332.8) | 334 (311.5, 367.5) | 272 (235, 310) | <0.001 |
| LFS | 0.7 (−0.9, 2.3) | 2.3 (0.4, 3.8) | 0.2 (−1.1, 1.5) | <0.001 |
| Hepatic Fibrosis | ||||
| FibroScan LSM (kPa) | 4.5 (3.7, 5.3) | 4.8 (4, 5.7) | 4.4 (3.6, 5.2) | 0.036 |
| NAFLD‐FS | (−2.5) (−3.4, −1.5) | (−2.7) (−3.4, −1.6) | (−2.4) (−3.4, −1.4) | 0.513 |
| FIB‐4 | 0.9 (0.7, 1.3) | 0.9 (0.6, 1.2) | 1.0 (0.7, 1.4) | 0.245 |
Data are expressed as median (IQR) or n (%). Bold values have P Values <0.05.
Non‐DM: Patients who were not on diabetic medication.
Non_LIP: Patients who were not on lipid‐lowering medications.
Abbreviations: DM, diabetes mellitus; HDL, high density lipoprotein; LIP, lipid‐lowering medications.
Hepatic Steatosis and Liver Fibrosis
Fifty‐three patients (33.1%) had moderate/severe hepatic steatosis (liver HU ≤ 40), including 19 (35.8%) with normal BMI, and 107 patients (66.9%) had mild hepatic steatosis, including 61 (57%) with normal BMI. Compared to patients with mild hepatic steatosis, patients with moderate/severe hepatic steatosis had higher CAP and LFS, and lower liver/spleen HU ratio (P < 0.001) (Table 1). There was a strong negative correlation between liver HU and CAP (Fig. 1, r = −0.663, P < 0.001).
Figure 1.
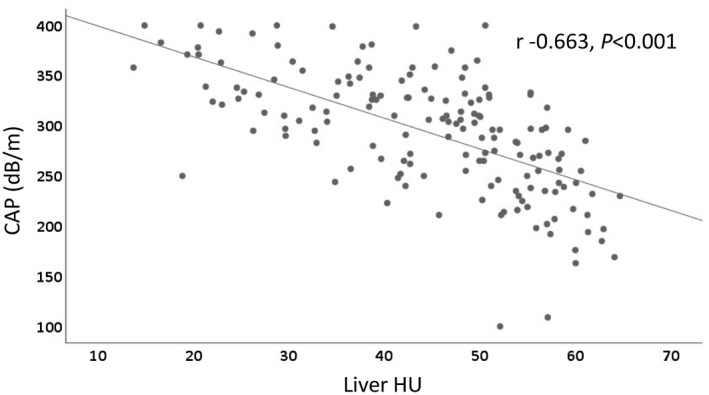
Correlation between hepatic steatosis measured by liver HU on CT scan and CAP on FibroScan. Scatter plot shows a strong negative correlation between liver HU and CAP in Chinese patients with NAFLD (r = −0.663, P < 0.001).
Patients with moderate/severe hepatic steatosis had higher BMI and WC (Table 1 and Fig. 2A), and liver HU showed a weak negative correlation with BMI (r = −0.362, P < 0.001) and a moderate negative correlation with WC (r = −0.411, P < 0.001) (Fig. 2B).
Figure 2.
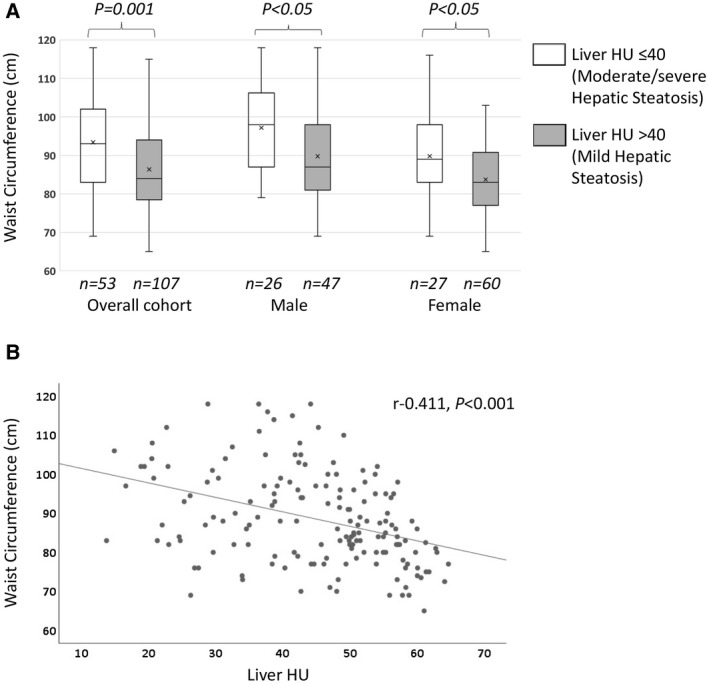
Waist circumference and hepatic steatosis. (A) Box plot shows WC in patients with moderate/severe steatosis versus mild hepatic steatosis. Overall cohort: 93 (83‐102) versus 84 (78.5‐94.0) cm (P = 0.001); male: 98 (87.0‐106.3) versus 87 (81‐98) cm (P < 0.05); female: 89 (83‐98) versus 83 (77‐90.8) cm (P < 0.05). Boxes show 25th and 75th percentiles; horizontal line shows median; and cross (x) shows mean value. (B) Scatter plot shows a moderate negative correlation between hepatic steatosis measured by liver HU on CT scan and WC in Chinese patients with NAFLD (r = −0.411, P < 0.001).
Patients with moderate/severe hepatic steatosis had more liver damage, as reflected by higher aspartate aminotransferase (AST) and alanine aminotransferase (ALT) levels, as well as higher LSM (4.8 kPa vs. 4.4 kPa) than those with mild steatosis, but there were no significant differences in NAFLD‐FS or FIB‐4 scores between the two groups (Table 1).
Correlation Between Hepatic Steatosis and Fat in Visceral, Subcutaneous, and Muscle Compartments
Hepatic steatosis measured by liver HU showed a moderate correlation with fat in visceral compartment, and a weak correlation with fat in subcutaneous and muscle compartments (Fig. 3A‐C). Compared to patients with mild hepatic steatosis, patients who had moderate/severe hepatic steatosis had larger VFA and SFA (Fig. 4A,B), but after adjustment for BMI, only the ratio of VFA to BMI, but not SFA to BMI, was significantly higher. Patients with moderate/severe hepatic steatosis also had a higher ratio of VFA to SFA than those with mild steatosis, but this difference was not significant. Given the possible negative consequences associated with visceral fat density,38 we also examined this and found that patients with moderate/severe hepatic steatosis had lower visceral fat density (visceral fat HU) than those with mild steatosis, but there was no difference in subcutaneous fat density (Table 2). Patients who had moderate/severe hepatic steatosis also had bigger DMGA and DMGLDA but there were no differences in density of dorsal muscles (DMG HU) or the relative amount of low‐density muscle as compared with total muscle (DMGLDA to DMGA) (Fig. 4C and Table 2).
Figure 3.
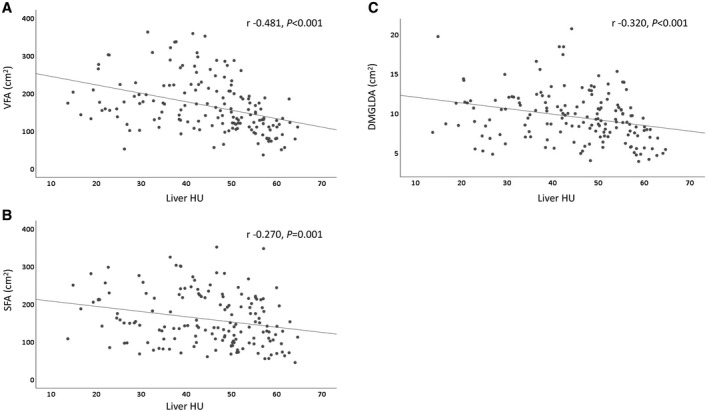
Scatter plots show correlation between hepatic steatosis measured by liver HU and VFA (A), SFA (B), and DMGLDA (C) on CT scan.
Figure 4.
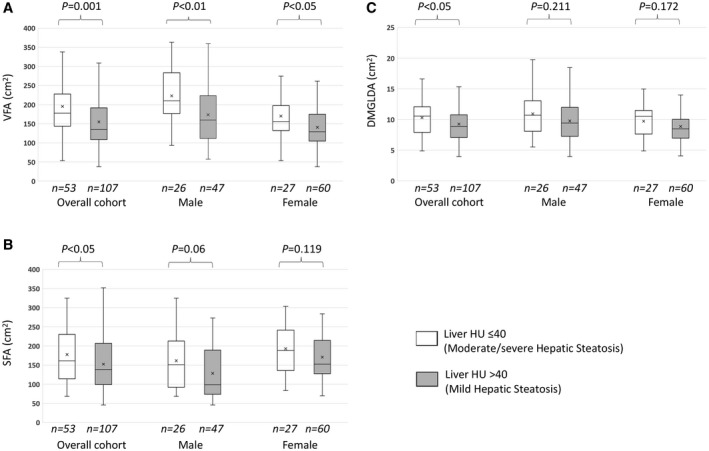
Box plots show VFA (A), SFA (B), and DMGLDA (C) in patients with moderate/severe versus mild hepatic steatosis, overall and separately for men and women. (A) Median (IQR) areas (cm2) of VFA in patients with moderate/severe versus mild hepatic steatosis. Overall cohort: 177.6 (143.5‐227.9) versus 134.8 (108.4‐191.8) (P < 0.001); male: 209.9 (176.7‐283.4) versus 159.8 (111.9‐223.4) (P < 0.01); female: 155.6 (132.1‐197.4) versus 129.3 (104.7‐174.8) (P < 0.05). (B) SFA in patients with moderate/severe versus mild hepatic steatosis. Overall cohort: 161.4 (114.3‐230.0) versus 138.6 (98.9‐207.2) (P < 0.05); male: 150.7 (92.1‐212.7) versus 98.9 (73.6‐189.2) (P = 0.06); female: 188.2 (135.8‐241.5) versus 152.7 (127.5‐214.7) (P = 0.119). (C) DMGLDA in patients with moderate/severe versus mild hepatic steatosis. Overall cohort: 10.5 (7.9‐12.1) versus 8.9 (7.1‐10.8) (P < 0.05); male: 10.7 (8.1‐13.1) versus 9.4 (7.3‐12) (P = 0.211); female: 10.5 (7.6‐11.5) versus 8.48 (6.9‐10) (P = 0.172). Boxes show 25th and 75th percentiles; horizontal line shows median; and cross (x) shows mean value.
Table 2.
Visceral, Subcutaneous, and Muscle Fat Measurements in Chinese NAFLD Patients With Moderate/Severe Versus Mild Hepatic Steatosis
| Characteristics | All | Moderate/Severe Hepatic Steatosis (Liver HU ≤ 40) | Mild Hepatic Steatosis (Liver HU > 40) | P Value |
|---|---|---|---|---|
| VFA (cm2) | 155.4 (117.9, 207.7) | 177.6 (143.5, 227.9) | 134.8 (108.44, 191.8) | <0.001 |
| Visceral fat HU | (−107) (−109, −105) | (−109) (−110.8, −106) | (−107) (−109, −104) | <0.001 |
| SFA (cm2) | 143.9 (103.7, 216.1) | 161.4 (114.3, 230) | 138.6 (98.9, 207.2) | 0.035 |
| Subcutaneous fat HU | (−112) (−114, −109) | (−112) (−114, −108) | (−112) (−114, −109) | 0.807 |
| VFA‐to‐BMI ratio | 5.9 (4.6, 7.7) | 6.7 (5.4, 8) | 5.5 (4.3, 7.4) | 0.003 |
| SFA‐to‐BMI ratio | 5.8 (4.3, 7.4) | 6.1 (4.6, 7.6) | 5.5(4.1, 7.3) | 0.186 |
| VFA‐to‐SFA ratio | 1.0 (0.8, 1.4) | 1.2 (0.8, 1.5) | 1.0 (0.8, 1.4) | 0.258 |
| DMGA (cm2) | 47.0 (37.2, 56) | 50.2 (40.2, 61.2) | 44.4 (35.7, 53.8) | 0.010 |
| DMGLDA (cm2) | 9.3 (7.3, 11.4) | 10.5 (7.9, 12.1) | 8.9 (7.1, 10.8) | 0.025 |
| Dorsal muscle group HU | 48.2 (42.1, 52.3) | 47.2 (42.1, 51.5) | 48.6 (42.16, 52.7) | 0.615 |
| DMGLDA‐to‐DMGA ratio | 0.2 (0.17, 0.25) | 0.21 (0.17, 0.24) | 0.2 (0.17, 0.25) | 0.945 |
Data are expressed as median (IQR). Bold values have P Values <0.05.
Correlations Between Hepatic Steatosis and Metabolic Abnormalities
Patients with moderate/severe hepatic steatosis had a higher prevalence of dyslipidemia by medical history and MS than those with mild steatosis (Table 1). They also had higher levels of HbA1c, HOMA‐IR, triglyceride, and fasting plasma glucose, but there were no differences in prevalence of diabetes.
Diet and Physical Activity
Median total calorie intake per day was 1,527 kcal (IQR 1,237‐1,911) and was significantly higher in patients with moderate/severe hepatic steatosis (1,633 kcal vs. 1,456 kcal) than those with mild steatosis (Table 3). Patients with moderate/severe hepatic steatosis had higher intake of carbohydrate, fat, as well as protein.
Table 3.
Diet and Physical Activities in Chinese NAFLD Patients With Moderate/Severe Versus Mild Hepatic Steatosis
| Characteristics | All | Moderate/Severe Hepatic Steatosis (Liver HU ≤ 40) | Mild Hepatic Steatosis (Liver HU > 40) | P Value |
|---|---|---|---|---|
| Diet | ||||
| Total calorie intake (kcal/day) | 1,527 (1237, 1911) | 1,633 (1332, 2164) | 1,456 (1178, 1797) | 0.003 |
| Total carbohydrate intake (g/day) | 210.2 (163, 262.4) | 232.7 (181.1, 296.1) | 196.5 (152.9, 256.5) | 0.016 |
| Total fat intake (g/day) | 49.5 (39.4, 67.2) | 59.5 (42.2, 79.3) | 45.2 (36.4, 63) | 0.001 |
| Total protein intake (g/day) | 59.3 (48.4, 75.8) | 64.6 (51.7, 81.7) | 56.4 (43.9, 72.2) | 0.037 |
| Exercise | ||||
| N | 160 | 53 | 107 | |
| Engaged in moderate work activity | 17 (10.6%) | 8 (15.1%) | 9 (8.4%) | 0.197 |
| Total moderate work activity (minutes/week)* | 300 (225, 870) | 780 (240, 1035) | 300 (157.5, 570) | 0.321 |
| Engaged in transport activity | 110 (68.8%) | 37 (69.8%) | 73 (6.2%) | 0.838 |
| Total transport activity (minutes/week)† | 170 (100, 300) | 150 (100, 280) | 210 (95, 300) | 0.585 |
| Engaged in recreational activity | 70 (43.8%) | 15 (28.3%) | 55 (51.4%) | 0.006 |
| Total recreational activity (minutes/week)† | 180 (90, 285) | 180 (120, 240) | 180 (90, 300) | 0.714 |
| Sum of all activity (minutes/week)† | 210 (60, 442.5) | 160 (67.5, 405) | 270 (60, 480) | 0.260 |
| Total physical activity meeting WHO recommendations† | 98 (61.3%) | 30 (56.6%) | 68 (63.6%) | 0.396 |
Data are expressed as median (IQR) or n (%). Bold values have P Values <0.05.
Only including participants who responded “yes” to that domain.
Including all participants (n = 160). Bold values have P Values <0.05.
Slightly more than half (61.3%) of the participants met WHO recommendations for physical activity, with no difference between patients with moderate/severe and those with mild steatosis (Table 3).
Median sum of all physical activity was 210 minutes per week, with no difference between patients with moderate/severe versus mild steatosis, but most activities were related to transport. Less than half (43.8%) of the patients participated in any recreation‐related activities, with a higher percentage among those with mild versus moderate/severe hepatic steatosis (51.4% vs. 28.3%).
Patients With Normal Versus Abnormal BMI
Nineteen patients with normal BMI had moderate/severe hepatic steatosis. Their median age was 48 years (IQR 32‐63) and 42% were males. Compared to patients with moderate/severe steatosis and abnormal BMI, patients with moderate/severe steatosis and normal BMI had significantly smaller WC, lower HOMA‐IR, CAP (319 dB/m vs. 356.5 dB/m), and LFS (0.7 vs. 2.6) (P < 0.005), but there were no significant differences in LSM, NAFLD‐FS and FIB‐4, or AST and ALT levels (Supporting Table S1). Patients with moderate/severe hepatic steatosis and normal BMI also had smaller VFA, SFA, DMGA and DMGLDA (Supporting Table S2), and lower median total calorie intake per day (1,396 kcal vs. 1,970 kcal) than those with moderate/severe steatosis and abnormal BMI. Although there were no differences in total physical activity, a higher proportion of patients with moderate/severe steatosis and normal BMI participated in recreational activity (47.4% vs. 17.6%) than those with abnormal BMI (Supporting Table S3).
Ectopic Fat and Liver Fibrosis and Metabolic Syndrome
Liver fibrosis assessed by NAFLD‐FS had weak positive correlations with VFA (r = 0.223, P = 0.005), and with DMGLDA (r = 0.268, P = 0.001) and a strong negative correlation with DMGHU (r = −0.598, P < 0.001). However, such correlations were not observed when liver fibrosis was assessed by LSM. We explored the correlation of the individual components of the NAFLD‐FS and VFA, VF HU, DMGLDA, and DMG HU. VFA and DMGLDA correlated best with BMI (r = 0.67, P < 0.001; and r = 0.739, P < 0.001) and AST/ALT ratio (r = −0.341, P < 0.001; and r = −0.201, P = 0.011). VF HU did not correlate with any of the NAFLD‐FS components. DMG HU correlated with all of the individual components except for platelet and was significantly higher in those without compared to those with impaired fasting glycemia/diabetes (P < 0.001).
Ninety patients met the criteria for MS. Compared with patients who did not meet the criteria for MS, those who had MS had more marked hepatic steatosis with median liver HU (42.6 vs. 51.3) (P < 0.001). They also had larger VFA (181.1 cm2 vs. 121.9 cm2), SFA (165.8 cm2 vs. 119.8 cm2 ), as well as DMGLDA (10.4 cm2 vs. 7.8 cm2) (P < 0.001).
Discussion
In this study, we applied analytic morphomics to study fat deposition in visceral, subcutaneous, and muscle compartments in 160 Chinese patients with NAFLD. We found that hepatic steatosis measured by CT scan HU correlated well with FibroScan CAP measurement and LFS. We also demonstrated that patients with moderate/severe hepatic steatosis had larger areas of fat in visceral, subcutaneous, and muscle compartments than those with mild hepatic steatosis. This was true in both patients with normal and those with abnormal BMI, and in men as well as women. Furthermore, we found that patients with moderate/severe steatosis had higher AST, ALT, and FibroScan LSM. As expected, patients with moderate/severe steatosis had higher BMI, WC, and prevalence of MS.
Various methods have been used to measure the quantity and quality of fat in liver, viscera, subcutaneous, and other body compartments. Although dual‐energy X‐Ray absorptiometry scans can provide information on total body composition, such as relative amounts of muscle, bone and fat, the measurements for subcutaneous fat versus visceral fat are extrapolated.39 Cross‐sectional imaging such as CT scan remain the gold standard and provide a convenient method to directly measure visceral versus subcutaneous fat. In combination with spatial measurements, CT scans can quantify not only visceral and subcutaneous fat but also fat in liver and muscle,26 and can also provide information on the quality of fat, which has been shown to have a stronger correlation with insulin resistance than subcutaneous or total body fat. Both magnetic resonance imaging and magnetic resonance spectroscopy provide robust measures of quantity as well as quality of adipose tissue depots, including liver and ectopic sites,40 but they are expensive and not widely available. In this study, we used CT scan and analytic morphomics, which allow us to provide precise and detailed measurements of fat in liver, visceral, subcutaneous, and other body compartments such as muscles. We have previously shown that analytic morphomics measurements are accurate predictors of new‐onset diabetes and survival after liver transplantation,24, 27 and provide important information about clinical outcomes in patients with liver disease.25, 41, 42, 43
Several studies have shown that ectopic fat deposition in the liver, skeletal muscle, and heart is a key determinant of insulin resistance. Adipose tissue is not only a site for storage of lipids, but it also secretes various hormones and cytokines involved in regulating glucose and lipid metabolism and energy homeostasis. Studies using biopsies or magnetic resonance spectroscopy have implicated ectopic lipid accumulation in the pathogenesis of insulin resistance in muscle and liver and a role of muscle‐specific insulin resistance in promoting NAFLD.44 In healthy, young, lean persons, insulin resistance in skeletal muscle leads to diversion of ingested carbohydrate from muscle glycogen synthesis to the liver. This process, in combination with compensatory hyperinsulinemia, leads to increased hepatic de novo lipogenesis and increased hepatic triglyceride.45
Studies in Japan and Korea also found a correlation between VFA measured by CT scans and the degree of fibrosis in patients with NAFLD. In a retrospective study of 324 NAFLD patients and 132 controls with no NAFLD in Korea, patients with NAFLD had higher gender‐adjusted VFA than controls, and multivariate regression analysis demonstrated that VFA was independently associated with significant fibrosis (F2‐F4) or NASH.9 Another study in 63 Japanese patients with biopsy‐proven NASH found that visceral fat volume measured by CT scans was greater in patients with advanced fibrosis versus those with mild fibrosis, but there was no correlation with the grade of steatohepatitis.7 In our study, only 5 patients had liver biopsies; thus, it was not possible to examine the association between VFA and grade of steatohepatitis or histological fibrosis stage. We did find a weak correlation between VFA and NAFLD‐FS, but no correlation with LSM. The reasons for the discordant result are unclear but likely related to the high proportion of patients with low LSM. Another reason might be that VFA correlated better with metabolic than liver components of NAFLD‐FS. Indeed, we found that VFA was significantly correlated with BMI and AST‐to‐ALT ratio, but not with platelet or albumin.
Fat in muscles had also been shown to be associated with NASH and hepatic fibrosis. One study in Japan found that patients with NASH had higher adipose tissue content in muscles as measured by CT scan than those with steatosis alone, and among those with NASH, intramuscular fat content was higher in those with stage 3 or 4 fibrosis than those with stage 1 or 2 fibrosis.8 In our study, fat in muscles correlated with NAFLD‐FS and FIB‐4. Very few studies have examined the correlation between fat in different body compartments and between ectopic fat and fat in liver. In one study of 105 middle‐age Japanese men with MS, VFA measured by CT scan correlated with CT HU of muscles and liver, but there were no correlations between CT HU of liver and CT HU of skeletal muscles.4 In our study, we found a significant correlation between VFA and fat in liver and muscles.
We found that while moderate/severe hepatic steatosis was more common in patients with abnormal BMI, 24% of patients with NAFLD and normal BMI also had moderate/severe hepatic steatosis. Compared to patients with normal BMI and mild steatosis, those with normal BMI and moderate/severe hepatic steatosis had larger VFA and also lower VFA HU in addition to higher BMI and higher prevalence of MS. Our findings highlight the importance of visceral fat in the pathogenesis of MS and NAFLD, particularly in patients with normal BMI. Many studies have shown that Asians with normal BMI are more prone to develop diabetes, MS, and NAFLD than other races.46, 47, 48 The exact reasons are unclear, although a higher prevalence of PNPLA3 I148M variant among Asians may contribute to increased risk of NAFLD, including those with normal BMI.47, 49
As expected, we found that patients with moderate/severe hepatic steatosis had higher calorie intake than those with mild steatosis. We were surprised by the lack of physical activity, particularly recreational activity, not only among patients with moderate/severe steatosis but also those with mild steatosis. Although these data are limited by accuracy of self‐reporting, much effort is needed to promote recreational activity as China becomes more industrialized, with the shift from farming and blue collar jobs to sedentary white collar jobs and from moving around by cycling to buses, subway trains, and private cars.
The strengths of our study include a prospective design with detailed data on body composition, diet, and physical activity, but it also has some limitations. First, only 160 NAFLD patients were studied, which diminished the generalizability of our results. Second, histology was lacking in most patients. Third, diagnosis of NAFLD was based on historical imaging or histological results, and some patients may not have hepatic steatosis at the time of this study. We did exclude patients who had more than 5% weight loss during the interval between the qualifying test and enrollment into this study. Furthermore, 77% of patients had a FibroScan CAP score greater than 250 at enrollment. Fourth, we relied on self‐reporting for diet and physical activity, and the responses may not be accurate or complete.
In conclusion, we found that NAFLD patients with moderate/severe steatosis had more visceral and subcutaneous fat as well as more fat infiltration in muscle. They also had more liver damage and a higher prevalence of metabolic syndrome. These findings applied not only to patients with abnormal but also those with normal BMI. Our data support the benefits of reducing hepatic steatosis either through lifestyle interventions or medications. Our findings suggest major efforts are needed to promote physical activity in China to curb the growing epidemic of obesity, diabetes, and NAFLD.
Supporting information
Acknowledgment
The authors thank Brian Ross and Brian Derstine (Morphomics Analysis Group, Department of Surgery, University of Michigan) for their assistance with processing the analytic morphomics data, Elizabeth Wu (Division of Gastroenterology and Hepatology, University of Michigan) for her assistance with editing the protocol and manual of operations, Ran Fei (Peking University People's Hospital) for her assistance with processing the specimens, and Chao Sun, Anqi Li, and Xinyu Zhang (Peking University People's Hospital) for the assistance with uploading CT scans and quality assurance of CT images.
Supported by the Michigan Medicine–Peking University Health Sciences Center (PKUHSC) Joint Institute for Translational and Clinical Research (BMU20160543) and the Thomas HC Cheung Foundation (to W.Z.).
Potential conflict of interest: Dr. Lok received grants from and advises Gilead and Target. She received grants from BMS.
References
Author names in bold designate shared co‐first authorship.
- 1. Zhou F, Zhou J, Wang W, Zhang XJ, Ji YX, Zhang P, et al. Unexpected rapid increase in the burden of nonalcoholic fatty liver disease in China from 2008 to 2018: a systematic review and meta‐analysis. Hepatology 2019. [Epub ahead of print] [DOI] [PubMed] [Google Scholar]
- 2. Li Z, Xue J, Chen P, Chen L, Yan S, Liu L. Prevalence of nonalcoholic fatty liver disease in mainland of China: a meta‐analysis of published studies. J Gastroenterol Hepatol 2014;29:42‐51. [DOI] [PubMed] [Google Scholar]
- 3. Lee J, Chung DS, Kang JH, Yu BY. Comparison of visceral fat and liver fat as risk factors of metabolic syndrome. J Korean Med Sci 2012;27:184‐189. [DOI] [PMC free article] [PubMed] [Google Scholar]
- 4. Taira S, Shimabukuro M, Higa M, Yabiku K, Kozuka C, Ueda R, et al. Lipid deposition in various sites of the skeletal muscles and liver exhibits a positive correlation with visceral fat accumulation in middle‐aged Japanese men with metabolic syndrome. Intern Med 2013;52:1561‐1571. [DOI] [PubMed] [Google Scholar]
- 5. Addison O, Marcus RL, Lastayo PC, Ryan AS. Intermuscular fat: a review of the consequences and causes. Int J Endocrinol 2014;2014:309570. [DOI] [PMC free article] [PubMed] [Google Scholar]
- 6. Montano‐Loza AJ, Mazurak VC, Ebadi M, Meza‐Junco J, Sawyer MB, Baracos VE, et al. Visceral adiposity increases risk for hepatocellular carcinoma in male patients with cirrhosis and recurrence after liver transplant. Hepatology 2018;67:914‐923. [DOI] [PubMed] [Google Scholar]
- 7. Eguchi Y, Mizuta T, Sumida Y, Ishibashi E, Kitajima Y, Isoda H, et al. The pathological role of visceral fat accumulation in steatosis, inflammation, and progression of nonalcoholic fatty liver disease. J Gastroenterol 2011;46(Suppl 1):70‐78. [DOI] [PubMed] [Google Scholar]
- 8. Kitajima Y, Hyogo H, Sumida Y, Eguchi Y, Ono N, Kuwashiro T, et al. Severity of non‐alcoholic steatohepatitis is associated with substitution of adipose tissue in skeletal muscle. J Gastroenterol Hepatol 2013;28:1507‐1514. [DOI] [PubMed] [Google Scholar]
- 9. Yu SJ, Kim W, Kim D, Yoon JH, Lee K, Kim JH, et al. Visceral obesity predicts significant fibrosis in patients with nonalcoholic fatty liver disease. Medicine (Baltimore) 2015;94:e2159. [DOI] [PMC free article] [PubMed] [Google Scholar]
- 10. Chalasani N, Younossi Z, Lavine JE, Diehl AM, Brunt EM, Cusi K, et al. The diagnosis and management of non‐alcoholic fatty liver disease: practice guideline by the American Association for the Study of Liver Diseases, American College of Gastroenterology, and the American Gastroenterological Association. Hepatology 2012;55:2005‐2023. [DOI] [PubMed] [Google Scholar]
- 11. Teli MR, James OF, Burt AD, Bennett MK, Day CP. The natural history of nonalcoholic fatty liver: a follow‐up study. Hepatology 1995;22:1714‐1719. [PubMed] [Google Scholar]
- 12. Wong VW, Wong GL, Choi PC, Chan AW, Li MK, Chan HY, et al. Disease progression of non‐alcoholic fatty liver disease: a prospective study with paired liver biopsies at 3 years. Gut 2010;59:969‐974. [DOI] [PubMed] [Google Scholar]
- 13. Younossi ZM, Stepanova M, Rafiq N, Makhlouf H, Younoszai Z, Agrawal R, Goodman Z. Pathologic criteria for nonalcoholic steatohepatitis: interprotocol agreement and ability to predict liver‐related mortality. Hepatology 2011;53:1874‐1882. [DOI] [PubMed] [Google Scholar]
- 14. Golabi P, Bush H, Younossi ZM. Treatment strategies for nonalcoholic fatty liver disease and nonalcoholic steatohepatitis. Clin Liver Dis 2017;21:739‐753. [DOI] [PubMed] [Google Scholar]
- 15. Sayiner M, Lam B, Golabi P, Younossi ZM. Advances and challenges in the management of advanced fibrosis in nonalcoholic steatohepatitis. Therap Adv Gastroenterol 2018;11:1756284818811508. [DOI] [PMC free article] [PubMed] [Google Scholar]
- 16. Gao X, Fan JG. Diagnosis and management of non‐alcoholic fatty liver disease and related metabolic disorders: consensus statement from the Study Group of Liver and Metabolism. Chinese Society of Endocrinology. J Diabetes 2013;5:406‐415. [DOI] [PMC free article] [PubMed] [Google Scholar]
- 17. The National Health Commission of the People' Republic of China . Criteria of weight for adults (WS/T 428–2013). http://www.nhc.gov.cn/wjw/yingyang/201308/a233d450fdbc47c5ad4f08b7e394d1e8.shtml. Accessed Feb 25, 2015. [Google Scholar]
- 18. Kodama Y, Ng CS, Wu TT, Ayers GD, Curley SA, Abdalla EK, et al. Comparison of CT methods for determining the fat content of the liver. AJR Am J Roentgenol 2007;188:1307‐1312. [DOI] [PubMed] [Google Scholar]
- 19. Boyce CJ, Pickhardt PJ, Kim DH, Taylor AJ, Winter TC, Bruce RJ, et al. Hepatic steatosis (fatty liver disease) in asymptomatic adults identified by unenhanced low‐dose CT. AJR Am J Roentgenol 2010;194:623‐628. [DOI] [PubMed] [Google Scholar]
- 20. Pickhardt PJ, Park SH, Hahn L, Lee SG, Bae KT, Yu ES. Specificity of unenhanced CT for non‐invasive diagnosis of hepatic steatosis: implications for the investigation of the natural history of incidental steatosis. Eur Radiol 2012;22:1075‐1082. [DOI] [PubMed] [Google Scholar]
- 21. Petta S, Wong VW, Camma C, Hiriart JB, Wong GL, Marra F, et al. Improved noninvasive prediction of liver fibrosis by liver stiffness measurement in patients with nonalcoholic fatty liver disease accounting for controlled attenuation parameter values. Hepatology 2017;65:1145‐1155. [DOI] [PubMed] [Google Scholar]
- 22. Angulo P, Hui JM, Marchesini G, Bugianesi E, George J, Farrell GC, et al. The NAFLD fibrosis score: a noninvasive system that identifies liver fibrosis in patients with NAFLD. Hepatology 2007;45:846‐854. [DOI] [PubMed] [Google Scholar]
- 23. Vallet‐Pichard A, Mallet V, Nalpas B, Verkarre V, Nalpas A, Dhalluin‐Venier V, et al. FIB‐4: an inexpensive and accurate marker of fibrosis in HCV infection. comparison with liver biopsy and fibrotest. Hepatology 2007;46:32‐36. [DOI] [PubMed] [Google Scholar]
- 24. Vaughn VM, Cron DC, Terjimanian MN, Gala ZS, Wang SC, Su GL, et al. Analytic morphomics identifies predictors of new‐onset diabetes after liver transplantation. Clin Transplant 2015;29:458‐464. [DOI] [PubMed] [Google Scholar]
- 25. Krishnamurthy V, Zhang P, Ethiraj S, Enchakalody B, Waljee AK, Wang L, et al. Use of analytic morphomics of liver, spleen, and body composition to identify patients at risk for cirrhosis. Clin Gastroenterol Hepatol 2015;13:360‐368.e365. [DOI] [PMC free article] [PubMed] [Google Scholar]
- 26. Zhang P, Peterson M, Su GL, Wang SC. Visceral adiposity is negatively associated with bone density and muscle attenuation. Am J Clin Nutr 2015;101:337‐343. [DOI] [PMC free article] [PubMed] [Google Scholar]
- 27. Terjimanian MN, Harbaugh CM, Hussain A, Olugbade KO Jr., Waits SA, Wang SC, et al. Abdominal adiposity, body composition and survival after liver transplantation. Clin Transplant 2016;30:289‐294. [DOI] [PMC free article] [PubMed] [Google Scholar]
- 28. Derstine BA, Holcombe SA, Goulson RL, Ross BE, Wang NC, Sullivan JA, et al. Quantifying sarcopenia reference values using lumbar and thoracic muscle areas in a healthy population. J Nutr Health Aging 2017;21:180‐185. [DOI] [PubMed] [Google Scholar]
- 29. Alberti KG, Eckel RH, Grundy SM, Zimmet PZ, Cleeman JI, Donato KA, et al. Harmonizing the metabolic syndrome: a joint interim statement of the International Diabetes Federation Task Force on Epidemiology and Prevention; National Heart, Lung, and Blood Institute; American Heart Association; World Heart Federation; International Atherosclerosis Society; and International Association for the Study of Obesity. Circulation 2009;120:1640‐1645. [DOI] [PubMed] [Google Scholar]
- 30. Alberti KG, Definition Zimmet PZ. diagnosis and classification of diabetes mellitus and its complications. Part 1: Diagnosis and classification of diabetes mellitus provisional report of a WHO consultation. Diabet Med 1998;15:539‐553. [DOI] [PubMed] [Google Scholar]
- 31. Society CD . China T2DM Prevention and Treatment Guideline (2013). Chin J Diabetes Mellitus 2014;6:447‐498. [Google Scholar]
- 32. Matthews DR, Hosker JP, Rudenski AS, Naylor BA, Treacher DF, Turner RC. Homeostasis model assessment: insulin resistance and beta‐cell function from fasting plasma glucose and insulin concentrations in man. Diabetologia 1985;28:412‐419. [DOI] [PubMed] [Google Scholar]
- 33. Hedblad B, Nilsson P, Janzon L, Berglund G. Relation between insulin resistance and carotid intima‐media thickness and stenosis in non‐diabetic subjects. Results from a cross‐sectional study in Malmo. Sweden. Diabet Med 2000;17:299‐307. [DOI] [PubMed] [Google Scholar]
- 34. World Health Organization . Global physical activity questionnaire. http://www.who.int/chp/steps/GPAQ/en/. Accessed Jul 24, 2015. [Google Scholar]
- 35. World Health Organization . GPAQ analysis guide. http://www.who.int/chp/steps/resources/database/en. Accessed Oct 3, 2015. [Google Scholar]
- 36. Zhang M, Zhu Y, Li P, Chang H, Wang X, Liu W, Zhang Y, et al. Associations between dietary patterns and impaired fasting glucose in Chinese men: a cross‐sectional study. Nutrients 2015;7:8072‐8089. [DOI] [PMC free article] [PubMed] [Google Scholar]
- 37. Vogtmann E, Xiang YB, Li HL, Levitan EB, Yang G, Waterbor JW, et al. Fruit and vegetable intake and the risk of colorectal cancer: results from the Shanghai Men's Health Study. Cancer Causes Control 2013;24:1935‐1945. [DOI] [PMC free article] [PubMed] [Google Scholar]
- 38. Abraham TM, Pedley A, Massaro JM, Hoffmann U, Fox CS. Association between visceral and subcutaneous adipose depots and incident cardiovascular disease risk factors. Circulation 2015;132:1639‐1647. [DOI] [PMC free article] [PubMed] [Google Scholar]
- 39. Kaul S, Rothney MP, Peters DM, Wacker WK, Davis CE, Shapiro MD, et al. Dual‐energy X‐ray absorptiometry for quantification of visceral fat. Obesity (Silver Spring) 2012;20:1313‐1318. [DOI] [PMC free article] [PubMed] [Google Scholar]
- 40. Seabolt LA, Welch EB, Silver HJ. Imaging methods for analyzing body composition in human obesity and cardiometabolic disease. Ann N Y Acad Sci 2015;1353:41‐59. [DOI] [PubMed] [Google Scholar]
- 41. Singal AG, Zhang P, Waljee AK, Ananthakrishnan L, Parikh ND, Sharma P, et al. Body composition features predict overall survival in patients with hepatocellular carcinoma. Clin Transl Gastroenterol 2016;7:e172. [DOI] [PMC free article] [PubMed] [Google Scholar]
- 42. Sharma P, Parikh ND, Yu J, Barman P, Derstine BA, Sonnenday CJ, et al. Bone mineral density predicts posttransplant survival among hepatocellular carcinoma liver transplant recipients. Liver Transpl 2016;22:1092‐1098. [DOI] [PMC free article] [PubMed] [Google Scholar]
- 43. Parikh ND, Zhang P, Singal AG, Derstine BA, Krishnamurthy V, Barman P, et al. Body composition predicts survival in patients with hepatocellular carcinoma treated with transarterial chemoembolization. Cancer Res Treat 2018;50:530‐537. [DOI] [PMC free article] [PubMed] [Google Scholar]
- 44. Shulman GI. Ectopic fat in insulin resistance, dyslipidemia, and cardiometabolic disease. N Engl J Med 2014;371:1131‐1141. [DOI] [PubMed] [Google Scholar]
- 45. Petersen KF, Dufour S, Savage DB, Bilz S, Solomon G, Yonemitsu S, et al. The role of skeletal muscle insulin resistance in the pathogenesis of the metabolic syndrome. Proc Natl Acad Sci U S A 2007;104:12587‐12594. [DOI] [PMC free article] [PubMed] [Google Scholar]
- 46. Ma RC, Chan JC. Type 2 diabetes in East Asians: similarities and differences with populations in Europe and the United States. Ann N Y Acad Sci 2013;1281:64‐91. [DOI] [PMC free article] [PubMed] [Google Scholar]
- 47. Wei JL, Leung JC, Loong TC, Wong GL, Yeung DK, Chan RS, et al. Prevalence and severity of nonalcoholic fatty liver disease in non‐obese patients: a population study using proton‐magnetic resonance spectroscopy. Am J Gastroenterol 2015;110:1306‐1314; quiz 1315. [DOI] [PubMed] [Google Scholar]
- 48. Liu CJ. Prevalence and risk factors for non‐alcoholic fatty liver disease in Asian people who are not obese. J Gastroenterol Hepatol 2012;27:1555‐1560. [DOI] [PubMed] [Google Scholar]
- 49. Nishioji K, Mochizuki N, Kobayashi M, Kamaguchi M, Sumida Y, Nishimura T, et al. The impact of PNPLA3 rs738409 genetic polymorphism and weight gain ≥10 kg after age 20 on non‐alcoholic fatty liver disease in non‐obese Japanese individuals. PLoS One 2015;10:e0140427. [DOI] [PMC free article] [PubMed] [Google Scholar]
Associated Data
This section collects any data citations, data availability statements, or supplementary materials included in this article.
Supplementary Materials