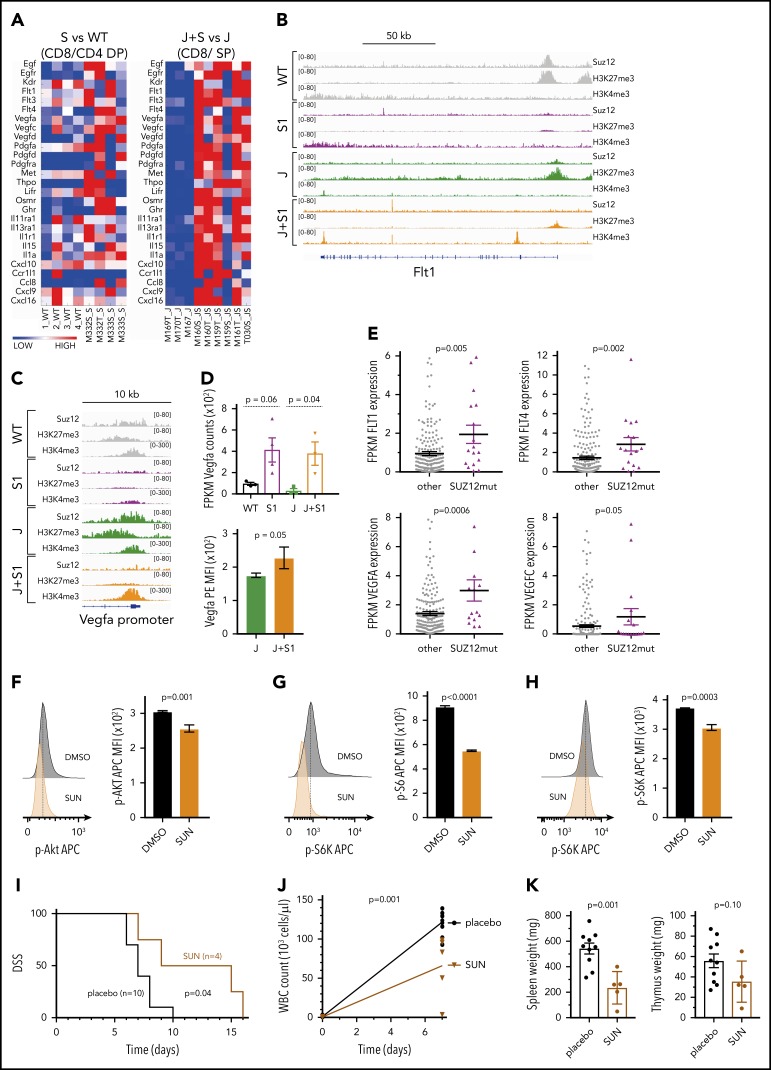
Figure 6.
Suz12 loss enhances VEGF/VEGFR signaling. (A) Heat map of cytokine-cytokine receptor interaction genes in leukemias with Suz12 inactivation (J+S1 vs J and S1 vs WT); gene expression is shown as normalized read counts. (B-C) ChIP-seq tracks showing Suz12, H3K27me3, and H3K4me3 signals in S1 vs WT and J+S1 vs J conditions for the Flt1 locus (B) and Vegfa promoter (C). (D) Vegfa mRNA expression measured as fragments per kilobase per million reads mapped (FPKM) values (RNA-seq, upper panel) and Vegfa protein expression quantified as MFI with SEM. P values were calculated with 2-tailed unpaired Student t test. (E) mRNA expression measured as FPKM values (RNA-seq). P values were calculated with 2-tailed Mann-Whitney test. (F-H) Flow cytometry plots and quantifications of MFI with SEM of phosphorylation levels of Akt (F), S6 (G), and S6K (H) in J+S1 leukemia cells treated for 3 hours with 5 μM sunitinib (SUN). P values, calculated with 2-tailed unpaired Student t test, denote significant differences between DMSO vs SUN. (I) Survival curve showing DSS of J+S1 leukemic mice treated with SUN. The P value was calculated with Gehan-Breslow-Wilcoxon test. (J) WBC counts of J+S1 leukemic mice after 5 days of treatment. The P value was calculated with a 2-tailed unpaired Student t test. (K) Weights of spleen and thymus at time of sacrifice of J+S1 leukemic mice treated with SUN vs placebo. P values were calculated with 2-tailed unpaired Student t test.

